
U.S. Bioplastics and Biopolymers Market Size and Forecast 2026 to 2035
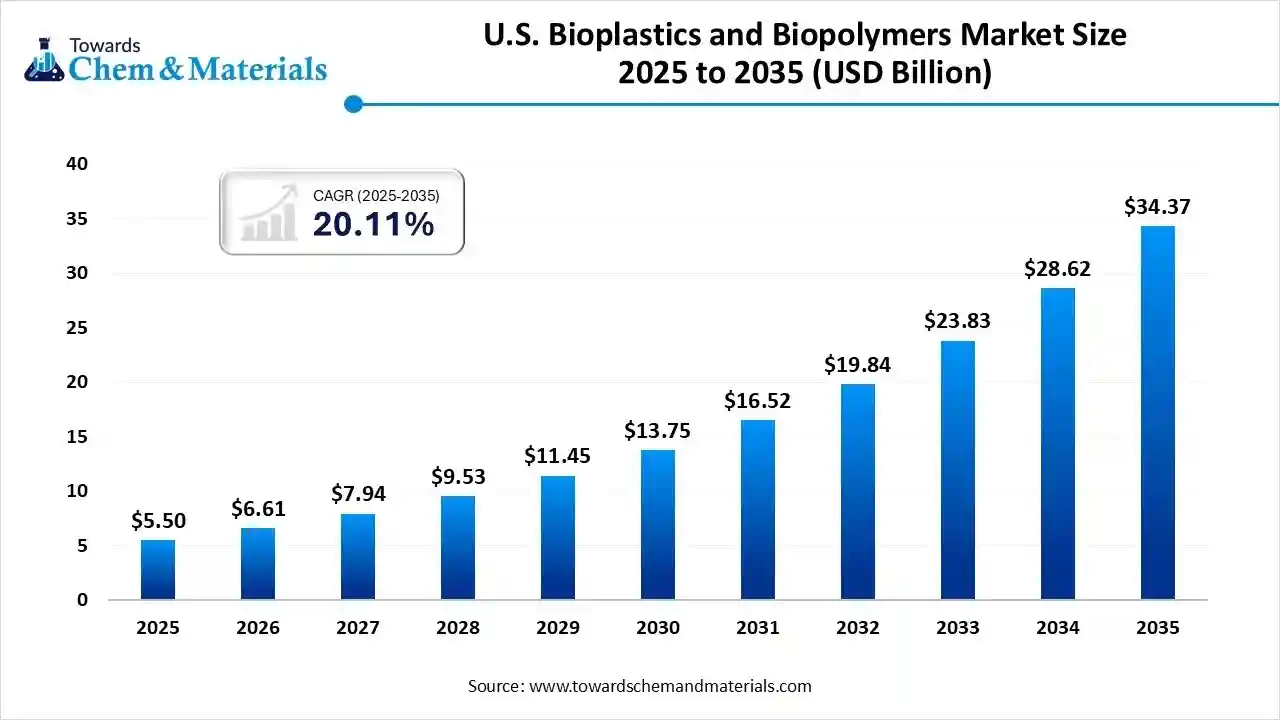
The U.S. bioplastics and biopolymers market size is calculated at USD 5.50 billion in 2025 and is predicted to increase from USD 6.61 billion in 2026 and is projected to reach around USD 34.37 billion by 2035, The market is expanding at a CAGR of 20.11% between 2026 and 2035. The global shift towards sustainability has accelerated market potential in the past few years.
Key Takeaways
- By application, the packaging segment held the largest revenue share of 58% in 2025 in terms of value.
- By raw material source, the corn starch segment led the market with the largest revenue share of 42% in 2025.
- By product form, the flexible bioplastics segment led the market with the largest revenue share of 60% in 2025.
- By distribution channel, the direct sales segment accounted for the largest revenue share of 52% in 2025.
From Waste to Wonder: The Rise of Bioplastic
The bioplastics are known as the plastics that are made from more natural or renewable sources instead of petroleum raw material, whereas biopolymers refer to large natural molecules that are made by living organisms, waste, and microbes. Furthermore, the biopolymers are considered the crucial material in the production of bioplastics.
U.S. Bioplastics and Biopolymers Market Trends
- The shift towards compostable packaging in the e-commerce sector is driving the regional manufacturing expansion through local sourcing trends in recent years. Also, the major e-commerce brands are looking for the compostable films, mailers, and cushioning where the PHA, PLA, and starch-based polymers are ideal materials.
- The heavy demand in food services and quick-serve chains is presenting new business models for the current bioplastic manufacturers. Moreover, the companies are implementing various promotion strategies, while attached materials like lids, straws, containers, and cutlery are mainly seen as eco-friendly or made by biopolymers.
- The adoption of bioplastics in the electronics and automotive sectors has aligned with evolving consumer preferences while offering fresh prospects in the past few years. Also, the manufacturers are actively trying to use polyester, polyimides, and cellulose blends, which are being offered with similar strength to the traditional parts in the current period
Report Scope
| Report Attribute | Details |
| Market Size Value in 2026 | USD 6.61 Billion |
| Revenue Forecast in 2035 | USD 34.37 Billion |
| Growth Rate | CAGR 20.11% |
| Forecast Period | 2026 - 2035 |
| Base Year | 2025 |
| Segments covered | By Application, By Raw Material Source, By Product Form, By Distribution Channel, |
| Key companies profiled | NatureWorks LLC, Braskem, Tate & Lyle, Danimer Scientific, TotalEnergies Corbion, Danimer Scientific, Eastman Chemical Company, Futerro, Novamont S.p.A., Biomer S.A., Cargill |
From Microbes to Markets: The Rise of Bio-PET and PHA
The shift towards precision bio-manufacturing and microbial fermentation is stimulating demand-led growth in manufacturing during the forecast period. Several companies have seen under significant investment and usage of the engineered microbes for the production of bio-PET, PHA, and advanced biopolymers with advanced purity in the past few years.
Value Chain Analysis of the U.S. Bioplastics and Biopolymers Market:
- Distribution to Industrial Users: The distribution of bioplastics and biopolymers to U.S. industrial users primarily involves direct supply from major manufacturers and compounders to a wide range of end-use industries, including packaging, automotive, textiles, and consumer goods. There are a limited number of specialized distributors who facilitate this supply chain.
- Key Players: NatureWorks LLC and Danimer Scientific
- Chemical Synthesis and Processing : The industry involves the use of advanced chemical synthesis and processing technologies, primarily fermentation and polymerization, to convert renewable biomass into sustainable materials. Key players in this market are involved in producing and refining these materials for various industrial applications.
- Key Players: Braskem and Eastman Chemical Company
- Regulatory Compliance and Safety Monitoring: Regulatory compliance and safety monitoring for the U.S. bioplastics and biopolymers market are managed by a framework of federal agencies, primarily the Food and Drug Administration (FDA), the U.S. Department of Agriculture (USDA), and the Federal Trade Commission (FTC), each addressing different aspects of the product lifecycle and claims.
U.S. Bioplastics and Biopolymers Market Regulatory Landscape: Global Regulations
| Country / Region | Regulatory Body | Key Regulations | Focus Areas |
|
United States |
Environmental Protection Agency (EPA) | FTC Green Guides | Consumer protection and clear labeling, Waste management and recycling contamination |
Segmental Insights
Application Insights
How did the Packaging Segment Dominate the U.S. Bioplastics and Biopolymers Market in 2025?
The packaging segment dominated the market with approximately 58% industry share in 2025 due to it being considered the largest source of single-use plastic waste in the region. Moreover, the increasing need for cleaner alternatives has contributed to the segment's growth in recent years. Also, offering faster certifications and lower production costs is likely to create lucrative opportunities in the coming years.
The medical and healthcare products segment is expected to grow at approximately 15 to 17% CAGR, owing to the biopolymers becoming safe, sterile, and eco-friendly medical materials. Also, several hospitals are observed in the heavy usage of single-use items like wound dressings, syringes, and diagnostic strips.
The agriculture segment is also notably growing, akin to farmers are shifting towards reducing soil and plastic pollution. Moreover, the farming sector in the United States has seen under heavy pressure reduction in the usage of microplastics and single-use plastics nowadays. Moreover, several biopolymers have been seen in improving soil health with moisture retention.
Raw Material Insights
Why Does the Corn Starch Segment Dominate the U.S. Bioplastics and Biopolymers Market by Raw Material?
The corn starch segment dominated the market with approximately 42% industry share in 2025 because the U.S. is one of the world's largest corn producers, ensuring reliable, affordable, and abundant feedstock. Corn starch is easy to process into PLA and other biopolymers using established technology, making it the most commercially mature raw material.
The sugarcane segment is expected to grow at approximately 14 to 16% CAGR because companies are shifting toward bio-based polyethylene (bio-PE) and advanced biopolymers made from sugarcane ethanol. Sugarcane-derived materials have better mechanical strength, higher purity, and lower carbon emissions compared to corn-based alternatives.
The soy segment is also notably growing because the U.S. soybean industry is large, well-supported, and highly innovative. Soy proteins and oils can be converted into adhesive films, coatings, and biodegradable plastics with excellent flexibility and moisture resistance.
Product Form Insights
How did the Flexible Bioplastics Segment Dominate the U.S. Bioplastics and Biopolymers Market in 2025?
The flexible bioplastics segment dominated the market with approximately 60% market share in 2025 because they are ideal for the largest-volume applications like bags, pouches, packaging films, labels, and wraps. These products require lightweight, stretchable, cost-effective materials, which flexible biopolymers like PLA blends and starch-based films provide.
The rigid bioplastics segment is expected to grow at approximately 13 to 14% CAGR, because industries like electronics, home goods, cosmetics, and automotive parts need strong, durable, and heat-resistant materials. New bio-based polyesters, polyamides, and composite biopolymers offer performance equal to or better than traditional plastics.
Distribution Channel Insights
How did the Direct Sales Segment Dominate the U.S. Bioplastics and Biopolymers Market in 2025?
The direct sales segment dominated the market with approximately 52% industry share in 2025 because bioplastic manufacturers work closely with packaging companies, brands, and industrial buyers who require technical support, customization, and consistent supply. These large customers prefer direct sourcing to negotiate pricing, secure long-term contracts, and ensure quality standards.
The online B2B platforms segment is expected to grow at approximately 17% CAGR, because buyers now want fast price comparisons, real-time inventory, transparent sourcing, and easy bulk ordering. Digital marketplaces make it simple for businesses to purchase bioplastics without negotiating through long sales cycles.
The distributors and traders segment is also notably growing because the market needs fast, flexible, and region-wide supply networks as more industries adopt bioplastics. Many customers require smaller order quantities or diverse grades, which distributors can provide more efficiently than manufacturers.
Recent Developments
- In August 2025, Cortec unveiled a biobased bioplastic called the Eco Works 100. Also, this newly launched product has 100% compatibility and has USDA certification as per the published report by the company.(Source: www.plasticsnews.com)
Top Vendors in the U.S. Bioplastics and Biopolymers Market & Their Offerings:
NatureWorks LLC
Corporate Information
- NatureWorks LLC is a U.S.-based bioplastics/biopolymer company.
- Headquarters: Plymouth / Minnetonka, Minnesota, USA.
- Parent / Ownership: Jointly owned by Cargill Incorporated (U.S. agribusiness conglomerate) and PTT Global Chemical (Thai petrochemical/chemical company).
- Core Product / Brand: Polylactic acid (PLA) biopolymer marketed under the brand name Ingeo.
History and Background
- The origin of NatureWorks dates to 1989, when it began as a research project by Cargill exploring the use of plant carbohydrates (e.g., from corn or other starches) to produce more sustainable plastics.
- In 2002, the Blair, Nebraska facility started operations making NatureWorks one of the first companies to produce PLA at commercial scale.
Key Developments and Strategic Initiatives
- Global capacity expansion: New PLA facility in Thailand: In 2021, NatureWorks obtained final authorization from its parent companies to invest over US$ 600 million to build a fully integrated PLA manufacturing complex in Thailand (lactic acid - lactide - polymer stages).
- Construction progress of Thailand complex: In 2022–2023, NatureWorks selected a general contractor and commenced early works construction at the Nakhon Sawan Biocomplex. The plant is expected to have 75,000 t/year capacity and produce the full portfolio of Ingeo grades. As of late 2023, the project is on track, with full production anticipated by 2025.
Mergers & Acquisitions
- In 2012, NatureWorks formed a joint venture with BioAmber (a bio-chemicals company) called AmberWorks. The purpose was to commercialize new bio-based polymer compositions combining NatureWorks’ PLA platform with BioAmber’s biochemical building blocks (such as succinic acid / PBS).
- Partnerships & Collaborations : More recently (2025), NatureWorks entered into a master collaboration agreement with CJ Biomaterials (CJ BIO) to develop novel biopolymer solutions. The collaboration focuses on combining PLA with PHA (or PHA based polymers) to broaden mechanical properties, degradation profiles, and application scope (e.g. nonwovens for hygiene, compostable films).
- Product Launches / Innovations: The core Ingeo™ PLA biopolymer line, offering a renewable, low-carbon alternative to traditional plastics, suitable for packaging, fibers, films, rigid and flexible formats.
Ingeo™ Extend an advanced PLA platform aiming to improve film processing, enable higher stretch in biaxial films, reduce production costs, and accelerate compostability (reportedly up to 8× faster than standard PLA in some cases).
Key Technology Focus Areas
- NatureWorks emphasizes renewable feedstocks: The company transforms plant-derived sugars often from corn or other starch sources into lactic acid via fermentation, then into lactide and ultimately polymerizes to produce PLA.
- They seem committed to circular-economy thinking: Their materials are designed to be used, composted, chemically recycled, or landfilled offering multiple after use pathways.
R&D Organisation & Investment
Their R&D and applications development center (in Minnesota) works on tailoring material properties (barrier, heat resistance, thermoformability), enabling PLA to compete with petroleum-based plastics across many applications.
SWOT Analysis
Strengths
- Largest global PLA production capacity (150,000 MT/yr in Nebraska, with further expansion ongoing) gives them scale advantage.
- Strong brand recognition and first mover advantage: Ingeo is one of the earliest and best-known PLA biopolymer brands globally.
- Robust global distribution and presence serves North America, Europe, Asia-Pacific, etc.
Weaknesses
- Heavy reliance on a single polymer class (PLA), which makes NatureWorks vulnerable to fluctuations in feedstock cost (corn or agricultural sugars) and commodity price volatility.
- Some limitations inherent to PLA: for example, heat resistance, mechanical toughness, or biodegradation limitations under certain conditions which restricts use in some high-performance applications.
Opportunities
- Growing global demand for sustainable, low-carbon, compostable materials, especially in packaging, foodservice, 3D printing, nonwovens and hygiene supporting strong long-term growth potential.
- Expansion into new application domains beyond traditional packaging e.g. 3D printing, medical, hygiene/nonwovens, compostable films where bioplastics may gain premium value.
Threats
- Emergence of competitors other biopolymer producers (PLA alternatives like PHA, or blends), or petrochemical backed “bio-attributed” polymers could erode market share.
- Feedstock supply risk & volatility: biopolymer feedstocks depend on agriculture (corn, sugar, etc.), which may be affected by climate, crop yields, competing demands (food vs plastics). This can cause cost unpredictability.
Recent News & Strategic Updates
- In November 2022, NatureWorks selected general contractor TTCL Public Company Limited for its new fully integrated PLA manufacturing facility in Thailand, marking the start of large-scale construction for the 75,000 t/year plant.
- On February 1, 2023, the company held a cornerstone laying ceremony for the Thailand facility, symbolizing a major milestone in its global expansion strategy.
Other Key Players
- NatureWorks LLC: A leading producer of Ingeo biopolymer (polylactic acid or PLA) from renewable resources, used in a wide range of applications from packaging and food service ware to textiles and industrial parts.
- Braskem: A major petrochemical company with a strong focus on sustainability, known for its "I'm green" brand of ethylene vinyl acetate (EVA) and polyethylene (PE) made from sugarcane ethanol.
- Tate & Lyle: A global provider of food and beverage ingredients that also supplies starches and other raw materials used in the production of bioplastics and biopolymers.
- Danimer Scientific: An American company specializing in the creation of biodegradable biopolymers known as Nodax PHA (polyhydroxyalkanoates), which can replace many conventional petroleum-based plastics.
- TotalEnergies Corbion
- Danimer Scientific
- Eastman Chemical Company
- Futerro
- Novamont S.p.A.
- Biomer S.A.
- Cargill
Segment Covered
By Application
- Packaging
- Food Packaging
- Beverage Packaging
- Flexible Packaging
- Agriculture
- Mulch Films
- Seed Coatings
- Consumer Goods
- Textiles
- Automotive Components
- Medical & Healthcare Products
By Raw Material Source
- Corn Starch
- Sugarcane
- Soy
- Cellulose
- Vegetable Oils
By Product Form
- Rigid Bioplastics
- Flexible Bioplastics
By Distribution Channel
- Direct Sales (Manufacturers)
- Distributors & Traders
- Online B2B Platforms
A Seven-Phase Framework
Our methodology is designed to be universally applicable across commodity chemicals, specialty chemicals, petrochemicals, construction chemicals, coatings, electronic chemicals, industrial gases, agrochemicals, water treatment chemicals, and performance materials. Each phase builds upon the last, creating a layered validation structure that minimizes estimation error and maximizes analytical confidence.
The framework ensures comprehensive market coverage, robust cross-validation, and reliable long-term forecasting — producing market estimates that withstand scrutiny from investors, regulators, and corporate strategy teams.

Seven-Phase Framework — Analytical Effort Distribution
Relative analytical effort allocated across each phase of the Chemicals & Materials research framework

Phase 1 - Secondary Research: Establishing the Foundation
Secondary research collects and evaluates publicly available information from authoritative sources, establishing the foundational understanding of market structure, value chain dynamics, competitive landscape, and end-use demand patterns. Every source is evaluated for credibility, recency, geographic relevance, and methodological soundness before inclusion.
Industry Associations
Sources include ACC, CEFIC, ICCA, JCIA, CPCIF, and SOCMA providing production volumes, consumption trends, capacity developments, and sustainability initiatives.
Company Disclosures
Annual reports, investor presentations, earnings transcripts, and regulatory filings reveal product portfolios, manufacturing footprints, capacity expansions, and revenue segmentation.
Government Databases
National statistical offices, customs authorities, environmental agencies, and industrial production databases provide verified statistics on output, trade flows, and regulatory compliance.
Trade Databases
UN Comtrade, ITC, Eurostat, and national customs authorities enable assessment of global product movement, import dependency, and export competitiveness across regions.
Our Secondary Research Sources
- Ministry of Chemicals and Fertilizers
- European Chemicals Agency
- United States Department of Energy
- Ministry of Industry and Information Technology
- Ministry of Economy Trade and Industry
- Ministry of Trade Industry and Energy
- National Institute of Standards and Technology
- Council of Scientific and Industrial Research
- Fraunhofer Society
- National Institute for Materials Science
Phase 2 — Supply-Side Assessment: Mapping Production Capabilities
Production Capacity Analysis
All major manufacturers are assessed for existing installed capacity, planned additions, expansions, new plant announcements, and technology adoption — mapped at global, regional, and country levels.
Capacity Utilization Adjustment
Installed capacity is adjusted using utilization rates based on demand conditions, feedstock availability, plant operating rates, maintenance schedules, and regulatory restrictions.
Manufacturer Revenue Analysis
Product-specific revenues, segment-level performance, regional distribution, average selling prices, and margin trends are evaluated to establish market value estimates.
Supply-Side Assessment — Capacity vs. Effective Production by Region
Illustrative comparison of installed capacity vs. effective production volume (after utilization rate adjustment) across major regions

Phase 3 — Demand-Side Assessment: Quantifying Chemical Consumption
Demand-side analysis quantifies chemical consumption across industries, applications, and geographies — identifying where and how chemicals are consumed throughout the value chain with precision.
End-Use Industry Analysis
Chemical demand is evaluated across automotive, construction, packaging, electronics, agriculture, healthcare, consumer goods, industrial manufacturing, energy and utilities, and water treatment. Industry output, production trends, and consumption intensity are analyzed to determine demand patterns.
Consumption Modeling
Demand is estimated using measurable indicators: kilograms per vehicle, kilograms per square meter of construction, dosage per cubic meter of water treated, kilograms per hectare of agricultural land, and kilograms per ton of manufactured products. Consumption factors are validated through industry publications and primary interviews.
Application Analysis
The market is segmented by application area to understand product performance requirements, formulation trends, technology adoption, customer preferences, and regulatory requirements improving demand accuracy and segmentation granularity.
Demand-Side Assessment — End-Use Industry Demand Distribution
Illustrative distribution of chemical & materials demand across key end-use industries

Phase 4 - Trade Flow Analysis: Balancing Regional Supply and Demand
Trade flow analysis reconciles regional supply and demand estimates through import and export data, identifying net supply positions, regional dependencies, and market imbalances. It serves as an independent validation layer that tests the consistency of supply-side and demand-side estimates.
Import Analysis
Import data is evaluated to determine volumes, source countries, product dependency, regional supply gaps, and pricing trends — identifying markets that rely heavily on external supply and where domestic production is insufficient to meet demand.
Export Analysis
Export assessments reveal production surplus, export competitiveness, regional manufacturing strength, and global market participation. Export patterns also help validate domestic production estimates and identify net exporting regions.
Apparent Consumption Model
Regional consumption is assessed using the standard apparent consumption formula:
Results identify net importing regions, net exporting regions, regional deficits, and surpluses — serving as an independent validation of supply and demand estimates.
Trade Flow Analysis — Net Supply Position by Region
Illustrative apparent consumption vs. domestic production across major regions — positive gap indicates net import dependency

Phase 5 — Primary Research: The Critical Validation Layer
Primary research tests and refines findings from secondary research through direct engagement with industry participants across the supply chain, demand side, and expert community. It captures intelligence that no database or published report can provide — the real-world experience of manufacturers, buyers, and specialists operating in the market.

Supply-Side Interviews
Conversations with chemical manufacturers, raw material suppliers, contract manufacturers, technology providers, and plant operators cover production trends, capacity utilization, pricing developments, technology shifts, and competitive dynamics.

Demand-Side Interviews
Engagement with OEMs, industrial consumers, procurement managers, distributors, formulators, and end-use manufacturers focuses on consumption trends, purchasing behavior, product substitution, demand outlook, and emerging applications.

Industry Expert Consultations
Additional interviews with industry consultants, independent experts, regulatory specialists, technical professionals, and research institutions provide deeper market context and validate key analytical assumptions.
Focus Areas of Primary Research:
Market Size & Forecast Validation
Revenue estimates, volume consumption, growth rates, forecast assumptions, regional demand.Supply Chain & Value Chain Assessment
Raw material sourcing, supply chain challenges, distribution networks, procurement practices.Production & Capacity Analysis
Manufacturing capacity, utilization rates, expansion projects, plant investments.Pricing & Cost Structure Analysis
Product pricing trends, feedstock costs, energy costs, margin pressures, pricing outlook.Competitive Landscape Assessment
Volume and value estimates confirmed to be fully consistent with one another before publicationInterview Volume by Market Scope
| Study Scope | Number of Interviews |
|---|---|
| Niche Market | 20 – 30 |
| Mid-Sized Market | 30 – 50 |
| Global Market | 50 – 80 |
| Highly Fragmented Market | 80 – 120 |
Interview Details:
Category : Manufacturers, Suppliers, Distributors, End Users, Experts/Associations
Average Duration : 30–60 Minutes
Interview Mode : Video calls, telephonic interviews, expert consultations
Interview Format : Structured / Semi-Structured questionnaire
Focus Areas of Primary Research:
Market Size & Forecast Validation :
Revenue estimates, volume consumption, growth rates, forecast assumptions, regional demand.
Supply Chain & Value Chain Assessment :
Raw material sourcing, supply chain challenges, distribution networks, procurement practices.
Production & Capacity Analysis :
Manufacturing capacity, utilization rates, expansion projects, plant investments.
Pricing & Cost Structure Analysis :
Product pricing trends, feedstock costs, energy costs, margin pressures, pricing outlook.
Competitive Landscape Assessment :
Market share, competitor positioning, strategic initiatives, partnerships, acquisitions.
Primary Research — Stakeholder Coverage by Category
Distribution of interview respondents across stakeholder categories (% share from PPT data)

Primary Research — Respondent Designation Profile
Seniority breakdown of interview respondents (% share from PPT data)

Primary Research — Geographic Coverage of Interviews
Regional distribution of primary research engagement (% share from PPT data)

Phase 6 — Data Triangulation and Market Validation
No single methodology is relied upon in isolation. Multiple independent estimation approaches are combined and reconciled to ensure consistency, accuracy, and analytical defensibility. Any material deviations between approaches are investigated and adjusted through additional validation cycles.
The final market size is derived through weighted triangulation of all validated methodologies. Any material deviations between approaches are investigated and adjusted through additional validation cycles. The outcome represents the most realistic assessment of the market based on available evidence and expert confirmation ensuring that volume and value estimates are fully consistent with one another.
Triangulation Framework — Input Contribution Weight
Relative weight each sizing input contributes to the final reconciled market estimate

Phase 7 — Forecast Modeling: Projecting Future Market Evolution
Forecasting evaluates the future trajectory of the market using a combination of quantitative indicators and qualitative assessments across economic, industry, and regulatory dimensions. Rather than simple extrapolation, each driver is independently modeled and integrated into a composite forecast.
Macroeconomic Indicators
GDP growth, industrial production, manufacturing output, construction activity, consumer spending, and capital investment form the quantitative foundation of long-term demand projections. These are applied at country, regional, and global levels.
Industry Growth Drivers
Urbanization, infrastructure development, industrialization, technological innovation, sustainability initiatives, and evolving product performance requirements are assessed at regional and industry levels — capturing both structural and cyclical demand drivers.
Capacity Expansion Analysis
Announced plant expansions, new manufacturing facilities, technology upgrades, and strategic investments are evaluated to determine future supply-demand dynamics and potential market tightness or oversupply situations.
Regulatory & Sustainability
Environmental regulations, chemical safety standards, emission reduction targets, circular economy initiatives, and sustainability requirements are incorporated as they often influence product adoption rates and market growth trajectories.
Scenario Forecast Range — Indexed Market Growth (Year 1–10)
Illustrative indexed growth trajectories across Base, Optimistic, and Pessimistic scenarios over a 10-year forecast horizon

Forecast Drivers — Relative Impact Score by Category
Impact score (0–100) of each driver type on chemicals & materials market forecast




Comments
Share your thoughts, ask a question, or provide feedback about this report.