
Iron and Steel Casting Market Size Analysis Report 2035
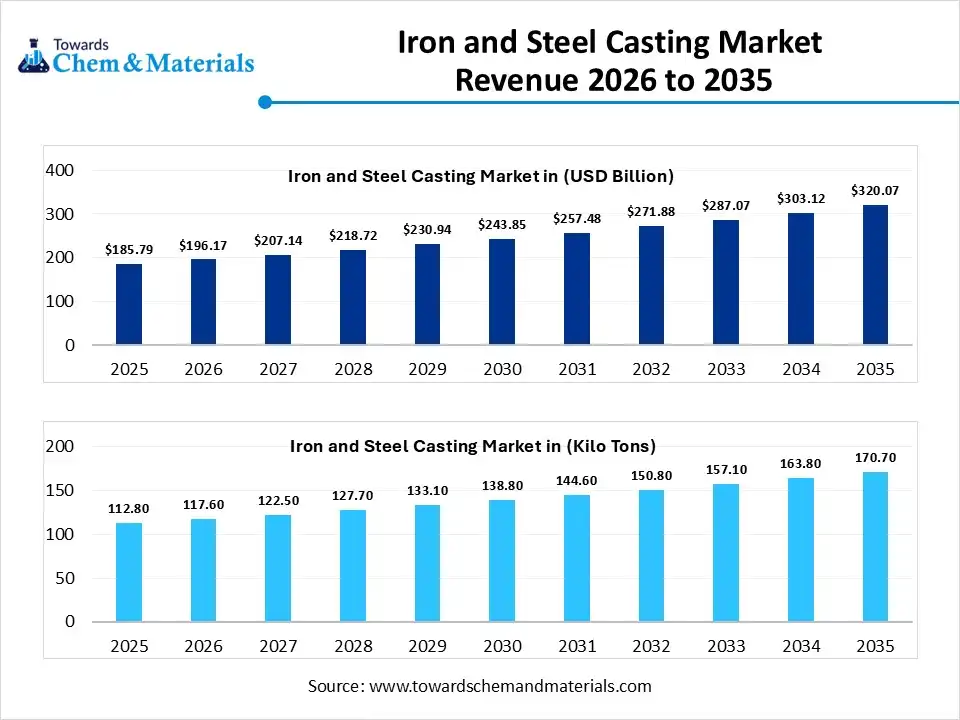
The global iron and steel casting market size was estimated at USD 185.79 billion in 2025 and is expected to increase from USD 196.17 billion in 2026 to USD 320.07 billion by 2035, growing at a CAGR of 5.59% from 2026 to 2035. In terms of volume, the market is projected to grow from 112.8 kilo tons in 2025 to 170.7 kilo tons by 2035. growing at a CAGR of 4.23% from 2026 to 2035. Asia Pacific dominated the iron and steel casting market with the largest volume share of 56.23% in 2025. The markets growth is driven by industrial expansion, urbanization, and the demand for durable, high-performance components, particularly in emerging economies.
This market involves the manufacturing of solid metal parts by pouring molten iron or steel into a mold cavity, where it cools and solidifies. Iron and steel castings are fundamental to heavy industry, providing the structural integrity and complex geometries required for engine blocks, industrial machinery, and infrastructure components. The process is favored for its ability to produce high-strength, durable, and cost-effective parts at scale, often incorporating alloys to achieve specific thermal or mechanical properties.
Market Highlights
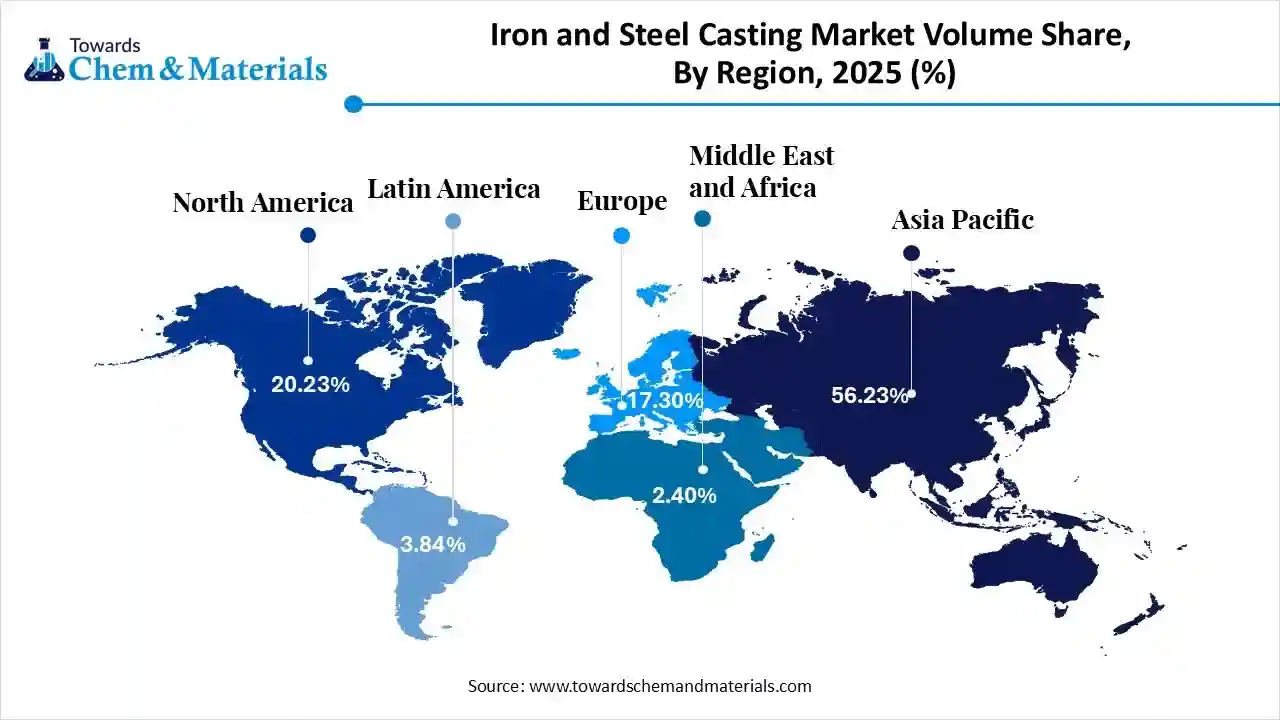
- The Asia Pacific dominated the global iron and steel casting market with the largest volume share of 56.23% in 2025.
- The iron and steel casting market in North America is expected to grow at a substantial CAGR of 4.76% from 2026 to 2035.
- The Europe iron and steel casting market segment accounted for the major volume share of 17.30% in 2025.
- By material type, the iron casting segment dominated the market and accounted for the largest volume share of 78.23% in 2025.
- By material type, the steel casting segment is expected to grow at the fastest CAGR of 5.68% from 2026 to 2035 in terms of volume.
- By process, the sand-casting segment led the market with the largest revenue volume share of 38.5% in 2025.
- By application, the automotive components segment dominated the market and accounted for the largest volume share of 32% in 2025.
- By end use, the industrial manufacturing segment led the market with the largest revenue volume share of 41% in 2025.
What Is The Significance Of The Iron And Steel Casting Market?
The iron and steel casting market is significant as the backbone for critical components in major industries like automotive, construction, and energy, providing strength, durability, and cost-efficiency for essential parts that drive economic growth, infrastructure, and manufacturing, with demand rising due to global industrial expansion and infrastructure projects. Its importance stems from creating complex, high-performance parts that withstand extreme conditions, enabling technological advancement while offering recyclability and supporting sustainability goals.
Iron And Steel Casting Market Growth Trends:
- Advanced Manufacturing: Adoption of 3D printing (additive manufacturing) for complex parts, faster prototyping, and reduced waste.
- Automation & Digitalization: Increased automation, simulation software (casting process simulation), and smart manufacturing to boost efficiency.
- Sustainability Focus: Development of eco-friendly materials and processes to meet stricter environmental regulations.
- High-Performance Materials: Focus on specialized alloys for demanding applications in aerospace and defense.
Report Scope
| Report Attribute | Details |
| Market Size and Volume in 2026 | USD 196.17 Billion / 117.60 Kilo Tons |
| Revenue Forecast in 2035 | USD 320.07 Billion / 170.70 Kilo Tons |
| Growth Rate | CAGR 5.59% |
| Forecast Period | 2026 - 2035 |
| Base Year | 2025 |
| Units Considered | Value (Billion / Million), Volume (Kilo Tons) |
| Dominant Region | Asia Pacific |
| Segment Covered | By Material Type, By Casting Process, By Application Area, By End-Use Sector, By Regions |
| Key companies profiled | Nucor Corporation (USA), Kobe Steel, Ltd. (Japan), Neenah Foundry Company (USA), Metal Technologies Inc. (USA), ArcelorMittal S.A. , Waupaca Foundry, Inc. , Georg Fischer AG (GF Casting Solutions), Hitachi Metals, Ltd. (Proterial) , Thyssenkrupp AG , Brakes India Private Limited , Grede Holdings LLC , Nippon Steel Corporation , POSCO Holdings , Tata Steel Limited , China Baowu Steel Group , Nelcast Limited |
Key Technological Shifts In The Iron And Steel Casting Market:
The iron and steel casting market is shifting towards Industry 4.0 digital integration (AI, IoT, digital twins) for process optimization, sustainability (electric furnaces, recycling), advanced automation, developing lightweight, high-strength alloys, and leveraging 3D printing for complex designs, all aimed at boosting efficiency, reducing defects, cutting costs, and meeting stringent environmental and quality demands.
Trade Analysis Of the Iron And Steel Casting Market: Import & Export Statistics
- According to Global Export data, the world shipped 97 shipments of Iron Steel Casting under HSN Code 73239300300, exported by 1 exporter to 27 buyers. Most of these exports go to Argentina and Hong Kong.
- The leading global exporters are China, Argentina, and Brazil, with China leading at 90 shipments, Argentina with 3 shipments, and Brazil with 2 shipments.
- Furthermore, India Export data reports that India exported 550,477 shipments of Casting Iron through 2,001
- Indian exporters to 8,839 buyers. The main destination countries are the United States, the United Arab Emirates, and Germany.
- India is the top exporter of Casting Iron with 480,521 shipments, followed by China with 73,814 shipments and Vietnam with 66,846 shipments.
Iron And Steel Casting Market Value Chain Analysis
- Metal Melting & Casting Processing: Iron and steel castings are produced through processes such as raw material charging, induction or electric arc furnace melting, alloying, mold and core preparation, sand casting, die casting, continuous casting, heat treatment, and surface finishing to achieve the required mechanical properties.
- Key players: Hitachi Metals, Tata Metaliks, Amtek Auto, casting divisions of ArcelorMittal.
- Quality Testing and Certification: Iron and steel castings require certifications related to mechanical strength, dimensional accuracy, metallurgical composition, and industrial safety compliance. Key certifications include ISO 9001 quality management, ISO 14001 environmental standards, ASTM casting standards, EN standards, and non-destructive testing (NDT) certifications.
- Key players: ISO (International Organization for Standardization), ASTM International, Bureau Veritas, TÜV SÜD
- Distribution to Industrial Users: Iron and steel castings are supplied to automotive OEMs, construction and infrastructure projects, machinery manufacturers, energy equipment producers, railways, and heavy industrial applications.
- Key players: Srikalahasthi Pipes, Electrosteel Castings, MetalTek International
Iron & Steel Casting Regulatory Landscape: Global Regulations
| Country / Region | Regulatory Body | Key Regulations | Focus Areas | Notable Notes |
| North America (USA & Canada) | U.S. EPA (Environmental Protection Agency) OSHA (Occupational Safety and Health Administration) U.S. Department of Transportation (DOT) Environment and Climate Change Canada (ECCC) |
Clean Air Act (CAA) – NESHAP (National Emission Standards) for Iron & Steel Foundries Clean Water Act (CWA) – NPDES permits Resource Conservation and Recovery Act (RCRA) OSHA 29 CFR (machine safety, 0respirable silica) DOT Hazardous Materials Regulations |
Air emissions control (metal fumes, particulate) Wastewater/effluent management Hazardous waste classification & disposal Worker safety & dust exposure Transport of hazardous materials |
U.S. EPA has NESHAP Subpart HHHHH specific to iron and steel foundries; OSHA enforces controls for respirable crystalline silica and machine safety; Canada’s provincial regulators add local emission limits. |
| European Union | European Commission European Chemicals Agency (ECHA) National Environment & Workplace Safety Agencies |
REACH Regulation (EC 1907/2006) CLP Regulation (EC 1272/2008) Industrial Emissions Directive (IED) Waste Framework Directive National foundry/industrial air quality standards |
Chemical safety and registration Hazard classification & worker communication BAT (Best Available Techniques) for emissions Waste & sludge management |
EU IED sets emission limits (PM/COD/SOâ‚‚) and BAT Reference Documents (BREF) for metal production and foundries; REACH affects raw materials (alloys, coatings, binders). |
| Asia Pacific | China MEE (Ministry of Ecology & Environment) State Administration for Market Regulation (SAMR) Japan METI/MOE India MoEFCC / CPCB South Korea MoE |
China Air/Water Pollution Prevention Laws China Emission Standards for Steel/Foundry Japan CSCL & PRTR India Air & Water Acts; Hazardous Waste Rules Korea K-Air Act & Waste Control Act |
Local emission/effluent permitting Chemical registration & hazard labelling Worker safety & dust control Waste sand & slag handling |
China enforces strict foundry emission standards (dust/PM) and regional inspections; India’s foundry clusters often require common effluent treatment; Japan and Korea have chemical & machine safety requirements. |
| South America | Brazil IBAMA Argentina Ministry of Environment Chile Ministry of Environment |
National Air/Water Quality Regulations Solid Waste & Hazardous Materials Laws |
Air particulate limits Waste management Community/industrial permitting |
Regional regulators require air permits and controls on effluent/waste slag; foundry waste is often classified under hazardous waste lists if contaminated. |
| Middle East & Africa | UAE MOCCAE (Ministry of Climate Change & Environment) Saudi SASO South African Department of Mineral Resources & Energy (DMRE) |
National Environmental Protection Laws Hazardous Materials Control Rules |
Industrial emissions Worker health & safety Chemical handling & storage |
Regulatory frameworks vary but generally align with international best practices (GHS, OSHA-like workplace safety); air quality and dust control are common requirements for foundries. |
Segmental Insights
Material Type Insights
How Did The Iron Casting Segment Dominate The Iron And Steel Casting Market In 2025?
The iron casting segment dominated the market with a share of 78.23% % in 2025. Iron casting dominates the market due to its cost efficiency, excellent castability, and high vibration-damping properties. It is widely used in automotive engine blocks, pipes, machinery bases, and infrastructure components, where strength, durability, and large-volume production are critical requirements.
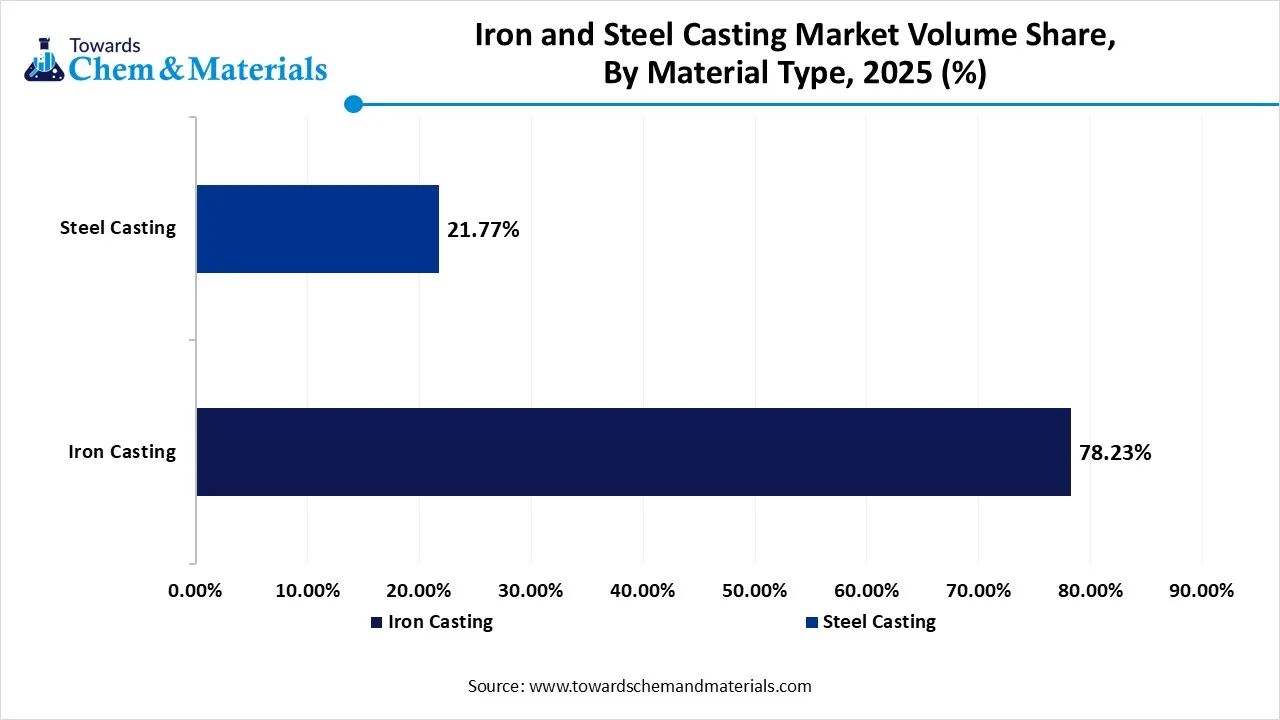
The steel casting segment is projected to grow at the fastest CAGR between 2026 and 2035 in the market. Steel casting is preferred for applications requiring superior tensile strength, toughness, and resistance to extreme temperatures and pressures. It is extensively used in heavy machinery, energy equipment, mining components, and critical structural parts where higher mechanical performance justifies the higher production cost.
Iron and Steel Casting Market Volume and Share, By Material Type, 2025-2035
| By Material Type | Market Volume Share (%), 2025 | Market Volume (Kilo Tons)2025 | Market Volume (Kilo Tons)2035 | CAGR(%) 2026-2035 | Market Volume Share (%), 2035 |
| Iron Casting | 78.23% | 88.2 | 130.3 | 4.43% | 76.34% |
| Steel Casting | 21.77% | 24.6 | 40.4 | 5.68% | 23.66% |
Process Insights
Which Process Segment Dominates the Iron And Steel Casting Market In 2025?
The sand-casting segment dominated the market with a share of 38.5% in 2025. Sand casting is the most widely used process due to its flexibility, low tooling cost, and ability to produce large and complex components. It is commonly employed for iron and steel castings in automotive, railway, energy, and industrial equipment applications, especially for low-to-medium production volumes.
The die casting segment is projected to grow at the fastest CAGR between 2026 and 2035 in the market. Die casting offers high dimensional accuracy, smooth surface finishes, and faster production cycles, making it suitable for precision components. While more common in non-ferrous metals, steel and iron die casting is used in specialized applications requiring consistent quality and tighter tolerances.
Application Insights
How Did the Automotive Components Segment Dominate The Iron And Steel Casting Market In 2025?
The automotive components segment dominated the market with a share of 32% in 2025. The automotive sector represents a major application area, driven by demand for engine parts, transmission housings, brake components, and suspension systems. Cast iron and steel are favored for their strength, thermal resistance, and ability to withstand high mechanical stress in vehicles.
The railway & infrastructure segment is projected to grow at the fastest CAGR between 2026 and 2035 in the market. Railway and infrastructure applications utilize iron and steel castings for tracks, couplings, wheels, bridges, and construction machinery. Growth is supported by expanding rail networks, urban infrastructure projects, and government investments in transportation modernization.
End-Use Sector Insights
Which End Use Sector Segment Dominates The Iron And Steel Casting Market In 2025?
The industrial manufacturing segment dominated the market with a share of 41% in 2025. Industrial manufacturing relies heavily on iron and steel castings for machine tools, pumps, valves, compressors, and heavy equipment. The segment benefits from ongoing industrialization, capacity expansion, and demand for durable components across multiple manufacturing sectors.
The energy (wind/solar) segment is projected to grow at the fastest CAGR between 2026 and 2035 in the market. The energy sector uses iron and steel castings in wind turbine hubs, gearboxes, solar mounting structures, and power generation equipment. Rising investments in renewable energy and grid infrastructure are increasing demand for high-strength, corrosion-resistant cast components.
Regional Insights
The iron and steel casting market size was valued at USD 104.47 billion in 2025 and is expected to be worth around USD 179.98 billion by 2035, exhibiting at a compound annual growth rate (CAGR) of 5.61% over the forecast period from 2026 to 2035.
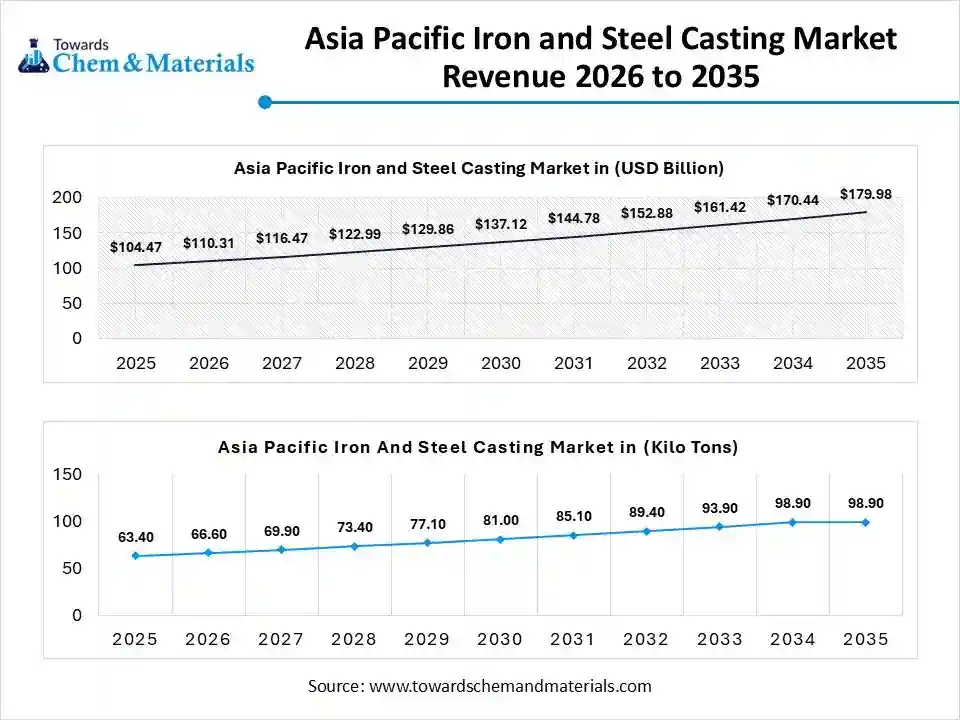
The iron and steel casting market volume was estimated at 63.4 kilo tons in 2025 and is projected to reach 98.9 kilo tons by 2035, growing at a CAGR of 5.06% from 2026 to 2035.Asia Pacific dominated the market with a share of 56.23% in 2025. The Asia Pacific iron and steel casting market dominates global demand, supported by rapid industrialization, large-scale infrastructure development, and strong automotive and machinery manufacturing bases. Countries across the region benefit from cost-efficient labor, abundant raw material availability, and expanding foundry capacities. Government-led infrastructure programs and rising urbanization continue to sustain long-term casting demand.
China: Iron and Steel Casting Market Growth Trends
China represents the largest national market for iron and steel castings globally, driven by its extensive automotive, construction equipment, railways, and heavy machinery industries. The country hosts a dense concentration of foundries with advanced production capabilities. Ongoing investments in smart manufacturing, electric vehicles, and infrastructure modernization are reinforcing steady demand for high-volume cast components.
North America: Iron And Steel Casting Market Strong Regulatory Standards
The North America iron and steel casting market volume was estimated at 22.8 kilo tons in 2025 and is projected to reach 34.7 kilo tons by 2035, growing at a CAGR of 4.76% from 2026 to 2035. North America is expected to have fastest growth in the market in the forecast period between 2026 and 2035. North America’s market is characterized by technological maturity, strong regulatory standards, and demand for high-performance and precision castings. Growth is supported by automotive light-weighting initiatives, industrial machinery upgrades, and energy sector investments. The region increasingly emphasizes sustainable casting practices, automation, and recycling of ferrous scrap materials.
Iron and Steel Casting Market Volume and Share, By Region, 2025-2035
| By Region | Market Volume Share (%), 2025 | Market Volume (Kilo Tons)2025 | Market Volume (Kilo Tons)2035 | CAGR(%) 2026-2035 | Market Volume Share (%), 2035 |
| North America | 20.23% | 22.8 | 34.7 | 4.76% | 20.31% |
| Europe | 17.30% | 19.5 | 27.3 | 3.79% | 15.98% |
| Asia Pacific | 56.23% | 63.4 | 98.9 | 5.06% | 57.93% |
| Latin America | 3.84% | 4.3 | 5.8 | 3.37% | 3.42% |
| Middle East & Africa | 2.40% | 2.7 | 4.0 | 4.52% | 2.36% |
United States: Iron and Steel Casting Market Growth Trends
The U.S. market benefits from a robust automotive, aerospace, defense, and industrial equipment manufacturing base. Domestic reshoring trends, infrastructure rehabilitation projects, and demand for customized and value-added cast components are supporting market stability. Adoption of advanced casting technologies and compliance with environmental regulations remain key competitive factors.
The European Iron And Steel Casting Market Is Driven By The Advanced Applications.
The Europe iron and steel casting market volume was estimated at 19.5 kilo tons in 2025 and is projected to reach 27.3 kilo tons by 2035, growing at a CAGR of 3.79% from 2026 to 2035. Europe’s iron and steel casting market is driven by advanced engineering applications, stringent quality standards, and strong demand from automotive, industrial machinery, and renewable energy sectors. The region focuses heavily on energy-efficient production methods and low-emission foundry operations. Technological innovation and regulatory compliance significantly influence market dynamics across European economies.
Germany: Iron and Steel Casting Market Growth Trends
Germany plays a central role in Europe’s market due to its strong automotive, industrial machinery, and precision engineering industries. German foundries emphasize lightweight, high-quality, and complex cast components. Continuous investment in Industry 4.0, automation, and sustainable manufacturing practices supports the country’s competitive position in markets.
South America Iron And Steel Casting Market Growth Is Driven By Growth In Sectors
Latin America market volume was estimated at 4.3 kilo tons in 2025 and is anticipated to reach 5.8 kilo tons by 2035, growing at a CAGR of 3.37% from 2026 to 2035. South America’s iron and steel casting market is gradually expanding, supported by growth in construction, agricultural machinery, mining equipment, and transportation sectors. The region benefits from local raw material availability and rising industrial investments. However, market growth remains influenced by economic cycles, infrastructure spending patterns, and industrial modernization efforts.
Brazil: Iron and Steel Casting Market Growth Trends
Brazil is the leading iron and steel casting market in South America, driven by automotive manufacturing, heavy equipment production, and infrastructure development. The country hosts a well-established foundry industry supplying both domestic and export markets. Government infrastructure initiatives and industrial recovery trends are contributing to moderate but steady casting demand growth.
The Middle East & Africa Iron And Steel Casting Market Is Driven By Infrastructure Development
The Middle East & Africa iron and steel casting market volume was estimated at 2.7 kilo tons in 2025 and is projected to reach 4.0 kilo tons by 2035, growing at a CAGR of 4.52% from 2026 to 2035.The Middle East & Africa market is supported by energy projects, infrastructure development, and rising industrial diversification. Demand is primarily driven by construction equipment, oil and gas infrastructure, and power generation sectors. Increasing investments in local manufacturing capabilities are gradually reducing reliance on imported cast components.
GCC Countries: Iron and Steel Casting Market Growth Trends
GCC countries are emerging as important markets for iron and steel castings due to large-scale infrastructure projects, industrial diversification strategies, and expanding manufacturing bases. Demand is concentrated in construction machinery, energy infrastructure, and transportation applications. Government-backed industrial localization programs are encouraging regional foundry capacity expansion.
Recent Developments
- In June 2025, Thyssenkrupp Steel launched Continuous Casting Line 4 (SGA 4) and a modernized hot strip mill in Duisburg. This project separates casting and rolling processes, aiming to increase annual capacity to 3.1 million metric tons. The new facility is designed to produce high-strength premium steels for electric mobility, lightweight construction, and the energy sector.(Source: gmk.center)
- In August 2025, Vinod Cookware introduced its new Ferona lightweight cast iron cookware range, which features a non-reactive matte enamel coating that removes the necessity for traditional seasoning. This collection provides the durability and uniform heating properties of cast iron while being lighter and simpler to care for compared to conventional types. (Source: smestreet.in )
- In September 2025, Walter introduced the Drivox·tec IKON DD170 Supreme, a solid carbide drill intended for precision holemaking in steel and cast iron (ISO material groups P and K). (Source: www.aero-mag.com)
Top players in the Iron And Steel Casting Market & Their Offerings:
- Nucor Corporation (USA): Nucor is a leading American steel producer with significant iron and steel casting operations. It offers ductile iron and steel cast components used in automotive, heavy equipment, and construction sectors, supported by localized manufacturing and a focus on operational efficiency.
- Kobe Steel, Ltd. (Japan): Kobe Steel produces iron and steel castings tailored for automotive, construction, and industrial equipment industries, emphasizing precision, material quality, and performance.
- Neenah Foundry Company (USA): Neenah Foundry supplies ductile iron and gray iron castings for waterworks, construction, and industrial markets. Known for robust quality control and application-specific casting solutions, it serves utility and infrastructure sectors.
- Metal Technologies Inc. (USA): Metal Technologies offers engineered steel and iron cast components for energy, process equipment, and industrial applications. The company emphasizes custom solutions and advanced machining integration.
- ArcelorMittal S.A.
- Waupaca Foundry, Inc.
- Georg Fischer AG (GF Casting Solutions)
- Hitachi Metals, Ltd. (Proterial)
- Thyssenkrupp AG
- Brakes India Private Limited
- Grede Holdings LLC
- Nippon Steel Corporation
- POSCO Holdings
- Tata Steel Limited
- China Baowu Steel Group
- Nelcast Limited
Segments Covered:
By Material Type
- Iron Casting
- Gray Iron Casting
- Ductile Iron Casting
- White Iron Casting
- Malleable Iron Casting
- Steel Casting
- Carbon Steel Casting
- Alloy Steel Casting
- Stainless Steel Casting
By Casting Process
- Sand Casting
- Die Casting
- Investment Casting (Lost Wax)
- Centrifugal Casting
By Application Area
- Automotive
- Industrial Machinery
- Pipes & Fittings
- Railway
- Energy & Power
By End-Use Sector
- Automotive & Transportation
- Construction & Infrastructure
- Industrial Manufacturing
- Energy, Oil & Gas
- Aerospace & Defense
By Regions
- North America
- U.S.
- Canada
- Mexico
- Europe
- Germany
- UK
- France
- Italy
- Spain
- Asia Pacific
- China
- India
- Japan
- South Korea
- Latin America
- Brazil
- Argentina
- Middle East & Africa
- Saudi Arabia
- South Africa
A Seven-Phase Framework
Our methodology is designed to be universally applicable across commodity chemicals, specialty chemicals, petrochemicals, construction chemicals, coatings, electronic chemicals, industrial gases, agrochemicals, water treatment chemicals, and performance materials. Each phase builds upon the last, creating a layered validation structure that minimizes estimation error and maximizes analytical confidence.
The framework ensures comprehensive market coverage, robust cross-validation, and reliable long-term forecasting — producing market estimates that withstand scrutiny from investors, regulators, and corporate strategy teams.

Seven-Phase Framework — Analytical Effort Distribution
Relative analytical effort allocated across each phase of the Chemicals & Materials research framework

Phase 1 - Secondary Research: Establishing the Foundation
Secondary research collects and evaluates publicly available information from authoritative sources, establishing the foundational understanding of market structure, value chain dynamics, competitive landscape, and end-use demand patterns. Every source is evaluated for credibility, recency, geographic relevance, and methodological soundness before inclusion.
Industry Associations
Sources include ACC, CEFIC, ICCA, JCIA, CPCIF, and SOCMA providing production volumes, consumption trends, capacity developments, and sustainability initiatives.
Company Disclosures
Annual reports, investor presentations, earnings transcripts, and regulatory filings reveal product portfolios, manufacturing footprints, capacity expansions, and revenue segmentation.
Government Databases
National statistical offices, customs authorities, environmental agencies, and industrial production databases provide verified statistics on output, trade flows, and regulatory compliance.
Trade Databases
UN Comtrade, ITC, Eurostat, and national customs authorities enable assessment of global product movement, import dependency, and export competitiveness across regions.
Our Secondary Research Sources
- Ministry of Chemicals and Fertilizers
- European Chemicals Agency
- United States Department of Energy
- Ministry of Industry and Information Technology
- Ministry of Economy Trade and Industry
- Ministry of Trade Industry and Energy
- National Institute of Standards and Technology
- Council of Scientific and Industrial Research
- Fraunhofer Society
- National Institute for Materials Science
Phase 2 — Supply-Side Assessment: Mapping Production Capabilities
Production Capacity Analysis
All major manufacturers are assessed for existing installed capacity, planned additions, expansions, new plant announcements, and technology adoption — mapped at global, regional, and country levels.
Capacity Utilization Adjustment
Installed capacity is adjusted using utilization rates based on demand conditions, feedstock availability, plant operating rates, maintenance schedules, and regulatory restrictions.
Manufacturer Revenue Analysis
Product-specific revenues, segment-level performance, regional distribution, average selling prices, and margin trends are evaluated to establish market value estimates.
Supply-Side Assessment — Capacity vs. Effective Production by Region
Illustrative comparison of installed capacity vs. effective production volume (after utilization rate adjustment) across major regions

Phase 3 — Demand-Side Assessment: Quantifying Chemical Consumption
Demand-side analysis quantifies chemical consumption across industries, applications, and geographies — identifying where and how chemicals are consumed throughout the value chain with precision.
End-Use Industry Analysis
Chemical demand is evaluated across automotive, construction, packaging, electronics, agriculture, healthcare, consumer goods, industrial manufacturing, energy and utilities, and water treatment. Industry output, production trends, and consumption intensity are analyzed to determine demand patterns.
Consumption Modeling
Demand is estimated using measurable indicators: kilograms per vehicle, kilograms per square meter of construction, dosage per cubic meter of water treated, kilograms per hectare of agricultural land, and kilograms per ton of manufactured products. Consumption factors are validated through industry publications and primary interviews.
Application Analysis
The market is segmented by application area to understand product performance requirements, formulation trends, technology adoption, customer preferences, and regulatory requirements improving demand accuracy and segmentation granularity.
Demand-Side Assessment — End-Use Industry Demand Distribution
Illustrative distribution of chemical & materials demand across key end-use industries

Phase 4 - Trade Flow Analysis: Balancing Regional Supply and Demand
Trade flow analysis reconciles regional supply and demand estimates through import and export data, identifying net supply positions, regional dependencies, and market imbalances. It serves as an independent validation layer that tests the consistency of supply-side and demand-side estimates.
Import Analysis
Import data is evaluated to determine volumes, source countries, product dependency, regional supply gaps, and pricing trends — identifying markets that rely heavily on external supply and where domestic production is insufficient to meet demand.
Export Analysis
Export assessments reveal production surplus, export competitiveness, regional manufacturing strength, and global market participation. Export patterns also help validate domestic production estimates and identify net exporting regions.
Apparent Consumption Model
Regional consumption is assessed using the standard apparent consumption formula:
Results identify net importing regions, net exporting regions, regional deficits, and surpluses — serving as an independent validation of supply and demand estimates.
Trade Flow Analysis — Net Supply Position by Region
Illustrative apparent consumption vs. domestic production across major regions — positive gap indicates net import dependency

Phase 5 — Primary Research: The Critical Validation Layer
Primary research tests and refines findings from secondary research through direct engagement with industry participants across the supply chain, demand side, and expert community. It captures intelligence that no database or published report can provide — the real-world experience of manufacturers, buyers, and specialists operating in the market.

Supply-Side Interviews
Conversations with chemical manufacturers, raw material suppliers, contract manufacturers, technology providers, and plant operators cover production trends, capacity utilization, pricing developments, technology shifts, and competitive dynamics.

Demand-Side Interviews
Engagement with OEMs, industrial consumers, procurement managers, distributors, formulators, and end-use manufacturers focuses on consumption trends, purchasing behavior, product substitution, demand outlook, and emerging applications.

Industry Expert Consultations
Additional interviews with industry consultants, independent experts, regulatory specialists, technical professionals, and research institutions provide deeper market context and validate key analytical assumptions.
Focus Areas of Primary Research:
Market Size & Forecast Validation
Revenue estimates, volume consumption, growth rates, forecast assumptions, regional demand.Supply Chain & Value Chain Assessment
Raw material sourcing, supply chain challenges, distribution networks, procurement practices.Production & Capacity Analysis
Manufacturing capacity, utilization rates, expansion projects, plant investments.Pricing & Cost Structure Analysis
Product pricing trends, feedstock costs, energy costs, margin pressures, pricing outlook.Competitive Landscape Assessment
Volume and value estimates confirmed to be fully consistent with one another before publicationInterview Volume by Market Scope
| Study Scope | Number of Interviews |
|---|---|
| Niche Market | 20 – 30 |
| Mid-Sized Market | 30 – 50 |
| Global Market | 50 – 80 |
| Highly Fragmented Market | 80 – 120 |
Interview Details:
Category : Manufacturers, Suppliers, Distributors, End Users, Experts/Associations
Average Duration : 30–60 Minutes
Interview Mode : Video calls, telephonic interviews, expert consultations
Interview Format : Structured / Semi-Structured questionnaire
Focus Areas of Primary Research:
Market Size & Forecast Validation :
Revenue estimates, volume consumption, growth rates, forecast assumptions, regional demand.
Supply Chain & Value Chain Assessment :
Raw material sourcing, supply chain challenges, distribution networks, procurement practices.
Production & Capacity Analysis :
Manufacturing capacity, utilization rates, expansion projects, plant investments.
Pricing & Cost Structure Analysis :
Product pricing trends, feedstock costs, energy costs, margin pressures, pricing outlook.
Competitive Landscape Assessment :
Market share, competitor positioning, strategic initiatives, partnerships, acquisitions.
Primary Research — Stakeholder Coverage by Category
Distribution of interview respondents across stakeholder categories (% share from PPT data)

Primary Research — Respondent Designation Profile
Seniority breakdown of interview respondents (% share from PPT data)

Primary Research — Geographic Coverage of Interviews
Regional distribution of primary research engagement (% share from PPT data)

Phase 6 — Data Triangulation and Market Validation
No single methodology is relied upon in isolation. Multiple independent estimation approaches are combined and reconciled to ensure consistency, accuracy, and analytical defensibility. Any material deviations between approaches are investigated and adjusted through additional validation cycles.
The final market size is derived through weighted triangulation of all validated methodologies. Any material deviations between approaches are investigated and adjusted through additional validation cycles. The outcome represents the most realistic assessment of the market based on available evidence and expert confirmation ensuring that volume and value estimates are fully consistent with one another.
Triangulation Framework — Input Contribution Weight
Relative weight each sizing input contributes to the final reconciled market estimate

Phase 7 — Forecast Modeling: Projecting Future Market Evolution
Forecasting evaluates the future trajectory of the market using a combination of quantitative indicators and qualitative assessments across economic, industry, and regulatory dimensions. Rather than simple extrapolation, each driver is independently modeled and integrated into a composite forecast.
Macroeconomic Indicators
GDP growth, industrial production, manufacturing output, construction activity, consumer spending, and capital investment form the quantitative foundation of long-term demand projections. These are applied at country, regional, and global levels.
Industry Growth Drivers
Urbanization, infrastructure development, industrialization, technological innovation, sustainability initiatives, and evolving product performance requirements are assessed at regional and industry levels — capturing both structural and cyclical demand drivers.
Capacity Expansion Analysis
Announced plant expansions, new manufacturing facilities, technology upgrades, and strategic investments are evaluated to determine future supply-demand dynamics and potential market tightness or oversupply situations.
Regulatory & Sustainability
Environmental regulations, chemical safety standards, emission reduction targets, circular economy initiatives, and sustainability requirements are incorporated as they often influence product adoption rates and market growth trajectories.
Scenario Forecast Range — Indexed Market Growth (Year 1–10)
Illustrative indexed growth trajectories across Base, Optimistic, and Pessimistic scenarios over a 10-year forecast horizon

Forecast Drivers — Relative Impact Score by Category
Impact score (0–100) of each driver type on chemicals & materials market forecast




Comments
Share your thoughts, ask a question, or provide feedback about this report.