
Plastic Waste Management Market Size, Competitive Landscape Analysis Report 2035
The global plastic waste management market size was valued at USD 39.58 billion in 2025 and is expected to hit around USD 56.65 billion by 2035, exhibiting at a compound annual growth rate (CAGR) of 3.65% over the forecast period from 2026 to 2035. Europe dominated the plastic waste management market with the largest revenue share of 37.10% in 2025.The growth of the market is driven by the growing environmental significance, like the management of pollution and sustainable development through recycling and waste management.
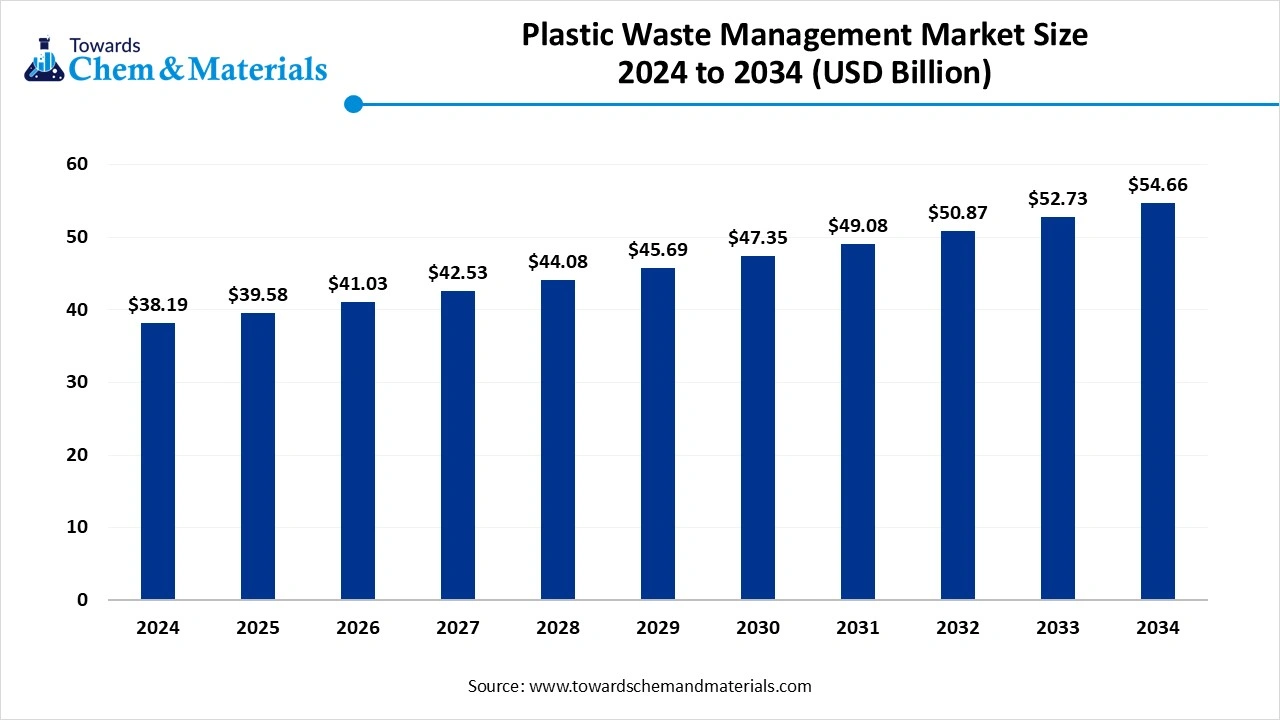
Key Takeaways
- The Europe plastic waste management market held the largest share of 37.10% of the global market in 2025.
- By service type, the collection & transportation segment held the highest market share of 36.60% in 2025.
- By treatment method, the mechanical recycling segment held the highest market share of 43.54% in 2025.
- By polymer type, the polyethylene segment held the largest revenue share of 39.77% in 2025.
- By source, the residential segment held the largest market share of 45.89% in 2025.
- By sorting technology, the optical / NIR-based segment held the highest market share of 41.14% in 2025.
- By end use, the packaging & bottles segment held the largest market share of 49.70% in 2025.
Market Overview
What Is The Significance Of The Plastic Waste Management Market?
The plastic waste management market is significant because it provides critical solutions to plastic pollution, protecting environmental and human health by reducing waste in landfills and oceans. This market drives economic benefits through resource and energy savings from recycling, spurs innovation in waste-to-energy and biodegradable materials, and fosters growth in sectors like packaging and consumer goods by promoting circular economy principles.
Plastic Waste Management Market Outlook:
- Industry Growth Overview: Between 2025 and 2034, the global plastic waste management market is projected to expand steadily, driven by increasing plastic consumption, stricter environmental regulations, and rising awareness of circular economy principles.
Sustainability Trends: Sustainability lies at the core of the market’s evolution, with growing adoption of mechanical and chemical recycling technologies to convert waste into reusable raw materials. Bio-based and biodegradable plastics are gaining traction as part of closed-loop strategies. - Global Expansion & Innovation: Major waste management companies and polymer producers are forming partnerships to scale circular economy projects and recycling infrastructure. Investments in advanced sorting, pyrolysis, and depolymerization technologies are increasing, especially in Asia and Europe.
Report Scope
| Report Attributes | Details |
| Market Size in 2026 | USD 41.02 Billion |
| Expected Size by 2035 | USD 56.65 Billion |
| Growth Rate from 2026 to 2035 | CAGR 3.65% |
| Base Year of Estimation | 2025 |
| Forecast Period | 2026 - 2035 |
| Dominant Region | Europe |
| Segment Covered | By Service Type, By Treatment Method, By Polymer Type, By Source, By Sorting Technology, By End Use of Recovered Plastics, By Region |
| Key Companies Profiled | Remondis , Biffa , Indorama Ventures , LyondellBasell , Eastman , Tomra , ALPLA , Plastipak , KW Plastics , MBA Polymers |
Key Technological Shifts In The Plastic Waste Management Market:
Key technological shifts are transforming the plastic waste management market through advancements in advanced recycling, digitalization, and new plastic alternatives. These innovations are enabling a more circular economy by improving sorting efficiency, broadening the range of recyclable materials, and introducing viable, sustainable options, which increase the opportunity for the growth of the market.
Market Dynamics
Market Drivers
The plastic waste management market is driven by rising plastic consumption across packaging, consumer goods, and industrial applications, coupled with growing environmental concerns over land and marine pollution. Governments are strengthening regulations on single-use plastics, landfill disposal, and extended producer responsibility, which is increasing demand for organized collection, sorting, recycling, and recovery systems. Rapid urbanization and population growth are intensifying municipal solid waste generation, pushing cities to invest in structured plastic waste handling infrastructure. Brand owners and retailers are also committing to recycled content targets, which is reinforcing downstream demand for recycled plastics and formal waste management solutions. In addition, increasing public awareness of plastic pollution is supporting higher participation in segregation and recycling programs.
Market Restraints
The plastic waste management market faces restraints from fragmented collection systems and inadequate segregation at the source, particularly in developing economies. Contamination of plastic waste streams raises processing costs and reduces the quality of recycled output, limiting end-use applications. High capital requirements for sorting facilities, recycling plants, and waste-to-energy infrastructure can restrict market entry and scalability. Volatility in virgin plastic prices often undermines the cost competitiveness of recycled plastics. In some regions, limited enforcement of waste regulations and informal recycling practices constrain the development of organized waste management value chains.
Market Opportunities
Significant opportunities exist in advanced recycling technologies, including chemical recycling methods that can process mixed and contaminated plastics into high-quality feedstock. Expansion of extended producer responsibility programs is creating long-term service contracts for waste collection, sorting, and recycling operators. Growth in demand for recycled plastics in packaging, automotive, and construction is encouraging investment in capacity expansion and quality enhancement. Digital solutions for waste tracking, material traceability, and route optimization are improving operational efficiency. Emerging markets investing in urban waste infrastructure and circular economy initiatives present additional long-term growth potential.
Market Challenges
The plastic waste management market faces challenges in achieving economic viability while meeting environmental and regulatory expectations. Scaling recycling operations requires consistent feedstock supply, skilled labor, and reliable offtake markets for recycled materials. Managing complex multi-layer and composite plastics remains technically difficult and costly. Coordination across municipalities, producers, recyclers, and consumers is often weak, slowing system-level improvements. Ensuring compliance with evolving regulations and sustainability standards while maintaining profitability continues to be a key challenge for market participants.
Trade Analysis Of Plastic Waste Management Market: Import & Export Statistics
- India encourages the export of plastic scrap to manage its unmanaged waste. The country exports to 41 countries, with its top five trade partners accounting for most of the export value.(Source : enterclimate.com)
- In terms of volume, Germany, Japan, the United Kingdom, the Netherlands, and the United States are among the top exporters of plastic waste.(Source: interplasinsights.com)
- India exported 66 shipments of Plastic Waste from Oct 2023 to Sep 2024 (TTM). These exports were made by 19 Indian Exporters to 22 Buyers, marking a growth rate of 164% compared to the preceding twelve months.(Source: www.volza.com)
- Globally, the top three exporters of Plastic Waste are Vietnam, China, and the United States. Vietnam leads the world in Plastic Waste and HSN Code 3923 exports with 25,108 shipments, followed by China with 2,617 shipments, and the United States taking the third spot with 1,415 shipments.(Source : www.volza.com)
- Most of the Plastic Waste exports from India go to India, the United Arab Emirates, and Sri Lanka. (Source: www.volza.com)
Plastic Waste Management Market Value Chain Analysis
- Chemical Synthesis and Processing : Plastic waste is collected, sorted, cleaned, and processed through mechanical recycling, pyrolysis, and chemical depolymerization to recover reusable polymers or energy.
Key players: Veolia Environnement S.A., SUEZ Recycling and Recovery, Waste Management Inc., Covestro AG, LyondellBasell Industries. - Quality Testing and Certification : Processed plastics undergo purity, contamination, and recyclability testing to meet environmental and product safety standards such as ISO 14001 and the EU Waste Framework Directive.
- Key players: SGS, Intertek, UL Solutions, Bureau Veritas
- Distribution to Industrial Users : Recycled plastics are distributed to the packaging, automotive, and construction industries for manufacturing sustainable products and components.
Key players: Berry Global Inc., Plastipak Holdings, BASF SE, Alpla Group.
Plastic Waste Management Regulatory Landscape: Global Regulations
| Region / Country | Regulatory Body | Key Regulations / Frameworks | Focus Areas | Notable Notes |
| United States | U.S. Environmental Protection Agency (EPA), Department of Energy (DOE), State-Level Agencies (e.g., CalRecycle, NYDEC) | - Save Our Seas 2.0 Act (2020) - Resource Conservation and Recovery Act (RCRA) - Break Free From Plastic Pollution Act (proposed) |
- Circular economy and recycling initiatives - Extended producer responsibility (EPR) at the state level - Single-use plastic bans in various states |
No unified federal plastic law; several states (California, New York, Oregon) lead in EPR and plastic bans. The U.S. EPA promotes the National Recycling Strategy (2021) for a 50% recycling rate by 2030. |
| European Union | European Commission (DG ENV), European Chemicals Agency (ECHA) | - EU Single-Use Plastics Directive (EU 2019/904) - Waste Framework Directive (2008/98/EC) - Packaging and Packaging Waste Regulation (PPWR, under revision) |
- Extended producer responsibility (EPR) - Design for recyclability - Plastic packaging reduction targets |
The EU has the most comprehensive plastic regulatory system. Member states enforce bans on single-use plastics and require 90% collection of plastic bottles by 2029 under the SUP Directive. |
| China | Ministry of Ecology and Environment (MEE), National Development and Reform Commission (NDRC) | - Plastic Pollution Control Regulation (2020) - Solid Waste Pollution Prevention and Control Law (amended 2020) |
- Ban on non-degradable plastics - Import restrictions on plastic waste - Promotion of biodegradable materials |
China’s “National Sword Policy” (2018) reshaped global recycling flows. Nationwide bans on non-degradable plastics are being phased in through 2025. |
| India | Ministry of Environment, Forest and Climate Change (MoEFCC), Central Pollution Control Board (CPCB) | - Plastic Waste Management Rules, 2016 (amended 2022) - Extended Producer Responsibility (EPR) Guidelines, 2022 |
- Producer responsibility and recycling traceability - Single-use plastic ban (effective July 2022) - Waste segregation and labeling |
India’s framework mandates traceable EPR compliance via a digital portal. Producers must meet annual recycling targets. Strong emphasis on collection networks and municipal coordination. |
| Japan | Ministry of the Environment (MOE), METI | - Plastic Resource Circulation Act (2022) - Container and Packaging Recycling Law (1995; revised 2020) |
- Eco-design and recyclability - Corporate waste management plans - Product labeling and traceability |
Japan emphasizes corporate responsibility and circular design. The 2022 Act mandates eco-friendly material selection and reuse planning by manufacturers. |
| Middle East (UAE, Saudi Arabia) | Environment Agency – Abu Dhabi (EAD), Saudi Standards, Metrology and Quality Organization (SASO) | - UAE Federal Law No. 12 (2018) on Waste Management - SASO Technical Regulation for Biodegradable Plastics (2020) |
- Biodegradable packaging mandates - Waste segregation and landfill diversion |
GCC countries are adopting bio-based plastic certification and recycling investment programs to meet Vision 2030 sustainability goals. |
Segmental Insights
Service Type Insights
How did the Collection and Transportation Segment dominate the Plastic Waste Management Market in 2025?
The collection and transportation segment dominated the market with a share of 36.60% in 2025. This segment forms the foundation of plastic waste management, involving organized collection, sorting, and transfer of plastic waste from residential, industrial, and commercial areas to recycling or disposal facilities. Governments and private companies are increasingly investing in logistics optimization and smart tracking systems to enhance operational efficiency. Growth in urban waste volumes and mandatory segregation policies are driving the demand for robust collection and transportation infrastructure across developing economies.
The chemical recycling segment expects significant growth in the plastic waste management market during the forecast period. Chemical recycling transforms complex or contaminated plastics into basic monomers or fuels using processes such as pyrolysis, depolymerization, or gasification. Unlike mechanical recycling, it can handle mixed or multi-layered waste streams, reducing landfill dependency. Rising focus on sustainability and technological advancements by major chemical firms like BASF and SABIC is expanding this segment. Its scalability and compatibility with existing refining systems make it a key innovation in the next generation of waste management technologies.
Treatment Method Insights
Which Treatment Method Segment Dominated The Plastic Waste Management Market In 2025?
The mechanical recycling segment dominated the market with a share of 43.54% in 2025. Mechanical recycling involves the physical processing of plastic waste through sorting, cleaning, shredding, melting, and remolding into new products. Investment in advanced sorting and washing equipment has improved the purity of recyclates. Mechanical recycling remains the most widely adopted treatment approach, particularly in packaging and consumer goods sectors where consistent polymer recovery is essential.
The chemical recycling segment expects significant growth in the plastic waste management market during the forecast period. This method breaks down polymers at the molecular level using heat or solvents, producing monomers that can be re-polymerized into high-quality plastics. The growing regulatory push for circular plastics and rising R&D investments in depolymerization and pyrolysis technologies are propelling this segment. Chemical recycling contributes significantly to achieving net-zero waste goals and complements existing mechanical recycling systems.
Polymer Type Insights
How Did The Polyethylene Segment Dominate The Plastic Waste Management Market In 2025?
The polyethylene segment dominated the market with a share of 39.77% in 2025. Polyethylene dominates global plastic consumption and recycling efforts, driven by its wide use in packaging films, bags, and containers. Both low-density (LDPE) and high-density (HDPE) variants are being recycled using advanced mechanical and chemical processes. Recycling PE reduces landfill pressure and carbon emissions while creating new applications in pipes, films, and household goods. The shift toward circular packaging initiatives by major brands is enhancing demand for recycled PE in sustainable manufacturing and packaging solutions.
The polypropylene segment expects significant growth in the plastic waste management market during the forecast period. Polypropylene is extensively used in automotive parts, fibers, and packaging due to its lightweight and chemical-resistant properties. Advanced sorting and compatibilization techniques are enhancing the recyclability of PP from mixed waste streams. Growing interest in post-consumer recycled PP by consumer goods manufacturers and stringent plastic waste regulations are further supporting this segment’s expansion.
Source Insights
Which Source Segment Dominated The Plastic Waste Management Market In 2025?
The residential segment dominated the market with a share of 45.89% in 2025. The residential sector contributes most of the plastic waste through single-use packaging, household products, and disposable plastics. Efficient curbside collection and public awareness programs are essential to increase segregation at the source. The growing trend toward responsible consumer behavior and government initiatives promoting extended producer responsibility (EPR) are improving the efficiency of residential waste recovery.
The commercial and institutional segment expects significant growth in the plastic waste management market during the forecast period. This segment includes waste generated from retail, hospitality, offices, and healthcare sectors. Commercial waste collection systems are usually better organized, enabling easier sorting and recycling. Institutional collaborations with waste recyclers and the introduction of corporate sustainability mandates are increasing demand for efficient plastic waste management solutions in this sector.
Sorting Technology Insights
How did the Optical/ NIR-Based Automated Sorting Segment dominate the Plastic Waste Management Market in 2025?
The optical/NIR-based automated sorting segment dominated the market with a share of 41.14% in 2025. Optical and near-infrared (NIR) sorting systems use advanced sensors to identify plastics by color, polymer type, and composition. The adoption of these technologies in large-scale recycling facilities ensures efficient processing of mixed waste streams. The growing focus on digital waste tracking and AI-assisted optical sorting is further boosting efficiency in industrial-scale recycling operations.
The AI/robotics-enhanced sorting segment expects significant growth in the plastic waste management market during the forecast period. AI and robotics-enhanced systems integrate machine learning and robotic arms to identify, pick, and sort plastic waste with high accuracy. These systems adapt to varying contamination levels and evolving packaging materials. The integration of smart analytics and real-time monitoring makes AI-based sorting ideal for high-throughput recycling environments, ensuring consistency and precision in processed materials.
End Use Insights
Which End Use Segment Dominated The Plastic Waste Management Market In 2025?
The packaging and bottles segment dominated the market with a share of 49.70% in 2025. Recycled plastics are widely used in producing bottles, films, and flexible packaging materials. The use of recycled PET and HDPE helps reduce dependence on virgin polymers and carbon emissions. Growth in e-commerce and changing consumer preferences toward eco-friendly packaging are further driving this segment’s demand.
The textiles and fibers segment expects significant growth in the plastic waste management market during the forecast period. The textiles and fibers segment uses recycled plastics, especially PET, to produce fabrics, carpets, and industrial textiles. With rising awareness of sustainable fashion, several apparel brands are adopting recycled fibers for clothing and accessories. The transformation of plastic waste into fiber applications demonstrates the material’s versatility and supports global efforts to reduce landfill accumulation and promote a circular textile economy.
Regional Insights
Europe Plastic Waste Management Market Size, Industry Report 2035
The Europe plastic waste management market size was valued at USD 14.25 billion in 2025 and is expected to be worth around USD 20.43 billion by 2035, exhibiting at a compound annual growth rate (CAGR) of 3.67% over the forecast period from 2026 to 2035. Europe dominated the market with a share of 37.10% in 2024.
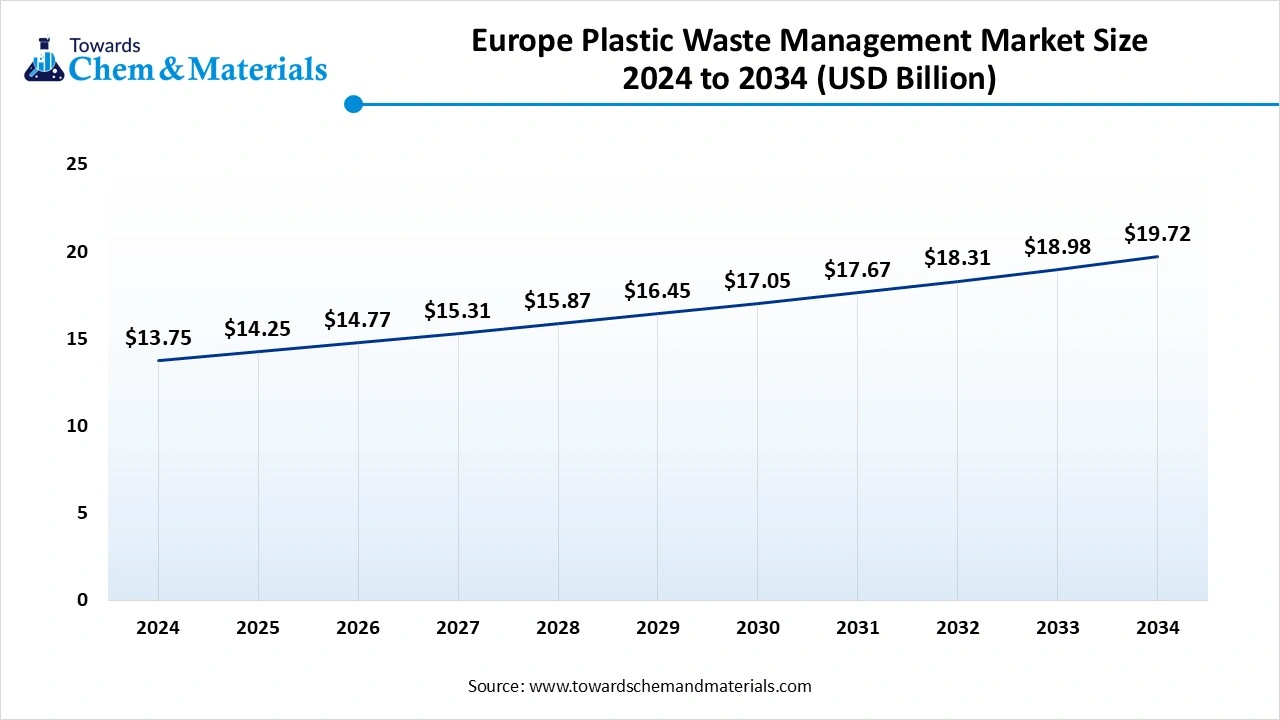
Europe leads the global plastic waste management landscape due to stringent environmental regulations and a strong circular economy framework. Countries across the EU have adopted extended producer responsibility (EPR) laws, mandating high recycling rates. The region also emphasizes innovation in sustainable plastics and industrial-scale recovery of post-consumer and post-industrial waste, positioning Europe as a hub for high-efficiency recycling practices and eco-conscious consumer behavior.
UK Growth Is Driven By The Policies And Investments In The Market
The UK is rapidly advancing in plastic waste management through national recycling programs, infrastructure upgrades, and policy interventions. Emphasis on sorting technology, automated facilities, and chemical recycling is increasing recycling efficiency. Retailers and manufacturers are promoting recycled content in packaging, driven by consumer demand and regulatory targets. Public-private partnerships and investments in AI-based sorting, robotics, and sustainable materials further strengthen the UK market, positioning it as a significant contributor to the European recycling ecosystem.
Asia Pacific Has Seen Growth Driven By Increased Urbanization.
Asia Pacific is expected to have significant growth in the market in the forecast period. Asia Pacific is experiencing dynamic growth in plastic waste management due to increasing urbanization, industrialization, and plastic consumption. Mechanical and chemical recycling facilities are expanding, supported by government initiatives and private investments. Rising awareness of environmental sustainability, coupled with circular economy adoption, is driving regional demand for advanced sorting technologies, waste-to-resource solutions, and sustainable end-use applications in packaging and textiles.
India's Market Growth Is Driven By The Growing Industrial Demand, Which Fuels The Growth.
India’s plastic waste management market is growing rapidly due to urbanization, regulatory initiatives, and increasing industrial demand for recycled materials. The government’s push toward single-use plastic bans, EPR regulations, and infrastructure development is promoting collection and recycling efficiency. Mechanical and chemical recycling technologies are gaining traction, particularly for post-consumer PET, HDPE, and polypropylene. Public awareness campaigns, NGO interventions, and private sector participation are also driving innovation in waste collection, sorting, and sustainable end-use applications across packaging, textiles, and construction.
How Will North America Be Considered a Notable Region in the Plastic Waste Management Market?
North America is a notable region in the global market, primarily due to the need to manage substantial plastic waste and transition toward a circular economy. There is a strong emphasis on transforming plastic waste into a valuable resource. Technologies such as chemical recycling are gaining popularity, enabling the processing of hard-to-recycle plastics. The region has a well-established waste management ecosystem, with significant investments from large companies like Waste Management, Inc., Republic Services, and Clean Harbors in advanced Material Recovery Facilities.
U.S. Plastic Waste Management Market Trends
The U.S has a unique position within this region, being one of the largest producers of plastic waste globally, albeit with a relatively low but increasing plastic recycling rate. The U.S. is a key driver in the development and implementation of advanced recycling technologies and intelligent waste management systems. Major waste management firms, including Waste Management, Inc., Republic Services, and Clean Harbors, dominate the market.
Emergence of Latin America in the Plastic Waste Management Market
Latin America is rapidly emerging in the global market, primarily characterized by growing waste generation, increasing regulatory pressures, and a shift toward circular economy models. The region generates significant amounts of plastic waste, with Brazil, Mexico, Argentina, and Colombia being the largest producers. Stricter environmental regulations and bans on single-use plastics are driving the need for effective waste management, while an active informal recycling sector enhances collection and processing capacities.
Brazil Plastic Waste Management Market Trends
Brazil is acknowledged as a mature market within the region, focusing on improving its waste management through the National Solid Waste Policy, which incorporates a mix of formalized systems, public-private partnerships, and informal waste picker cooperatives. The country is also working to reverse the trend of plastic waste through new legislation aimed at eliminating single-use plastics. Braskem is a key player in this effort, notably producing green polyethylene from sugarcane.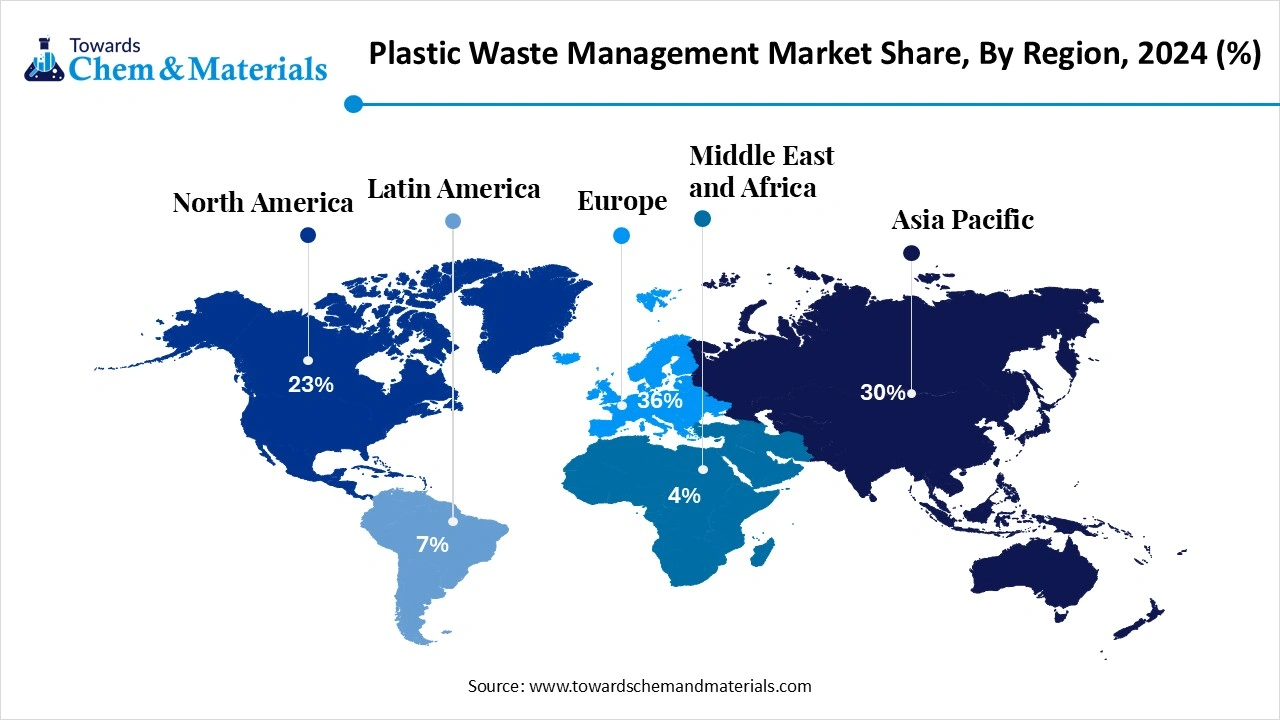
How will the Middle East and Africa Surge in the Plastic Waste Management Market?
The Middle East and Africa are witnessing significant market growth, driven by high population growth and urban development in countries like Saudi Arabia, the UAE, and Nigeria. These developments are generating massive amounts of municipal solid waste, prompting governments to invest in improved infrastructure. The adoption of AI-powered sorting, robotic automation, and chemical recycling is increasing to manage complex, mixed plastic waste and convert non-recyclable materials into energy.
The UAE Plastic Waste Management Market Trends
The UAE is emerging as an active participant in this region by accelerating its shift toward a circular economy to reduce plastic waste. The government has implemented a comprehensive ban on single-use plastic bags and is promoting EPR. Companies like Bee'ah and Veolia are engaged in developing advanced PET recycling facilities. The market is rapidly embracing AI-driven sorting and waste-to-energy technologies.
Country-level Investments & Funding Trends for the Plastic Waste Management Industry:
- India: India’s e-waste is set to double to 9 million tonnes by 2030, accompanied by rapid growth in lithium-ion battery waste driven by consumer electronics and electric vehicles.(Source : andeglobal.org)
- India: Government regulations, such as the Plastic Waste Management (Second Amendment) Rules, 2022, and the Extended Producer Responsibility (EPR) framework, are creating a regulatory push for businesses to invest in waste management and recycling.(Source : www.banyannation.com)
- China: The World Bank has provided substantial financing and technical assistance to China for waste management, totaling over $2.3 billion for municipal solid waste management projects since 2014. (Source : documents1.worldbank.org)
- USA: Corporations are making large investments, such as the Alliance to End Plastic Waste, which committed over $1 billion to develop and scale solutions.(Source: corporate.dow.com)
- Germany: From 2019 to 2024, Germany attracted over 20 percent of all plastics and rubber FDI projects in the EU-27 region, confirming its position as a top investment destination. (Source: www.gtai.de)
Recent Developments
- In January 2026, a student-centered initiative aimed at combating climate change through the control of plastic pollution was launched in Kathmandu. The Climate Smart School program has been introduced by South Asian Youth for Sustainable Development (SAYS) with the support of the Konrad Adenauer Foundation (KAS). The initiative was launched on January 16 at NIC Academy in Sanobharyang, Kathmandu.(Source: english.khabarhub.com)
- In January 2026, it was reported that more of Victoria, Australia’s hard-to-recycle plastics, including soft plastics, will be diverted from landfill and transformed into new products, following a $4 million government and industry investment. Four new projects will build the capacity, capability, and resilience of Victoria’s resource recovery sector by increasing plastics recycling by 16,700 tonnes annually. These projects will boost jobs in the Victorian circular economy.(Source: wastemanagementreview.com)
Top Players In The Plastic Waste Management Market & Their Offerings:
- Veolia: A global leader in waste and resource management, Veolia provides end-to-end plastic recycling solutions, including collection, sorting, and advanced reprocessing for circular economy applications.
- SUEZ: Offers integrated plastic waste management services such as sorting, mechanical recycling, and energy recovery, with operations across the Asia Pacific, focusing on sustainable material reuse.
- Waste Management: Delivers comprehensive recycling and waste treatment services, including plastics recovery and reprocessing for packaging and industrial sectors.
- Republic Services: Provides collection, processing, and recycling of post-consumer and industrial plastics, emphasizing landfill diversion and resource recovery solutions
- Cleanaway: Specializes in plastic waste collection and recycling, offering tailored solutions for packaging, commercial, and industrial waste streams in Australia and New Zealand
Other Top Players Are
- Remondis
- Biffa
- Indorama Ventures
- LyondellBasell
- Eastman
- Tomra
- ALPLA
- Plastipak
- KW Plastics
- MBA Polymers
Segments Covered:
By Service Type
- Collection & Transportation
- Sorting & MRF Operations
- Mechanical Recycling
- Chemical Recycling (Advanced)
- Energy Recovery (WtE)
- Landfilling / Disposal
By Treatment Method
- Mechanical Recycling
- Chemical Recycling
- Energy Recovery (Incineration/WtE)
- Landfilling
By Polymer Type
- Polyethylene (PE)
- HDPE
- LDPE/LLDPE
- Polypropylene (PP)
- Polyethylene Terephthalate (PET)
- Polystyrene (PS)
- Polyvinyl Chloride (PVC)
- Others (ABS, PA, PC, etc.)
By Source
- Residential
- Commercial & Institutional
- Industrial
- Agriculture & Construction
By Sorting Technology
- Manual & Basic Mechanical
- Optical / NIR-Based Automated Sorting
- AI / Robotics-Enhanced Sorting
- Density & Electrostatic Separation
By End Use of Recovered Plastics
- Packaging & Bottles
- Textiles & Fibers
- Construction Products (Pipes, Lumber, Panels)
- Automotive & E&E
- Consumer Goods / Housewares
By Region
- North America
- U.S.
- Canada
- Europe
- Germany
- UK
- France
- Italy
- Spain
- Sweden
- Denmark
- Norway
- Asia Pacific
- China
- Japan
- India
- South Korea
- Thailand
- Latin America
- Brazil
- Mexico
- Argentina
- Middle East and Africa (MEA)
- South Africa
- UAE
- Saudi Arabia
- Kuwait
A Seven-Phase Framework
Our methodology is designed to be universally applicable across commodity chemicals, specialty chemicals, petrochemicals, construction chemicals, coatings, electronic chemicals, industrial gases, agrochemicals, water treatment chemicals, and performance materials. Each phase builds upon the last, creating a layered validation structure that minimizes estimation error and maximizes analytical confidence.
The framework ensures comprehensive market coverage, robust cross-validation, and reliable long-term forecasting — producing market estimates that withstand scrutiny from investors, regulators, and corporate strategy teams.

Seven-Phase Framework — Analytical Effort Distribution
Relative analytical effort allocated across each phase of the Chemicals & Materials research framework

Phase 1 - Secondary Research: Establishing the Foundation
Secondary research collects and evaluates publicly available information from authoritative sources, establishing the foundational understanding of market structure, value chain dynamics, competitive landscape, and end-use demand patterns. Every source is evaluated for credibility, recency, geographic relevance, and methodological soundness before inclusion.
Industry Associations
Sources include ACC, CEFIC, ICCA, JCIA, CPCIF, and SOCMA providing production volumes, consumption trends, capacity developments, and sustainability initiatives.
Company Disclosures
Annual reports, investor presentations, earnings transcripts, and regulatory filings reveal product portfolios, manufacturing footprints, capacity expansions, and revenue segmentation.
Government Databases
National statistical offices, customs authorities, environmental agencies, and industrial production databases provide verified statistics on output, trade flows, and regulatory compliance.
Trade Databases
UN Comtrade, ITC, Eurostat, and national customs authorities enable assessment of global product movement, import dependency, and export competitiveness across regions.
Our Secondary Research Sources
- Ministry of Chemicals and Fertilizers
- European Chemicals Agency
- United States Department of Energy
- Ministry of Industry and Information Technology
- Ministry of Economy Trade and Industry
- Ministry of Trade Industry and Energy
- National Institute of Standards and Technology
- Council of Scientific and Industrial Research
- Fraunhofer Society
- National Institute for Materials Science
Phase 2 — Supply-Side Assessment: Mapping Production Capabilities
Production Capacity Analysis
All major manufacturers are assessed for existing installed capacity, planned additions, expansions, new plant announcements, and technology adoption — mapped at global, regional, and country levels.
Capacity Utilization Adjustment
Installed capacity is adjusted using utilization rates based on demand conditions, feedstock availability, plant operating rates, maintenance schedules, and regulatory restrictions.
Manufacturer Revenue Analysis
Product-specific revenues, segment-level performance, regional distribution, average selling prices, and margin trends are evaluated to establish market value estimates.
Supply-Side Assessment — Capacity vs. Effective Production by Region
Illustrative comparison of installed capacity vs. effective production volume (after utilization rate adjustment) across major regions

Phase 3 — Demand-Side Assessment: Quantifying Chemical Consumption
Demand-side analysis quantifies chemical consumption across industries, applications, and geographies — identifying where and how chemicals are consumed throughout the value chain with precision.
End-Use Industry Analysis
Chemical demand is evaluated across automotive, construction, packaging, electronics, agriculture, healthcare, consumer goods, industrial manufacturing, energy and utilities, and water treatment. Industry output, production trends, and consumption intensity are analyzed to determine demand patterns.
Consumption Modeling
Demand is estimated using measurable indicators: kilograms per vehicle, kilograms per square meter of construction, dosage per cubic meter of water treated, kilograms per hectare of agricultural land, and kilograms per ton of manufactured products. Consumption factors are validated through industry publications and primary interviews.
Application Analysis
The market is segmented by application area to understand product performance requirements, formulation trends, technology adoption, customer preferences, and regulatory requirements improving demand accuracy and segmentation granularity.
Demand-Side Assessment — End-Use Industry Demand Distribution
Illustrative distribution of chemical & materials demand across key end-use industries

Phase 4 - Trade Flow Analysis: Balancing Regional Supply and Demand
Trade flow analysis reconciles regional supply and demand estimates through import and export data, identifying net supply positions, regional dependencies, and market imbalances. It serves as an independent validation layer that tests the consistency of supply-side and demand-side estimates.
Import Analysis
Import data is evaluated to determine volumes, source countries, product dependency, regional supply gaps, and pricing trends — identifying markets that rely heavily on external supply and where domestic production is insufficient to meet demand.
Export Analysis
Export assessments reveal production surplus, export competitiveness, regional manufacturing strength, and global market participation. Export patterns also help validate domestic production estimates and identify net exporting regions.
Apparent Consumption Model
Regional consumption is assessed using the standard apparent consumption formula:
Results identify net importing regions, net exporting regions, regional deficits, and surpluses — serving as an independent validation of supply and demand estimates.
Trade Flow Analysis — Net Supply Position by Region
Illustrative apparent consumption vs. domestic production across major regions — positive gap indicates net import dependency

Phase 5 — Primary Research: The Critical Validation Layer
Primary research tests and refines findings from secondary research through direct engagement with industry participants across the supply chain, demand side, and expert community. It captures intelligence that no database or published report can provide — the real-world experience of manufacturers, buyers, and specialists operating in the market.

Supply-Side Interviews
Conversations with chemical manufacturers, raw material suppliers, contract manufacturers, technology providers, and plant operators cover production trends, capacity utilization, pricing developments, technology shifts, and competitive dynamics.

Demand-Side Interviews
Engagement with OEMs, industrial consumers, procurement managers, distributors, formulators, and end-use manufacturers focuses on consumption trends, purchasing behavior, product substitution, demand outlook, and emerging applications.

Industry Expert Consultations
Additional interviews with industry consultants, independent experts, regulatory specialists, technical professionals, and research institutions provide deeper market context and validate key analytical assumptions.
Focus Areas of Primary Research:
Market Size & Forecast Validation
Revenue estimates, volume consumption, growth rates, forecast assumptions, regional demand.Supply Chain & Value Chain Assessment
Raw material sourcing, supply chain challenges, distribution networks, procurement practices.Production & Capacity Analysis
Manufacturing capacity, utilization rates, expansion projects, plant investments.Pricing & Cost Structure Analysis
Product pricing trends, feedstock costs, energy costs, margin pressures, pricing outlook.Competitive Landscape Assessment
Volume and value estimates confirmed to be fully consistent with one another before publicationInterview Volume by Market Scope
| Study Scope | Number of Interviews |
|---|---|
| Niche Market | 20 – 30 |
| Mid-Sized Market | 30 – 50 |
| Global Market | 50 – 80 |
| Highly Fragmented Market | 80 – 120 |
Interview Details:
Category : Manufacturers, Suppliers, Distributors, End Users, Experts/Associations
Average Duration : 30–60 Minutes
Interview Mode : Video calls, telephonic interviews, expert consultations
Interview Format : Structured / Semi-Structured questionnaire
Focus Areas of Primary Research:
Market Size & Forecast Validation :
Revenue estimates, volume consumption, growth rates, forecast assumptions, regional demand.
Supply Chain & Value Chain Assessment :
Raw material sourcing, supply chain challenges, distribution networks, procurement practices.
Production & Capacity Analysis :
Manufacturing capacity, utilization rates, expansion projects, plant investments.
Pricing & Cost Structure Analysis :
Product pricing trends, feedstock costs, energy costs, margin pressures, pricing outlook.
Competitive Landscape Assessment :
Market share, competitor positioning, strategic initiatives, partnerships, acquisitions.
Primary Research — Stakeholder Coverage by Category
Distribution of interview respondents across stakeholder categories (% share from PPT data)

Primary Research — Respondent Designation Profile
Seniority breakdown of interview respondents (% share from PPT data)

Primary Research — Geographic Coverage of Interviews
Regional distribution of primary research engagement (% share from PPT data)

Phase 6 — Data Triangulation and Market Validation
No single methodology is relied upon in isolation. Multiple independent estimation approaches are combined and reconciled to ensure consistency, accuracy, and analytical defensibility. Any material deviations between approaches are investigated and adjusted through additional validation cycles.
The final market size is derived through weighted triangulation of all validated methodologies. Any material deviations between approaches are investigated and adjusted through additional validation cycles. The outcome represents the most realistic assessment of the market based on available evidence and expert confirmation ensuring that volume and value estimates are fully consistent with one another.
Triangulation Framework — Input Contribution Weight
Relative weight each sizing input contributes to the final reconciled market estimate

Phase 7 — Forecast Modeling: Projecting Future Market Evolution
Forecasting evaluates the future trajectory of the market using a combination of quantitative indicators and qualitative assessments across economic, industry, and regulatory dimensions. Rather than simple extrapolation, each driver is independently modeled and integrated into a composite forecast.
Macroeconomic Indicators
GDP growth, industrial production, manufacturing output, construction activity, consumer spending, and capital investment form the quantitative foundation of long-term demand projections. These are applied at country, regional, and global levels.
Industry Growth Drivers
Urbanization, infrastructure development, industrialization, technological innovation, sustainability initiatives, and evolving product performance requirements are assessed at regional and industry levels — capturing both structural and cyclical demand drivers.
Capacity Expansion Analysis
Announced plant expansions, new manufacturing facilities, technology upgrades, and strategic investments are evaluated to determine future supply-demand dynamics and potential market tightness or oversupply situations.
Regulatory & Sustainability
Environmental regulations, chemical safety standards, emission reduction targets, circular economy initiatives, and sustainability requirements are incorporated as they often influence product adoption rates and market growth trajectories.
Scenario Forecast Range — Indexed Market Growth (Year 1–10)
Illustrative indexed growth trajectories across Base, Optimistic, and Pessimistic scenarios over a 10-year forecast horizon

Forecast Drivers — Relative Impact Score by Category
Impact score (0–100) of each driver type on chemicals & materials market forecast




Comments
Share your thoughts, ask a question, or provide feedback about this report.