
Asia Pacific Specialty Polymers Market Size, Competitive Landscape Analysis Report 2035
The Asia Pacific specialty polymers market size was valued at USD 38.61 billion in 2025, is estimated to reach USD 41.3 billion in 2026, and is projected to reach USD 75.61 billion by 2035, growing at a CAGR of 6.95% from 2026 to 2035 In terms of volume, the market is projected to grow from 8.98 million tons in 2025 to 22.92 million tons by 2035. growing at a CAGR of 9.82% from 2026 to 2035. Increasing consumer income and demand for consumer goods are the key factors driving market growth. Also, ongoing urbanization and infrastructure development in the region, coupled with the government initiatives promoting industrial growth, can fuel market growth further.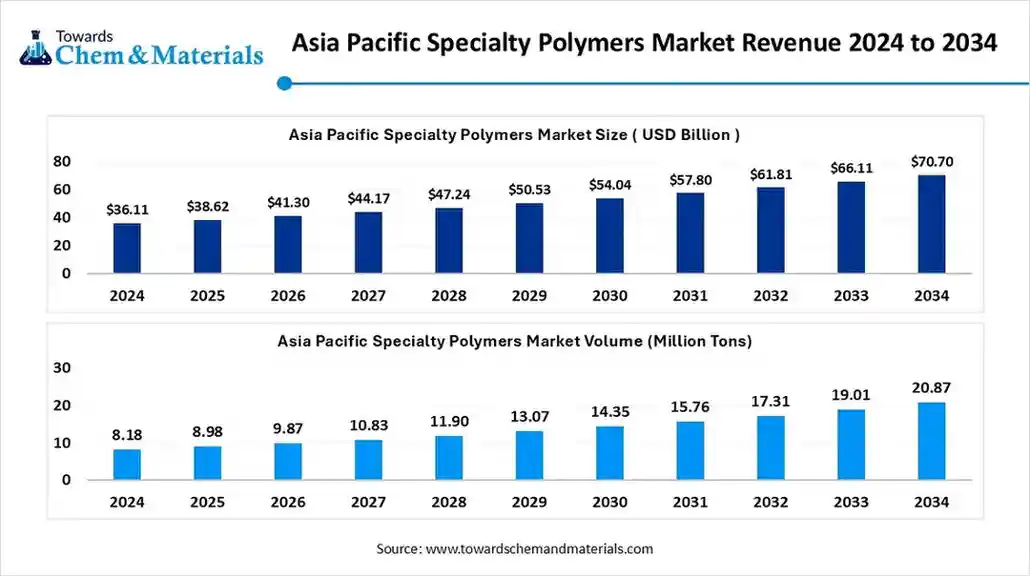 Key Takeaways
- By country, China dominated the market with a 54.25% share in 2025.
- By country, South Korea is expected to grow at a notable CAGR over the forecast period.
- By product type, the specialty thermoplastics segment dominated the market with a 37.54% share in 2025.
- By product type, the high-performance composites segment is expected to grow at the fastest CAGR of 8.06% over the forecast period.
- By form, the pellets/granules segment held a 48.32% market share in 2025.
- By form, the powders segment is expected to grow at the fastest CAGR of 8.15% over the forecast period.
- By application, the electrical & electronics segment dominated the market with 32.94% share in 2025.
- By application, the automotive segment is expected to grow at the fastest CAGR of 8.25% over the forecast period.
- By technology, the standard specialty grades segment held 42.78% market share in 2025.
- By technology, the biobased & biodegradable specialty polymers segment is expected to grow at the fastest CAGR of 8.45% during the projected period
Market Size and Volume Forecast
- Market Estimated Size (2025): USD 38.61 Billion | CAGR (2026–2035): 6.95%
- Market Projected Size (2035): USD 75.61 Billion
- Market Volume (2025): 8.98 Million Tons | Volume CAGR (2026–2035): 9.82%
- Market Projected Volume (2035): 22.92 Million Tons
- Market Pricing (2025):
- Average Manufacturing Price: USD 3,100 Mn
- Average Selling Price: USD 4,300 Mn
- Pricing CAGR (2025–2035): 2.82%
What are Specialty Polymers?
Innovations in high-performance materials are the major factor propelling market growth. The Asia Pacific specialty polymers market covers engineered polymer products designed for high-performance or application-specific uses e.g., specialty thermoplastics, elastomers, fluoropolymers, engineered composites, conductive and biopolymers, and polymeric additives.
The region leads global demand thanks to large automotive, electronics, and industrial manufacturing bases in China, India, Japan, and Korea. Growth is driven by lightweighting, electrification, electronics miniaturization, and sustainability (bio-based & recyclable specialty polymers). APAC held the largest regional share and is forecast to grow fastest among regions.
Case Study: BASF SE Achieved New Milestones with Strategic Collaborations
- BASF is a key player in the Asia Pacific specialty polymers market. Its presence is generally defined by a regional expansion, multi-pronged strategy, emphasis on advancement, and several acquisitions to fulfil the diverse and evolving demand of the region.
- In 2023, BASF lengthened its polymer distribution network in Merak, Indonesia, to meet increasing demand for acrylic dispersions and styrene-butadiene in Australia, Southeast Asia, and New Zealand.
Asia Pacific Specialty Polymers Market Outlook
- Industry Growth Overview: A rapid surge in the manufacturing of smart devices, consumer electronics, and the implementation of IoT is creating demand for lightweight, high-performance, and durable specialty polymers for components like connectors, screens, and circuit boards.
Sustainability Trends: Key sustainability trends in the market include a rapid surge in biodegradable and bio-based polymers, propelled by government mandates and environmental concerns. There is also a push towards sustainable solutions like bio-based surfactants and low-VOC adhesives, boosted by increasing consumer demand for sustainable products. - Major Investors: Major investors and companies in the market include BASF SE, Dow Inc., and Evonik Industries AG. These companies operate across the market, fuelled by robust demand from sectors such as electronics, automotive, and construction in rapidly urbanising countries like China, India, and Japan.
Report Scope
| Report Attributes | Details |
| Market Size and Volume in 2026 | USD 41.30 Billion / 9.86 Million Tons |
| Expected Size and Volume by 2035 | USD 75.61 Billion / 22.92 Million Tons |
| Growth Rate from 2025 to 2035 | CAGR 6.95% |
| Base Year of Estimation | 2025 |
| Forecast Period | 2025 - 2035 |
| Segment Covered | By Product Type, By Form, By Application, By Technology |
| Key Companies Profiled | Evonik Industries AG, Solvay SA , Covestro AG , Arkema S.A. , Celanese Corporation , Eastman Chemical Company, Mitsubishi Chemical / Mitsubishi Chemical Holdings , Toray Industries, Inc. , Kuraray Co., Ltd. , LG Chem / LG Energy Solution , Sumitomo Chemical , SABIC , Solvay |
Key Technological Shift in the Asia Pacific Specialty Polymers Market
The market is undergoing a substantial technological shift fuelled by several major factors, including the surge in innovative manufacturing techniques like 3D printing, an ongoing push toward sustainable materials, and the development of high-performance smart and functional polymers. These changes are occurring across major economies such as China, India, and Japan.
Trade Analysis of Asia Pacific Specialty Polymers Market: Import & Export Statistics:
- In 2024, China exported $2.77B of Propylene Polymers, being the 238th most exported product in China.
- In 2024, the main destinations of Chinas Propylene Polymers exports were: Indonesia ($206M), Vietnam ($441M), Thailand ($147M), Peru ($152M), and Brazil ($137M).(Source: oec.world)
- In April 2024, Indias plastic exports decreased by 4.3% to USD 907 million from USD 947 million in April 2023. For the full financial year of 2023-2024, Indias total plastics exports were USD 11.5 billion.(Source: plexconcil.org)
Asia Pacific Specialty Polymers Market Value Chain Analysis
- Feedstock Procurement : It is the first stage in the supply chain of the market, where companies acquire the required raw materials.
- Chemical Synthesis and Processing : It refers to the whole production lifecycle, from manufacturing the fundamental chemical building blocks to transforming them into a final specialty polymer product.
Packaging and Labelling : It is a key application segment where specialized polymers are utilized to create innovative packaging solutions. - Regulatory Compliance and Safety Monitoring :This stage involves adhering to an evolving and complex web of laws and standards focused on ensuring environmental protection, safety, and product quality.
Asia Pacific Specialty Polymers Market s Regulatory Landscape: Global Regulations
| Country/Region | Key Regulations/Investments |
| China | The country implemented a stricter Environmental Protection Law in 2022, increasing enforcement and penalties for violations. This has led to the shutdown of some chemical manufacturing capacity for inspections. |
| Japan | The Chemical Substance Control Law (CSCL), known as "Kashinho," is the main regulation for controlling new and existing chemical substances, including polymers. |
| India | Government initiatives such as "Make in India" and the Production-Linked Incentive (PLI) scheme are designed to boost local production and reduce import dependency. |
Segment Insights
Product Type Insights
How Much Share Did the Specialty Thermoplastics Segment Held in 2025?
The specialty thermoplastics segment dominated the market with a 37.54% share in 2025. The dominance of the segment can be attributed to the ongoing urbanisation and industrialization, which boost demand from the growing electronics, automobile, and construction sectors. Other driving factors include a surge in vehicle production and growing consumer income.
The high-performance composites segment is expected to grow at the fastest CAGR of 8.06% over the forecast period. The growth of the segment can be credited to the increasing demand for high-temperature, lightweight, and fatigue-resistant materials for military applications and aircraft. Also, innovations in production technologies enable faster creation of parts.
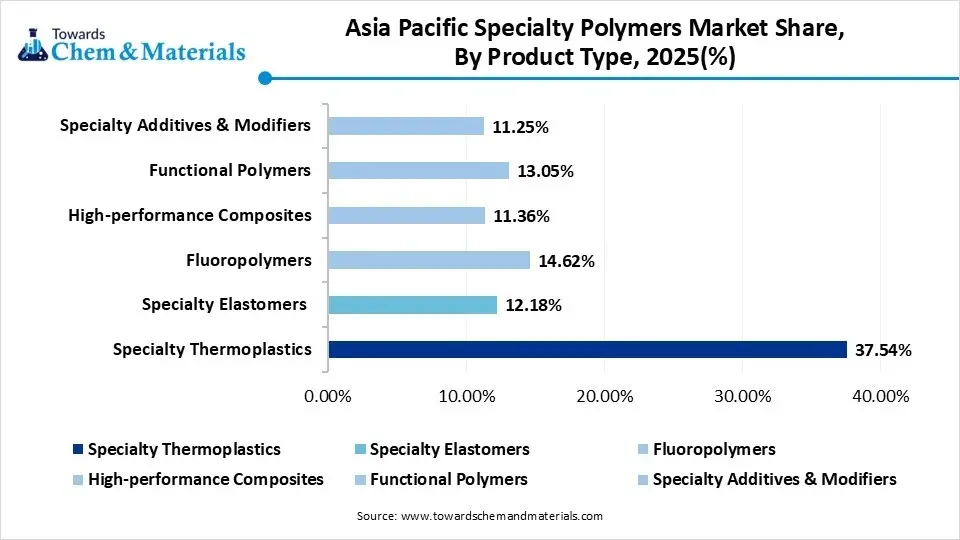
Fluoropolymers are one of the major sub-segments in the market, growing due to expanding electronics, automotive, and construction industries. Fluoropolymers are in huge demand for their unique features, such as high thermal stability and chemical resistance, which improve overall performance.
The growth of the specialty elastomers segment is fuelled by rapid industrialization and urbanization, which boosts demand in the construction and automotive sectors. The ongoing shift towards electric vehicles is creating lucrative demand for specialty elastomers.
Asia Pacific Specialty Polymers Market Share By Product Type, 2025(%)
| By Product Type | Revenue Share, 2025 (%) |
| Specialty Thermoplastics | 37.54% |
| Specialty Elastomers | 12.18% |
| Fluoropolymers | 14.62% |
| High-performance Composites | 11.36% |
| Functional Polymers | 13.05% |
| Specialty Additives & Modifiers | 11.25% |
Form Insights
Which Form Type Segment Dominated the Asia Pacific Specialty Polymers Market in 2025?
- The pellets/granules segment held a 48.32% market share in 2025. The dominance of the segment can be linked to the rising demand for high-performance materials and expanding manufacturing sectors. Countries such as China, India, and Vietnam are key manufacturing hubs for this form of polymer, driving segment growth further.
- The powders segment is expected to grow at the fastest CAGR of 8.15% over the forecast period. The growth of the segment can be driven by the increasing need for advanced materials in healthcare and the surge in vehicle production across the region. Also, Growth in both interior and exterior components increases the demand for the polymer powders used in their manufacturing.
- The films &sheets are another major segment in the market. Specialty films provide superior barrier properties against oxygen, moisture, and contaminants, extending the shelf life and preserving the freshness of food, beverages, and pharmaceuticals.
- The growth of the compounds & masterbatches segment is fuelled by expanding end-use industries, strong manufacturing sectors, and increased focus on sustainable and high-performance materials. Strong demand from developing economies such as China and India further accelerates segment expansion.
Asia Pacific Specialty Polymers Market Share By Form Insights 2025(%)
| By Form | Revenue Share, 2025 (%) |
| Pellets/granules | 48.32% |
| Films & Sheets | 16.74% |
| Powders | 10.21% |
| Compounds & Masterbatches | 15.08% |
| Prepregs / Composite forms | 9.65% |
Application Insights
Which Application Type Segment Dominated the Asia Pacific Specialty Polymers Market in 2025?
- The electrical & electronics segment dominated the market with a 32.94% share in 2025. The dominance of the segment is owed to the increasing need for consumer electronics and the rise in the number of electric and hybrid vehicles. Also, specialty polymers are crucial for manufacturing lightweight components.
- The automotive segment is expected to grow at the fastest CAGR of 8.25% over the forecast period. The growth of the segment is due to a rise in vehicle production, especially electric and commercial vehicles, coupled with the increasing need for cutting-edge materials in EV batteries and electronics.
- The expansion of the healthcare & medical segment is driven by the growing need for advanced medical devices due to the ongoing prevalence of chronic diseases and an aging population. Advancements in the medical sector are creating specialized materials for applications like drug delivery systems and diagnostic equipment.
- The growth of the packaging & consumer goods segment is fuelled by raised emphasis on sustainable solutions, increasing consumer demand, and rapid economic growth in the region. The ongoing expansion of e-commerce platforms in the region is a major driver for the packaging industry.
Asia Pacific Specialty Polymers Market Share By Application, 2025(%)
| By Application | Revenue Share, 2025 (%) |
| Automotive | 18.76% |
| Electrical & Electronics | 32.94% |
| Industrial & Machinery | 13.42% |
| Healthcare & Medical | 9.38% |
| Packaging & Consumer Goods | 15.27% |
| Energy & Infrastructure | 10.23% |
Technology Insights
How Much Share Did the Standard Specialty Grades Segment Held in 2025?
- The standard specialty grades segment held 42.78% market share in 2025. The dominance of the segment can be attributed to the rapid investments in circular economy solutions, such as recyclable specialty polymer grades. The combination of an extensive range of applications creates continuous demand for standard specialty grades.
- The biobased & biodegradable specialty polymers segment is expected to grow at the fastest CAGR of 8.45% during the projected period. The growth of the segment can be credited to the growing need for sustainable materials across various sectors such as textiles, packaging, and automotive, coupled with the rise in environmental awareness and pressure to minimize carbon emissions.
- The growth of the flame-retardant segment is boosted by stringent fire safety regulations, growing demand for sustainable products, and rapid expansion of key end-use industries such as electronics and construction. Furthermore, flame retardants applied to textiles can be used in industrial settings, home furnishings, and defense applications.
- The expansion of the conductive segment is being propelled by rising adoption of electric vehicles (EVs) and increasing demand for high-performance and lightweight materials. Moreover, conductive polymers are utilized in a wide range of automotive applications, such as actuators, sensors, and advanced display systems in vehicles.
Asia Pacific Specialty Polymers Market Share By Technology, 2025(%)
| By Technology | Revenue Share, 2025 (%) |
| Standard specialty grades | 42.78% |
| Flame-retardant / high-heat polymers | 14.36% |
| Conductive / antistatic polymers | 11.24% |
| Biobased & biodegradable specialty polymers | 9.18% |
| Polymer blends & engineered compounds | 22.44% |
Country Insights
How did China Thrived in the Asia Pacific Specialty Polymers Market in 2025?
China dominated the market with a 54.25% share in 2025. The dominance of the country can be attributed to the growing electronics and automotive industries, along with the government support for electric vehicles. Moreover, robust economic growth in the country and a rise in disposable incomes lead to a surge in consumer spending on goods that depend on specialty polymers, such as electronics and vehicles.
Which is the Fastest Growing Country in the Region?
India is expected to grow at the fastest CAGR of 9.04% over the forecast period. The growth of the country can be credited to the growing commercial vehicle production and rapid infrastructure development in the major metropolitan cities such as Delhi, Mumbai, and Pune. Furthermore, industries are increasingly needing materials with special properties such as high durability, strength, and thermal stability, which will impact positive market growth in the country soon.
South Korea is expected to grow at a notable CAGR over the forecast period. The growth of the country can be driven by increasing emphasis on innovation and sustainability, along with the countrys cutting-edge automotive and electronics sectors. Also, high-performance polymers are widely used in more advanced display technologies, which is a major factor positively impacting the countrys growth.
Recent Developments
- In May 2025, DKSH acquires APN Plastics, a distributor of specialty polymers to propel the market of Asia-Pacific specialty polymers. With this strategic acquisition, DKSH demonstrates its goal to expand its presence in the Asia-Pacific region by strengthening its capacity.(Source: www.alchempro.com)
- In July 2025, Lubrizol unveils its new cutting-edge facility in Jurong, Singapore, which will improve collaboration and fit-for-market for consumers in Southeast Asia. It is a home to product developers who use local R&D and testing capabilities.(Source: www.inkworldmagazine.com)
Top Asia Pacific Specialty Polymers Market Companies
BASF SE
Corporate Information
- Name: BASF SE (Societas Europaea)
- Headquarters: Ludwigshafen am Rhein, Germany.
- Business: Global chemical company covering a wide portfolio including chemicals, plastics, performance products, catalysts, coatings, and more.
History and Background
- Founded originally in 1865 as Badische Anilin und Soda Fabrik (BASF) in Mannheim, Germany.
- Moved operations across the Rhine to Ludwigshafen due to space/pollution concerns in Mannheim.
- Over the decades, BASF evolved from dyes and basic chemicals into a diversified global chemical enterprise covering materials, performance products, industrial solutions, agriculture, etc.
Key Developments and Strategic Initiatives
- Sustainability & Green Transformation: BASF’s “performance materials” division switched all European plants to 100 % renewable electricity as of 2025.
- Innovation Commercialisation: Approximately €11 billion in revenue from new products in 2024 stemming from R&D.
- Portfolio Management (“Winning Ways” strategy): BASF is actively reviewing and divesting non core businesses while focusing investment on future fields (sustainable materials, battery materials, catalysis etc.). For example, the planned transaction of its coatings business.
Mergers & Acquisitions
- Historic acquisitions include e.g., the takeover of polyamide business from Solvay SA (among others) to bolster engineering plastics business in Asia.
- Divestments: Recently BASF sold its Brazilian coatings unit for about US $1.15 billion.
Partnerships & Collaborations
- BASF has partnered with organizations and companies on circular economy, recycled feedstock, sustainability: e.g., partnership with Ambipar Environment in Brazil to recycle polyethylene (target 60,000 tons/year by 2030).
- Collaborations in semiconductor chemicals: for example, investment in a new semiconductor grade sulfuric acid plant (Ludwigshafen) to serve chip manufacturing growth.
Product Launches / Innovations
- In 2024, over 1,159 patent applications filed by BASF; about 45 % of new patents were sustainability related.
- New R&D facility / capacity expansions: e.g., the new Catalyst Development & Solids Processing Center in Ludwigshafen (Dec 2024) to scale lab catalysts for production.
- Expansion of cosmetic ingredients capacity: New plant in Düsseldorf for emollients for skin care and sun protection (start Q3 2025).
Key Technology Focus Areas
- Sustainability / Circular Economy: Recycling, use of renewable electricity, sustainable materials (e.g., biodegradable, recycled feedstock) are core.
- Advanced Materials / Specialty Polymers: Engineering plastics, thermoplastic polyurethanes, specialty polymers form a core segment; the switch to renewable energy for those plants underscores their importance.
- Catalysis & Process Technology: The new catalyst development centre, high purity chemicals for semiconductor manufacturing are key tech areas.
R&D Organisation & Investment
- R&D Spend: ~€2.06 billion in 2024.
- Employees: ~10,000 globally in R&D in 2024.
- Output: 1,159 patent applications in 2024.
- Innovation Revenue: Products launched in last five years contributed ~€11 billion in sales in 2024.
SWOT Analysis
Strengths:
- Global scale and breadth of chemical business one of the largest chemical companies globally.
- Broad technology/portfolio depth (from basic chemicals to specialty materials) enabling vertical integration.
- Strong innovation capabilities and ability to commercialise new products, with significant R&D investment and innovation revenue.
- Committed to sustainability and transforming plants/processes (renewable electricity, circular economy).
- Strong presence in growth markets (Asia Pacific) and strong R&D footprint globally.
Weaknesses:
- Large scale and legacy operations may limit agility compared with smaller specialist players.
- Exposure to energy and raw material cost volatility (chemicals are energy/material intensive).
- Some legacy segments may be under pressure or facing lower margins; restructuring/divestments may impose transitional costs.
- Competitive pressures across many segments (specialty polymers, performance materials etc.) from multiple global players.
Opportunities:
- Growth in high performance specialty polymers, sustainable materials, circular economy solutions, battery materials, semiconductor chemicals.
- Rising demand in Asia Pacific for specialty polymers and high end materials offers strong regional growth potential.
- Enhancement of value chain services (digitalisation, customer specific solutions) and collaborations/partnerships in new sectors.
- Divesting non core segments to free up capital for growth fields.
- Leveraging sustainability credentials to gain competitive advantage, especially as customers increasingly demand greener solutions.
Threats:
- Global economic uncertainties (e.g., energy cost spikes, supply chain disruptions, geopolitical tensions) impacting chemical industry.
- Regulatory and environmental pressures (emissions, waste, chemical regulations) which may increase cost burdens.
- Intense competition in specialty materials and polymers from major peers and regional players.
- Rapid technological change could make certain materials/processes obsolete.
- Potential risks in restructuring/divestment execution risk, possible impairment charges, market/valuation uncertainties.
Recent News & Strategic Updates
- In October 2025, BASF and Carlyle reached a binding transaction agreement for BASF’s coatings business (automotive OEM coatings, refinish coatings, surface treatment) with enterprise value ~€7.7 billion; BASF will retain an equity stake and deal expected to close Q2 2026 (subject to approvals).
- In April 2025, BASF announced investment in a new semiconductor grade sulfuric acid plant at Ludwigshafen to serve advanced chip manufacturing demand; operations expected by 2027.
- Evonik Industries AG: Expanding specialty polymer production in China and Singapore, Focus on high-performance, sustainable materials, Strong Asia-Pacific growth contributor.
- Dow Inc.: It has a significant presence in the Asia Pacific specialty polymers market, which is the largest and fastest-growing regional market globally, driven by rapid industrialization and electronics manufacturing.
Other Companies in the Market
- Evonik Industries AG
- Solvay SA
- Covestro AG
- Arkema S.A.
- Celanese Corporation
- Eastman Chemical Company
- Mitsubishi Chemical / Mitsubishi Chemical Holdings
- Toray Industries, Inc.
- Kuraray Co., Ltd.
- LG Chem / LG Energy Solution
- Sumitomo Chemical
- SABIC
- Solvay
Segments Covered in the Report
By Product Type
- Specialty Thermoplastics (PA, PEEK, PPS, PSU, PSU, LCP)
- Specialty Elastomers (TPU, TPE, silicone)
- Fluoropolymers (PTFE, PVDF)
- High-performance Composites (carbon-fibre reinforced polymers, thermoplastic composites)
- Functional Polymers (conductive polymers, ionomers, MOFs-polymer hybrids)
- Specialty Additives & Modifiers (flame retardants, impact modifiers, stabilizers)
By Form
- Pellets / Granules
- Films & Sheets
- Powders
- Compounds & Masterbatches
- Prepregs / Composite forms
By Application
- Automotive (lightweighting, under-hood, EV components)
- Electrical & Electronics (connectors, housings, encapsulants)
- Industrial & Machinery (seals, gears, wear parts)
- Healthcare & Medical (implants, devices, biocompatible polymers)
- Packaging & Consumer Goods (barrier films, specialty flexible packaging)
- Energy & Infrastructure (renewables, piping, membranes)
By Technology
- Standard specialty grades (enhanced mechanical/thermal properties)
- Flame-retardant / high-heat polymers
- Conductive / antistatic polymers
- Biobased & biodegradable specialty polymers
- Polymer blends & engineered compounds
A Seven-Phase Framework
Our methodology is designed to be universally applicable across commodity chemicals, specialty chemicals, petrochemicals, construction chemicals, coatings, electronic chemicals, industrial gases, agrochemicals, water treatment chemicals, and performance materials. Each phase builds upon the last, creating a layered validation structure that minimizes estimation error and maximizes analytical confidence.
The framework ensures comprehensive market coverage, robust cross-validation, and reliable long-term forecasting — producing market estimates that withstand scrutiny from investors, regulators, and corporate strategy teams.

Seven-Phase Framework — Analytical Effort Distribution
Relative analytical effort allocated across each phase of the Chemicals & Materials research framework

Phase 1 - Secondary Research: Establishing the Foundation
Secondary research collects and evaluates publicly available information from authoritative sources, establishing the foundational understanding of market structure, value chain dynamics, competitive landscape, and end-use demand patterns. Every source is evaluated for credibility, recency, geographic relevance, and methodological soundness before inclusion.
Industry Associations
Sources include ACC, CEFIC, ICCA, JCIA, CPCIF, and SOCMA providing production volumes, consumption trends, capacity developments, and sustainability initiatives.
Company Disclosures
Annual reports, investor presentations, earnings transcripts, and regulatory filings reveal product portfolios, manufacturing footprints, capacity expansions, and revenue segmentation.
Government Databases
National statistical offices, customs authorities, environmental agencies, and industrial production databases provide verified statistics on output, trade flows, and regulatory compliance.
Trade Databases
UN Comtrade, ITC, Eurostat, and national customs authorities enable assessment of global product movement, import dependency, and export competitiveness across regions.
Our Secondary Research Sources
- Ministry of Chemicals and Fertilizers
- European Chemicals Agency
- United States Department of Energy
- Ministry of Industry and Information Technology
- Ministry of Economy Trade and Industry
- Ministry of Trade Industry and Energy
- National Institute of Standards and Technology
- Council of Scientific and Industrial Research
- Fraunhofer Society
- National Institute for Materials Science
Phase 2 — Supply-Side Assessment: Mapping Production Capabilities
Production Capacity Analysis
All major manufacturers are assessed for existing installed capacity, planned additions, expansions, new plant announcements, and technology adoption — mapped at global, regional, and country levels.
Capacity Utilization Adjustment
Installed capacity is adjusted using utilization rates based on demand conditions, feedstock availability, plant operating rates, maintenance schedules, and regulatory restrictions.
Manufacturer Revenue Analysis
Product-specific revenues, segment-level performance, regional distribution, average selling prices, and margin trends are evaluated to establish market value estimates.
Supply-Side Assessment — Capacity vs. Effective Production by Region
Illustrative comparison of installed capacity vs. effective production volume (after utilization rate adjustment) across major regions

Phase 3 — Demand-Side Assessment: Quantifying Chemical Consumption
Demand-side analysis quantifies chemical consumption across industries, applications, and geographies — identifying where and how chemicals are consumed throughout the value chain with precision.
End-Use Industry Analysis
Chemical demand is evaluated across automotive, construction, packaging, electronics, agriculture, healthcare, consumer goods, industrial manufacturing, energy and utilities, and water treatment. Industry output, production trends, and consumption intensity are analyzed to determine demand patterns.
Consumption Modeling
Demand is estimated using measurable indicators: kilograms per vehicle, kilograms per square meter of construction, dosage per cubic meter of water treated, kilograms per hectare of agricultural land, and kilograms per ton of manufactured products. Consumption factors are validated through industry publications and primary interviews.
Application Analysis
The market is segmented by application area to understand product performance requirements, formulation trends, technology adoption, customer preferences, and regulatory requirements improving demand accuracy and segmentation granularity.
Demand-Side Assessment — End-Use Industry Demand Distribution
Illustrative distribution of chemical & materials demand across key end-use industries

Phase 4 - Trade Flow Analysis: Balancing Regional Supply and Demand
Trade flow analysis reconciles regional supply and demand estimates through import and export data, identifying net supply positions, regional dependencies, and market imbalances. It serves as an independent validation layer that tests the consistency of supply-side and demand-side estimates.
Import Analysis
Import data is evaluated to determine volumes, source countries, product dependency, regional supply gaps, and pricing trends — identifying markets that rely heavily on external supply and where domestic production is insufficient to meet demand.
Export Analysis
Export assessments reveal production surplus, export competitiveness, regional manufacturing strength, and global market participation. Export patterns also help validate domestic production estimates and identify net exporting regions.
Apparent Consumption Model
Regional consumption is assessed using the standard apparent consumption formula:
Results identify net importing regions, net exporting regions, regional deficits, and surpluses — serving as an independent validation of supply and demand estimates.
Trade Flow Analysis — Net Supply Position by Region
Illustrative apparent consumption vs. domestic production across major regions — positive gap indicates net import dependency

Phase 5 — Primary Research: The Critical Validation Layer
Primary research tests and refines findings from secondary research through direct engagement with industry participants across the supply chain, demand side, and expert community. It captures intelligence that no database or published report can provide — the real-world experience of manufacturers, buyers, and specialists operating in the market.

Supply-Side Interviews
Conversations with chemical manufacturers, raw material suppliers, contract manufacturers, technology providers, and plant operators cover production trends, capacity utilization, pricing developments, technology shifts, and competitive dynamics.

Demand-Side Interviews
Engagement with OEMs, industrial consumers, procurement managers, distributors, formulators, and end-use manufacturers focuses on consumption trends, purchasing behavior, product substitution, demand outlook, and emerging applications.

Industry Expert Consultations
Additional interviews with industry consultants, independent experts, regulatory specialists, technical professionals, and research institutions provide deeper market context and validate key analytical assumptions.
Focus Areas of Primary Research:
Market Size & Forecast Validation
Revenue estimates, volume consumption, growth rates, forecast assumptions, regional demand.Supply Chain & Value Chain Assessment
Raw material sourcing, supply chain challenges, distribution networks, procurement practices.Production & Capacity Analysis
Manufacturing capacity, utilization rates, expansion projects, plant investments.Pricing & Cost Structure Analysis
Product pricing trends, feedstock costs, energy costs, margin pressures, pricing outlook.Competitive Landscape Assessment
Volume and value estimates confirmed to be fully consistent with one another before publicationInterview Volume by Market Scope
| Study Scope | Number of Interviews |
|---|---|
| Niche Market | 20 – 30 |
| Mid-Sized Market | 30 – 50 |
| Global Market | 50 – 80 |
| Highly Fragmented Market | 80 – 120 |
Interview Details:
Category : Manufacturers, Suppliers, Distributors, End Users, Experts/Associations
Average Duration : 30–60 Minutes
Interview Mode : Video calls, telephonic interviews, expert consultations
Interview Format : Structured / Semi-Structured questionnaire
Focus Areas of Primary Research:
Market Size & Forecast Validation :
Revenue estimates, volume consumption, growth rates, forecast assumptions, regional demand.
Supply Chain & Value Chain Assessment :
Raw material sourcing, supply chain challenges, distribution networks, procurement practices.
Production & Capacity Analysis :
Manufacturing capacity, utilization rates, expansion projects, plant investments.
Pricing & Cost Structure Analysis :
Product pricing trends, feedstock costs, energy costs, margin pressures, pricing outlook.
Competitive Landscape Assessment :
Market share, competitor positioning, strategic initiatives, partnerships, acquisitions.
Primary Research — Stakeholder Coverage by Category
Distribution of interview respondents across stakeholder categories (% share from PPT data)

Primary Research — Respondent Designation Profile
Seniority breakdown of interview respondents (% share from PPT data)

Primary Research — Geographic Coverage of Interviews
Regional distribution of primary research engagement (% share from PPT data)

Phase 6 — Data Triangulation and Market Validation
No single methodology is relied upon in isolation. Multiple independent estimation approaches are combined and reconciled to ensure consistency, accuracy, and analytical defensibility. Any material deviations between approaches are investigated and adjusted through additional validation cycles.
The final market size is derived through weighted triangulation of all validated methodologies. Any material deviations between approaches are investigated and adjusted through additional validation cycles. The outcome represents the most realistic assessment of the market based on available evidence and expert confirmation ensuring that volume and value estimates are fully consistent with one another.
Triangulation Framework — Input Contribution Weight
Relative weight each sizing input contributes to the final reconciled market estimate

Phase 7 — Forecast Modeling: Projecting Future Market Evolution
Forecasting evaluates the future trajectory of the market using a combination of quantitative indicators and qualitative assessments across economic, industry, and regulatory dimensions. Rather than simple extrapolation, each driver is independently modeled and integrated into a composite forecast.
Macroeconomic Indicators
GDP growth, industrial production, manufacturing output, construction activity, consumer spending, and capital investment form the quantitative foundation of long-term demand projections. These are applied at country, regional, and global levels.
Industry Growth Drivers
Urbanization, infrastructure development, industrialization, technological innovation, sustainability initiatives, and evolving product performance requirements are assessed at regional and industry levels — capturing both structural and cyclical demand drivers.
Capacity Expansion Analysis
Announced plant expansions, new manufacturing facilities, technology upgrades, and strategic investments are evaluated to determine future supply-demand dynamics and potential market tightness or oversupply situations.
Regulatory & Sustainability
Environmental regulations, chemical safety standards, emission reduction targets, circular economy initiatives, and sustainability requirements are incorporated as they often influence product adoption rates and market growth trajectories.
Scenario Forecast Range — Indexed Market Growth (Year 1–10)
Illustrative indexed growth trajectories across Base, Optimistic, and Pessimistic scenarios over a 10-year forecast horizon

Forecast Drivers — Relative Impact Score by Category
Impact score (0–100) of each driver type on chemicals & materials market forecast




Comments
Share your thoughts, ask a question, or provide feedback about this report.