
Nanocellulose Market Size, Competitive Landscape Analysis Report 2035
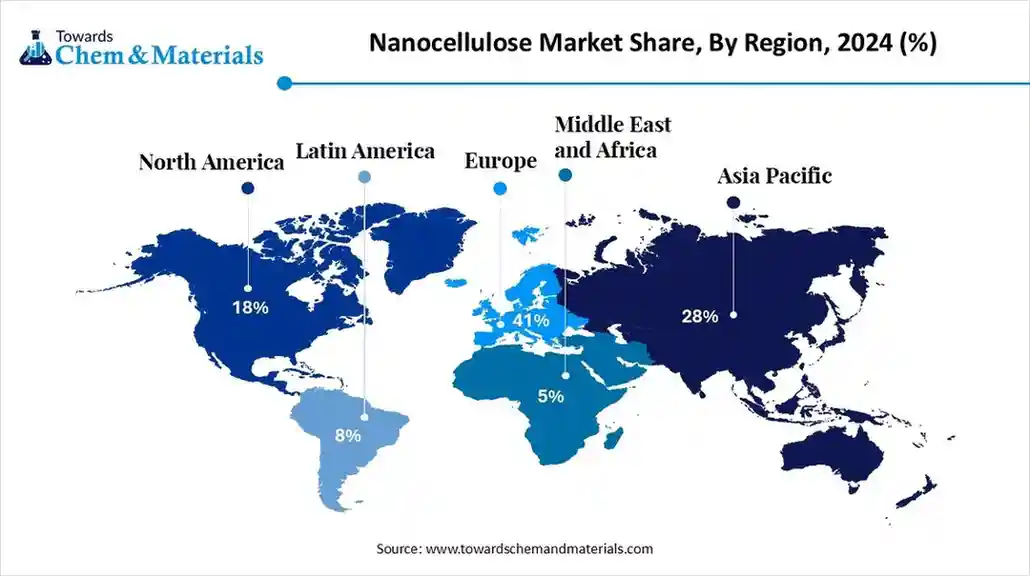
The global nanocellulose market size is calculated at USD 766.09 million in 2025 and is predicted to increase from USD 947.96 million in 2026 and is projected to reach around USD 6,447.32 million by 2035, The market is expanding at a CAGR of 23.74% between 2025 and 2035. Europe dominated the nanocellulose market with a market share of 41% the global market in 2024. The growing demand for lightweight packaging and the development of advanced drug delivery systems drive the market growth.
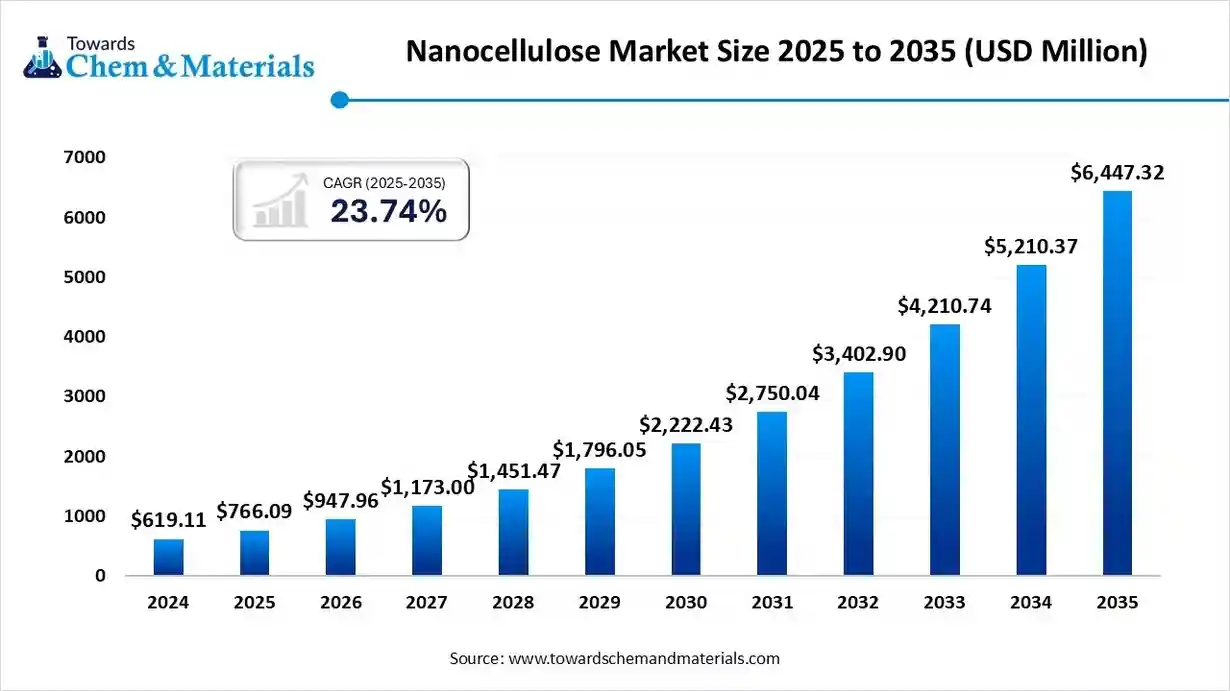
Key Takeaways
- By region, Europe held a 41% share of the market in 2024.
- By region, Asia Pacific is growing at the fastest CAGR in the market during the forecast period.
- By product type, the cellulose nanofibrils segment held a 46% share in the market in 2024.
- By product type, the bacterial nanocellulose segment is expected to grow at the fastest CAGR in the market during the forecast period.
- By raw material source, the wood-based pulp segment held a 52% share in the market in 2024.
- By raw material source, the non-wood biomass segment is expected to grow at the fastest CAGR in the market during the forecast period.
- By processing technology, the mechanical fibrillation segment held a 48% share in the market in 2024.
- By processing technology, the chemical & enzymatic pretreatment segment is expected to grow at the fastest CAGR in the market during the forecast period.
- By end-use industry, the packaging segment held a 38% share in the nanocellulose market in 2024.
- By end-use industry, the healthcare & life sciences segment is expected to grow at the fastest CAGR in the market during the forecast period.
- By form, the wet form segment held a 61% share in the market in 2024.
- By form, the dry form segment is expected to grow at the fastest CAGR in the market during the forecast period.
What are the Key Growth Drivers of the Nanocellulose Market?
The nanocellulose market growth is driven by the strong focus on sustainability, increasing use of sustainable packaging & pulp products, development of lightweight automotive materials, and growing awareness about eco-friendly products.
What is Nanocellulose?
- Nanocellulose is a material made up of natural fibers that has at least one dimension in the nanometric size.
- Nanocellulose is lightweight, biocompatible, biodegradable, and has a high surface area. It has excellent tensile strength and possesses good thermal stability. Nanocellulose is used in wound dressing, packaging, conductive materials, drug delivery, tissue engineering, and cosmetics.
Nanocellulose Market Outlook:
- Industry Growth Overview: Between 2025 and 2034, the industry is expanding in high-margin niches such as packaging materials, biomedical, automotive components, and pharmaceuticals. Growth is being reinforced by growing demand for sustainable products, particularly in Europe, Asia-Pacific, and North America.
- Sustainability Trends: Sustainability is transforming the nanocellulose industry, with rising demand for plastic alternatives and growing integration of nanocellulose across industries like biomedical, electronics, automotive, and construction. For instance, the Borregaard company uses natural biomass to manufacture advanced bioethanol, biochemicals, and biomaterials.
- Global Expansion: Leading players and acquiring companies are expanding geographically due to growing demand for eco-friendly products in regions like the Asia Pacific, Europe, and North America. Companies like Nippon Paper Industries, Wilh. Werhahn Kg, Borregaard AS, and Stora Enso develop sustainable products.
Report Scope
| Report Attributes | Details |
| Market Size in 2026 | USD 947.96 Million |
| Expected Size by 2035 | USD 6,447.32 Million |
| Growth Rate from 2025 to 2035 | CAGR 23.74% |
| Base Year of Estimation | 2024 |
| Forecast Period | 2025 - 2035 |
| Leading Region | Europe |
| Fastest Growing Region | Asia Pacific |
| Segment Covered | By Product Type, By Raw Material Source, By Processing Technology, By End-Use Industry, By Form, By Region |
| Key Companies Profiled | Stora Enso Oyj, UPM-Kymmene Corporation, Nippon Paper Industries Co., Ltd., Sappi Limited., Borregaard ASA, FiberLean Technologies Ltd., American Process Inc., RISE Innventia AB, Kruger Inc., GranBio Technologies, Melodea Ltd., Oji Holdings Corporation, Norske Skog ASA, CelluComp Ltd. |
Key Technological Shifts in the Nanocellulose Market:
The nanocellulose market is undergoing key technological shifts driven by the demand for performance efficiency, customization, and accelerating R&D. One of the most significant transformations is the integration of artificial intelligence (AI), which optimizes production processes and predicts material properties.
- AI optimizes production parameters like temperature, acid concentration, and reaction time. AI easily predicts complex mechanical & physical properties of nanocellulose. AI helps in sustainable manufacturing and detects defects of nanocellulose in real-time.
- For instance, Shiru collaborated with CP Kelco to use AI for the development of biopolymer and nanocellulose materials.
Nanocellulose Market Value Chain Analysis
- Feedstock Procurement :The feedstock procurement is the sourcing of raw materials like agricultural waste, algae, fungi, wood pulp, tunicates, and bacterial cellulose.
- Key Players: CelluForce, Oji Holdings Corporation, Stora Enso, Nippon Paper Industries, UPM Biomedicals
- Chemical Synthesis and Processing :The chemical synthesis and processing involve methods like pretreatment, TEMPO oxidation, ionic liquid treatment, acid hydrolysis, graft copolymerization, and ammonium persulfate oxidation.
- Key Players: Borregaard, CelluForce, Melodea, Nippon Paper Industries
- Quality Testing and Certifications :The quality testing involves analysis of properties like purity, size, chemical composition, crystallinity, shape, & thermal stability, and certifications like REACH, BIS, ISO, & EPA.
Meet the Family: Unravelling the Types of Nanocellulose
| Types | Source | Production Process | Characteristics | Applications |
| Cellulose Nanocrystals |
|
Acid Hydrolysis |
|
|
| Nanofibrils |
|
Mechanical Defibrillation |
|
|
| Bacterial Nanocellulose | Bacterial Species | Microbial Fermentation |
|
|
Segmental Insights
Product Type Insights
Why the Cellulose Nanofibrils Segment Dominates the Nanocellulose Market?
- The cellulose nanofibrils segment dominated the market with a 46% share in 2024. The growing manufacturing of bio-composites and increasing textile production require cellulose nanofibrils. They offer a high surface area and provide excellent mechanical properties. The development of construction materials and the expansion of the packaging industry require cellulose nanofibrils, driving the overall market growth.
- The bacterial nanocellulose segment is the fastest-growing in the market during the forecast period. The growing expansion of biomedical applications like vascular implants, wound dressings, dental implants, and tissue replacement increases demand for bacterial nanocellulose.
- The increasing need for food packaging, edible gels, and coatings requires bacterial nanocellulose. They offer high purity and excellent biocompatibility. The growing production of durable textiles and the adoption of electronic devices require bacterial nanocellulose, supporting the overall market growth.
- The cellulose nanocrystals segment is significantly growing in the market. The growing demand for additives in food products like frozen dough and ice cream increases demand for cellulose nanocrystals. The increasing demand for pure water and the development of water treatment applications require cellulose nanocrystals for manufacturing membranes. The high tensile strength and versatility for modifications drive the overall market growth.
Raw Material Source Insights
How did the Wood-Based Pulp Segment hold the Largest Share in the Nanocellulose Market?
- The wood-based pulp segment held the largest revenue share of 52% in the market in 2024. The growing expansion of the pulp and paper industry increases demand for wood-based pulp.
- The high availability of wood-based pulp and cost-effectiveness help the market growth. The growing manufacturing of paper products, reinforcing composites, and barrier coatings requires wood-based pulp, driving the overall market growth.
- The non-wood biomass segment is experiencing the fastest growth in the market during the forecast period.
- The growing availability of agricultural residues like rice hulls, corn stalks, and wheat straw helps market growth.
- The growing depletion of wood resources and the government's sustainability goals require non-wood biomass.
- The growing industries like biofuels, construction, composites, and papermaking require non-wood biomass, supporting the overall market growth.
- The microbial or bacterial sources segment is growing at a significant rate in the market. The growing manufacturing of agricultural products like biopesticides and biofertilizers increases demand for microbial or bacterial sources. The increasing expansion of healthcare applications like therapeutic proteins, antibiotics, and vaccines requires microbial or bacterial sources, driving the overall market growth.
Processing Technology Insights
Why the Mechanical Fibrillation Segment is Dominating the Nanocellulose Market?
- The mechanical fibrillation segment dominated the nanocellulose market with a 48% share in 2024. The growing commercial production and well-developed industrial processes increase the adoption of mechanical fibrillation. The increased manufacturing of rheology modifiers, composites, and paper & pulp increases the adoption of mechanical fibrillation. The growing availability of agricultural wastes and wood pulp requires mechanical fibrillation, driving the overall market growth.
- The chemical & enzymatic pretreatment segment is the fastest-growing in the market during the forecast period. The growing adoption of green technologies and focus on lowering harmful emissions increases the adoption of chemical & enzymatic pretreatment. The growing customization of nanocellulose and the cost-effectiveness of chemical pretreatment help the market growth. The integration with other processing technology and development of healthcare applications requires chemical & enzymatic pretreatment, supporting the overall market growth.
- The electrospinning & freeze-drying segment is significantly growing in the market. The strong focus on preserving nanostructures of nanocellulose and the development of highly porous materials requires freeze-drying technology. The expansion of biomedical applications like drug delivery systems, tissue engineering, and wound dressings increases the adoption of electrospinning technology, driving the overall market growth.
End-Use Industry Insights
Which End-Use Industry Held the Largest Share in the Nanocellulose Market?
- The packaging segment held the largest revenue share of 38% in the nanocellulose market in 2024. The rise in online shopping and the growing expansion of the packaging industry increase demand for nanocellulose. The increasing use of plastic-based packaging and traditional paper packaging requires nanocellulose. The increased consumption of packaged food & beverages requires nanocellulose, driving the overall market growth.
- The healthcare & life sciences segment is experiencing the fastest growth in the market during the forecast period. The growing development of tissue engineering and the creation of advanced drug delivery systems require nanocellulose. The growing manufacturing of wound dressings and the focus on improving tablet properties require nanocellulose. The increasing use of medical and dental implants requires nanocellulose, supporting the overall market growth.
- The automotive & aerospace segment is growing at a significant rate in the market. The strong focus on lowering the weight of vehicles and the need for enhancing the fuel efficiency of aerospace requires nanocellulose. The manufacturing of lightweight vehicle materials and the focus on extending vehicle lifespans require nanocellulose. The rise in electric vehicles and government regulations on vehicle emission standards requires nanocellulose, driving the overall market growth.
Form Insights
How Wet Form Segment Dominated the Nanocellulose Market?
- The wet form segment dominated the nanocellulose market with a 61% share in 2024. The growing pulp and paper industry and existing infrastructure for papermaking require a wet form. The manufacturing of stabilizers, wound dressings, thickeners, drug delivery systems, and gelling agents requires a wet form. The ease of handling and lower shipping costs of wet form drives the market growth.
- The dry form segment is the fastest-growing in the market during the forecast period. The lower storage space requirements and focus on lowering water content require a dry form. The focus on enhancing nanocellulose product quality and the development of eco-friendly materials requires a dry form. The growing manufacturing of coatings and lightweight materials requires a dry form, supporting the overall market growth.
Regional Insights
The Europe nanocellulose market size was valued at USD 314.10 billion in 2025 and is expected to reach USD 2,646.62 billion by 2035, growing at a CAGR of 23.75% from 2025 to 2035. Europe dominated the nanocellulose market with a 41% share in 2024.
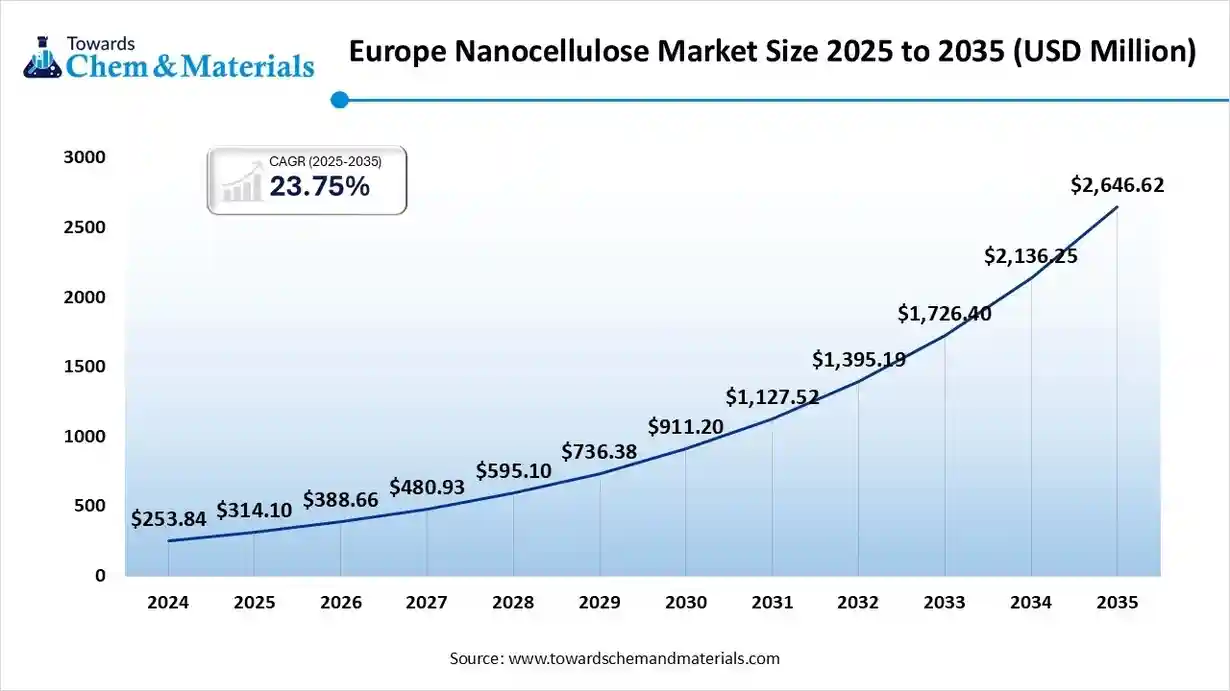
The strong focus on emphasis on sustainability through policies like the European Green Deal and a well-established industrial base increases demand for nanocellulose. The presence of abundant feedstocks like wood pulp in countries like Norway, Sweden, and Finland increases the production of nanocellulose. The presence of key players like Stora Enso, FiberLean Technologies, Borregaard, and UPM Technologies drives the market growth.
From Forest to Future: Germany at Helm of Nanocellulose Industry
Germany is a major contributor to the market. The stricter regulations on single-use plastics and the abundance of resources increase demand for nanocellulose. The advanced R&D infrastructure and strong government support for sustainable technologies help the market growth. The growing manufacturing of cosmetics, paper, automotive parts, and packaging solutions requires nanocellulose, supporting the overall growth of the market.
Asia Pacific Nanocellulose Market Trends
Asia Pacific expects the fastest growth in the market during the predicted period. The growing expansion of industries like electronics, packaging, and automotive increases demand for nanocellulose. The increasing awareness about sustainable materials and growing government investment in green technologies increases the adoption of nanocellulose. The expansion of manufacturing activities and the abundance of wood-based feedstocks increase the production of nanocellulose, driving the overall growth of the market.
Pioneering Progress: China's Leadership in Nanocellulose Development
China is a key contributor to the market. The presence of well-established manufacturing hubs and rapid growth in industrial activities increases the adoption of nanocellulose. The strong focus on using biodegradable materials and the presence of raw materials like plant-based biomass & wood increase the production of nanocellulose. The growing expansion of food packaging and personal care requires nanocellulose, supporting the overall market growth.
North America Nanocellulose Market Trends
North America is growing at a notable rate in the market. The growing awareness about sustainable products and rising environmental concerns increases demand for nanocellulose. The increasing demand for paper-based packaging and the expansion of healthcare applications require nanocellulose. The increased manufacturing of lightweight vehicle materials and high consumption of packaged food & beverages require nanocellulose, driving the overall market growth.
United States Influence on Nanocellulose Innovations
The United States is growing in the market. The growing demand for sustainable materials and significant government investment in eco-friendly technology increase the adoption of nanocellulose. The expansion of biomedical applications like medical implants, drug delivery systems, and wound dressings requires nanocellulose. The strong presence of industries like food & beverage, packaging, and personal care supports the market growth.
South America Nanocellulose Market Trends
South America is growing in the market. The abundance of raw materials like cereal straw, sugarcane bagasse, and corn stalks increases the production of nanocellulose. The growing adoption of eco-friendly packaging and the development of lightweight vehicle & construction materials require nanocellulose. The well-established pulp and paper industry and increasing preference for eco-friendly products drive the market growth.
Brazil Nanocellulose Market Trends
Brazil contributes to the growth of the market. The strong government support for the development of green technologies and initiatives for the adoption of nanocellulose-based materials helps the market. The abundance of raw materials and the presence of industries like construction, packaging, and paper support the overall market growth.
Middle East & Africa Nanocellulose Market Trends
The Middle East & Africa are growing at a significant rate in the nanocellulose market. The growing awareness about eco-friendly materials and the focus on lowering environmental impact increase demand for nanocellulose. The growing government investment in R&D and the increasing demand for high-performance materials require nanocellulose. The expansion of industries like packaging, construction, and healthcare drives the market growth.
Saudi Arabia Nanocellulose Market Trends
Saudi Arabia is growing in the market. The growing demand for precision treatments and increasing spending on healthcare procedures increases demand for nanocellulose for the development of drug delivery systems and wound dressings. The strong focus on sustainable packaging and growing construction activities requires nanocellulose, supporting the overall market growth.
Recent Developments
- In October 2024, UPM Biomedicals launched the world’s first injectable nanocellulose hydrogel, FibGel™, for implantable medical devices. The hydrogen is made up of water and birch wood cellulose. FibGel is widely used in applications like orthopaedic treatments, cell transplantation, soft tissue repair, drug delivery, and aesthetics. (Source: news.cision.com )
- In February 2025, CD Bioparticles launched advanced cellulose nanoparticles for diverse biomedical applications. The range includes cellulose nanofibrils, bacterial cellulose, and cellulose nanocrystals. The cellulose nanoparticles are used in applications like antifouling, drug delivery, bone regeneration, antibacterial agents, wound healing, and tissue engineering.(Source: www.conchovalleyhomepage.com )
- In September 2023, Ganni launched a handbag made up of bacterial leather at LDF. The bacterial leather is made up of nanocellulose, and it lowers greenhouse gas emissions.(Source: www.dezeen.com )
Top Nanocellulose Market Companies List
CelluForce Inc.
Corporate Information
- Name: CelluForce Inc.
- Headquarters: Montréal (Montreal), Canada.
- Manufacturing plant: Windsor, Québec (Canada) the company states it operates the world’s largest cellulose nanocrystals (CNC) plant with capacity of ~300 tons per year.
- Shareholders / parent structure: Originally a joint venture between FPInnovations and Domtar Inc. (launched 2010) additional strategic investors/shareholders include SLB (Schlumberger), Suzano S.A. (formerly Fibria) and Investissement Québec.
History and Background
- The scientific basis: Research in the 1990s (McGill University / Derek Gray) on isolating crystalline regions of cellulose (nanocrystals) set the foundation.
- 2004: FPInnovations began scale up efforts for cellulose nanocrystals production.
- 2010: CelluForce launched (as JV of Domtar & FPInnovations) to manufacture CNC commercially.
- 2011: The first demonstration plant built on Domtar’s Windsor mill site in Québec.
Key Developments and Strategic Initiatives
- In 2016: Strategic partnership with Fibria (Brazil) Fibria invested CAD 5.3 million to become shareholder and exclusive distributor/manufacturer rights in South America.
2019: Plant upgrade achieving >50% improvement in process efficiency, stabilized 300 t/y capacity.
Mergers & Acquisitions
- While CelluForce itself appears mainly as a specialized JV rather than undergoing major M&A, key equity/partnership changes include:
- Entry of SLB (Schlumberger) as shareholder & technology partner for oil & gas fluid applications.
- Fibria (later Suzano) becoming strategic shareholder for South America market access.
Partnerships & Collaborations
- FPInnovations: foundational research partner, and collaborator for product development (e.g., CelluShield).
- SLB/Schlumberger: joint research on CNC for oil & gas fluids applications.
Product Launches / Innovations
- CelluRods®: high quality sulfated CNC product line, available in powder or liquid, used in multiple applications (paints & coatings, packaging, cosmetics, etc.)
- CelluShield™ (2025): A barrier coating made from CNC for recyclable flexible packaging: oxygen transmission rate (OTR) <1 cc/m²·day, water vapour transmission rate (WVTR) <1 g/m²·day at 1 gsm coat. Compatible with PE, PP, PET mono material structures.
Key Technology Focus Areas
- Extraction and commercial scale production of cellulose nanocrystals from wood pulp/forest biomass.
- Surface modification / functionalisation of CNC to enable different application functionalities (e.g., barrier, reinforcement, rheology control).
R&D Organisation & Investment
IP Portfolio: Over 50 patent families in CNC manufacturing, surface modifications & applications.
Manufacturing plant upgrade (2019) aimed to improve process efficiency by >50% and stabilise production.
Research network: collaboration with universities, independent labs, government programs to generate new applications and commercialize CNC.
SWOT Analysis
Strengths
- Market leader in cellulose nanocrystals with largest reported commercial plant (300 t/y).
- Strong IP portfolio (>50 patent families) protecting core technology.
- Broad strategic partnerships across different industries (packaging, oil & gas, cosmetics) enabling diversified applications.
- Sustainability driven positioning (renewable wood source, recyclability focus) aligning with market trends.
Weaknesses
- Relatively niche material (CNC) compared to massive commodity cellulose or fibre markets scaling from tens to hundreds of tonnes is still small in global material context.
- High production cost / process complexity may limit margins or prohibit cost competitive substitution in some markets.
- Commercialisation of novel applications can be slow (time to market, qualification, regulation) meaning long lead times.
- Dependence on upstream wood/fibre sourcing and regulatory environmental issues (forest certification, biomass supply) could be a constraint.
Opportunities
- Growing demand for sustainable packaging solutions CelluShield™ offers a strong entry into that market.
Expanded applications in high value industries (automotive composites, electronics, smart textiles, biomedicals) open new revenue streams. - Global expansion, especially in emerging markets (South America via Suzano/Fibria partnership) offers geographic growth.
- Potential pricing premium for sustainable biomaterials and the trend of replacing petrochemical based materials with bio based alternatives.
Threats
- Competition from other nanocellulose producers, microfibrillated cellulose (MFC) suppliers, and alternative biomaterials could erode differentiation.
- Technological risk: process scale up challenges, cost reductions, or breakthroughs by competitors could reduce barriers.
- Market adoption risk: application qualification iterations, customer inertia, regulatory approvals may delay uptake.
- Raw material or energy cost increases, or supply chain disruptions (e.g., pulp/wood availability) could squeeze margins.
Recent News & Strategic Updates
- September 2025: Launch of CelluShield™ barrier coating for recyclable flexible packaging, developed in collaboration with FPInnovations and supported by Natural Resources Canada’s Transformative Technology Program & NRC IRAP.
- June 2025: Published news that CNC produced by CelluForce meets OECD biodegradability standards. (highlighting environmental credentials).
Other Top Companies List
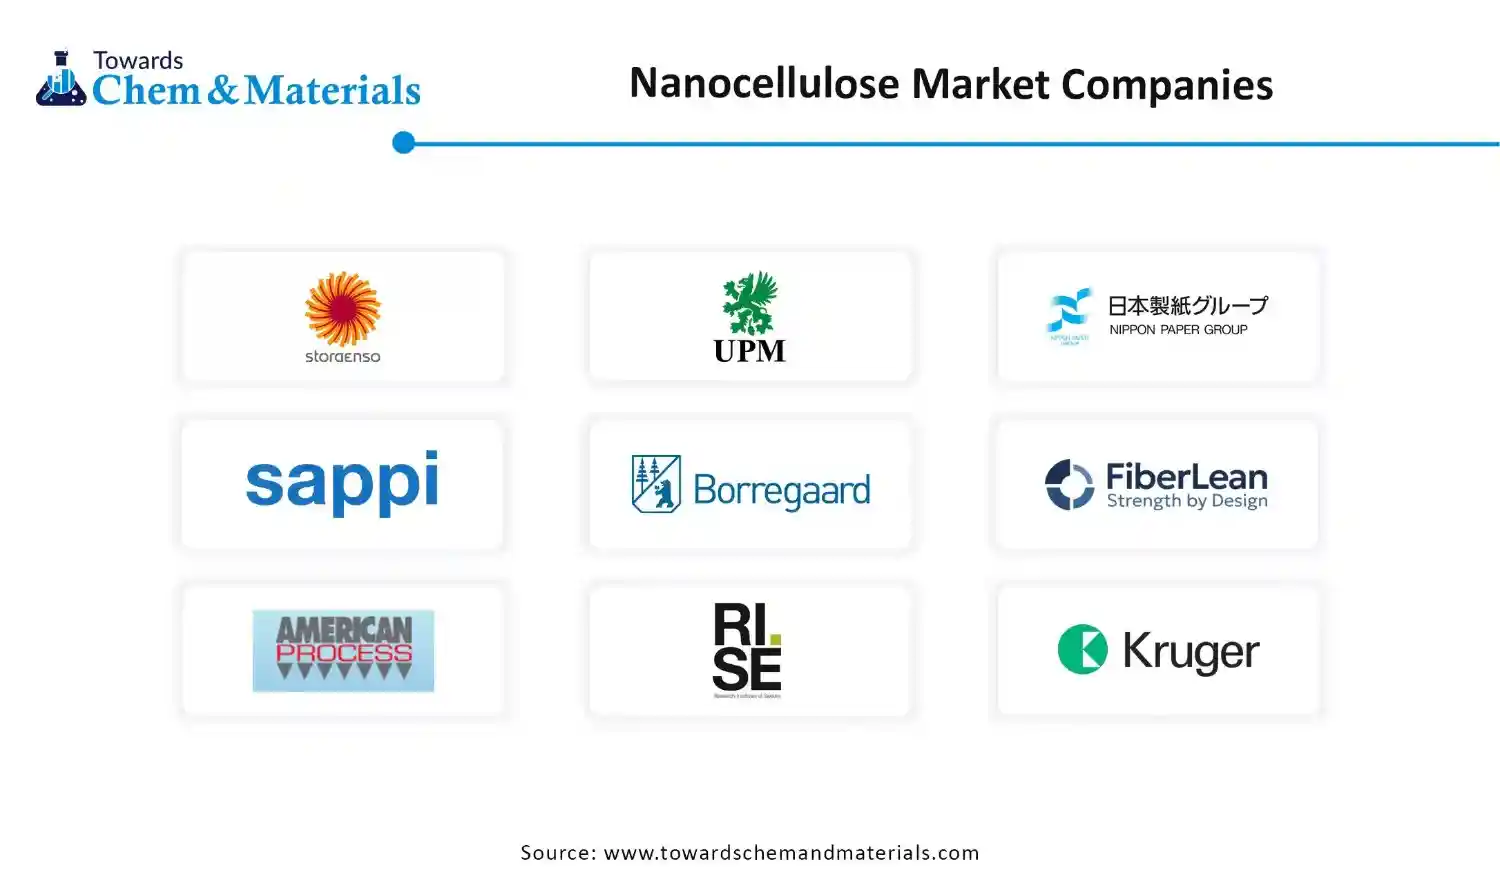
- Stora Enso Oyj: The company manufactures wood-based, renewable materials like wood products, packaging solutions, and biomaterials for consumers and diverse industries.
- UPM-Kymmene Corporation: The Finnish company produces eco-friendly materials like paper, biofuels, pulp, and plywood to support various industries.
- Nippon Paper Industries Co., Ltd.: Japanese company manufactures various products like paperboard, household paper, pulp & paper, and packaging.
- Sappi Limited: The South Africa-based company manufactures woodfiber-based products such as biomaterials, pulp, and paper.
- Borregaard ASA: The Norwegian-based company produces bioethanol, biochemicals, and biomaterials by using sustainable wood.
- FiberLean Technologies Ltd.
- American Process Inc.
- RISE Innventia AB
- Kruger Inc.
- GranBio Technologies
- Melodea Ltd.
- Oji Holdings Corporation
- Norske Skog ASA
- CelluComp Ltd.
Segments Covered
By Product Type
- Cellulose Nanofibrils (CNF)
- Cellulose Nanocrystals (CNC)
- Bacterial Nanocellulose (BNC)
By Raw Material Source
- Wood-Based Pulp
- Non-Wood Biomass
- Microbial / Bacterial Sources
By Processing Technology
- Mechanical Fibrillation
- Chemical & Enzymatic Pretreatment
- Electrospinning & Freeze-Drying
By End-Use Industry
- Packaging
- Automotive & Aerospace
- Healthcare & Life Sciences
- Textiles & Personal Care
- Construction & Coatings
By Form
- Dry Form (Powder / Aerogel)
- Wet Form (Suspension / Gel)
By Region
- North America
- U.S.
- Canada
- Mexico
- Europe
- Germany
- UK
- France
- Italy
- Spain
- Asia Pacific
- China
- India
- Japan
- South Korea
- Latin America
- Brazil
- Argentina
- Middle East & Africa
- Saudi Arabia
- South Africa
A Seven-Phase Framework
Our methodology is designed to be universally applicable across commodity chemicals, specialty chemicals, petrochemicals, construction chemicals, coatings, electronic chemicals, industrial gases, agrochemicals, water treatment chemicals, and performance materials. Each phase builds upon the last, creating a layered validation structure that minimizes estimation error and maximizes analytical confidence.
The framework ensures comprehensive market coverage, robust cross-validation, and reliable long-term forecasting — producing market estimates that withstand scrutiny from investors, regulators, and corporate strategy teams.

Seven-Phase Framework — Analytical Effort Distribution
Relative analytical effort allocated across each phase of the Chemicals & Materials research framework

Phase 1 - Secondary Research: Establishing the Foundation
Secondary research collects and evaluates publicly available information from authoritative sources, establishing the foundational understanding of market structure, value chain dynamics, competitive landscape, and end-use demand patterns. Every source is evaluated for credibility, recency, geographic relevance, and methodological soundness before inclusion.
Industry Associations
Sources include ACC, CEFIC, ICCA, JCIA, CPCIF, and SOCMA providing production volumes, consumption trends, capacity developments, and sustainability initiatives.
Company Disclosures
Annual reports, investor presentations, earnings transcripts, and regulatory filings reveal product portfolios, manufacturing footprints, capacity expansions, and revenue segmentation.
Government Databases
National statistical offices, customs authorities, environmental agencies, and industrial production databases provide verified statistics on output, trade flows, and regulatory compliance.
Trade Databases
UN Comtrade, ITC, Eurostat, and national customs authorities enable assessment of global product movement, import dependency, and export competitiveness across regions.
Our Secondary Research Sources
- Ministry of Chemicals and Fertilizers
- European Chemicals Agency
- United States Department of Energy
- Ministry of Industry and Information Technology
- Ministry of Economy Trade and Industry
- Ministry of Trade Industry and Energy
- National Institute of Standards and Technology
- Council of Scientific and Industrial Research
- Fraunhofer Society
- National Institute for Materials Science
Phase 2 — Supply-Side Assessment: Mapping Production Capabilities
Production Capacity Analysis
All major manufacturers are assessed for existing installed capacity, planned additions, expansions, new plant announcements, and technology adoption — mapped at global, regional, and country levels.
Capacity Utilization Adjustment
Installed capacity is adjusted using utilization rates based on demand conditions, feedstock availability, plant operating rates, maintenance schedules, and regulatory restrictions.
Manufacturer Revenue Analysis
Product-specific revenues, segment-level performance, regional distribution, average selling prices, and margin trends are evaluated to establish market value estimates.
Supply-Side Assessment — Capacity vs. Effective Production by Region
Illustrative comparison of installed capacity vs. effective production volume (after utilization rate adjustment) across major regions

Phase 3 — Demand-Side Assessment: Quantifying Chemical Consumption
Demand-side analysis quantifies chemical consumption across industries, applications, and geographies — identifying where and how chemicals are consumed throughout the value chain with precision.
End-Use Industry Analysis
Chemical demand is evaluated across automotive, construction, packaging, electronics, agriculture, healthcare, consumer goods, industrial manufacturing, energy and utilities, and water treatment. Industry output, production trends, and consumption intensity are analyzed to determine demand patterns.
Consumption Modeling
Demand is estimated using measurable indicators: kilograms per vehicle, kilograms per square meter of construction, dosage per cubic meter of water treated, kilograms per hectare of agricultural land, and kilograms per ton of manufactured products. Consumption factors are validated through industry publications and primary interviews.
Application Analysis
The market is segmented by application area to understand product performance requirements, formulation trends, technology adoption, customer preferences, and regulatory requirements improving demand accuracy and segmentation granularity.
Demand-Side Assessment — End-Use Industry Demand Distribution
Illustrative distribution of chemical & materials demand across key end-use industries

Phase 4 - Trade Flow Analysis: Balancing Regional Supply and Demand
Trade flow analysis reconciles regional supply and demand estimates through import and export data, identifying net supply positions, regional dependencies, and market imbalances. It serves as an independent validation layer that tests the consistency of supply-side and demand-side estimates.
Import Analysis
Import data is evaluated to determine volumes, source countries, product dependency, regional supply gaps, and pricing trends — identifying markets that rely heavily on external supply and where domestic production is insufficient to meet demand.
Export Analysis
Export assessments reveal production surplus, export competitiveness, regional manufacturing strength, and global market participation. Export patterns also help validate domestic production estimates and identify net exporting regions.
Apparent Consumption Model
Regional consumption is assessed using the standard apparent consumption formula:
Results identify net importing regions, net exporting regions, regional deficits, and surpluses — serving as an independent validation of supply and demand estimates.
Trade Flow Analysis — Net Supply Position by Region
Illustrative apparent consumption vs. domestic production across major regions — positive gap indicates net import dependency

Phase 5 — Primary Research: The Critical Validation Layer
Primary research tests and refines findings from secondary research through direct engagement with industry participants across the supply chain, demand side, and expert community. It captures intelligence that no database or published report can provide — the real-world experience of manufacturers, buyers, and specialists operating in the market.

Supply-Side Interviews
Conversations with chemical manufacturers, raw material suppliers, contract manufacturers, technology providers, and plant operators cover production trends, capacity utilization, pricing developments, technology shifts, and competitive dynamics.

Demand-Side Interviews
Engagement with OEMs, industrial consumers, procurement managers, distributors, formulators, and end-use manufacturers focuses on consumption trends, purchasing behavior, product substitution, demand outlook, and emerging applications.

Industry Expert Consultations
Additional interviews with industry consultants, independent experts, regulatory specialists, technical professionals, and research institutions provide deeper market context and validate key analytical assumptions.
Focus Areas of Primary Research:
Market Size & Forecast Validation
Revenue estimates, volume consumption, growth rates, forecast assumptions, regional demand.Supply Chain & Value Chain Assessment
Raw material sourcing, supply chain challenges, distribution networks, procurement practices.Production & Capacity Analysis
Manufacturing capacity, utilization rates, expansion projects, plant investments.Pricing & Cost Structure Analysis
Product pricing trends, feedstock costs, energy costs, margin pressures, pricing outlook.Competitive Landscape Assessment
Volume and value estimates confirmed to be fully consistent with one another before publicationInterview Volume by Market Scope
| Study Scope | Number of Interviews |
|---|---|
| Niche Market | 20 – 30 |
| Mid-Sized Market | 30 – 50 |
| Global Market | 50 – 80 |
| Highly Fragmented Market | 80 – 120 |
Interview Details:
Category : Manufacturers, Suppliers, Distributors, End Users, Experts/Associations
Average Duration : 30–60 Minutes
Interview Mode : Video calls, telephonic interviews, expert consultations
Interview Format : Structured / Semi-Structured questionnaire
Focus Areas of Primary Research:
Market Size & Forecast Validation :
Revenue estimates, volume consumption, growth rates, forecast assumptions, regional demand.
Supply Chain & Value Chain Assessment :
Raw material sourcing, supply chain challenges, distribution networks, procurement practices.
Production & Capacity Analysis :
Manufacturing capacity, utilization rates, expansion projects, plant investments.
Pricing & Cost Structure Analysis :
Product pricing trends, feedstock costs, energy costs, margin pressures, pricing outlook.
Competitive Landscape Assessment :
Market share, competitor positioning, strategic initiatives, partnerships, acquisitions.
Primary Research — Stakeholder Coverage by Category
Distribution of interview respondents across stakeholder categories (% share from PPT data)

Primary Research — Respondent Designation Profile
Seniority breakdown of interview respondents (% share from PPT data)

Primary Research — Geographic Coverage of Interviews
Regional distribution of primary research engagement (% share from PPT data)

Phase 6 — Data Triangulation and Market Validation
No single methodology is relied upon in isolation. Multiple independent estimation approaches are combined and reconciled to ensure consistency, accuracy, and analytical defensibility. Any material deviations between approaches are investigated and adjusted through additional validation cycles.
The final market size is derived through weighted triangulation of all validated methodologies. Any material deviations between approaches are investigated and adjusted through additional validation cycles. The outcome represents the most realistic assessment of the market based on available evidence and expert confirmation ensuring that volume and value estimates are fully consistent with one another.
Triangulation Framework — Input Contribution Weight
Relative weight each sizing input contributes to the final reconciled market estimate

Phase 7 — Forecast Modeling: Projecting Future Market Evolution
Forecasting evaluates the future trajectory of the market using a combination of quantitative indicators and qualitative assessments across economic, industry, and regulatory dimensions. Rather than simple extrapolation, each driver is independently modeled and integrated into a composite forecast.
Macroeconomic Indicators
GDP growth, industrial production, manufacturing output, construction activity, consumer spending, and capital investment form the quantitative foundation of long-term demand projections. These are applied at country, regional, and global levels.
Industry Growth Drivers
Urbanization, infrastructure development, industrialization, technological innovation, sustainability initiatives, and evolving product performance requirements are assessed at regional and industry levels — capturing both structural and cyclical demand drivers.
Capacity Expansion Analysis
Announced plant expansions, new manufacturing facilities, technology upgrades, and strategic investments are evaluated to determine future supply-demand dynamics and potential market tightness or oversupply situations.
Regulatory & Sustainability
Environmental regulations, chemical safety standards, emission reduction targets, circular economy initiatives, and sustainability requirements are incorporated as they often influence product adoption rates and market growth trajectories.
Scenario Forecast Range — Indexed Market Growth (Year 1–10)
Illustrative indexed growth trajectories across Base, Optimistic, and Pessimistic scenarios over a 10-year forecast horizon

Forecast Drivers — Relative Impact Score by Category
Impact score (0–100) of each driver type on chemicals & materials market forecast




Comments
Share your thoughts, ask a question, or provide feedback about this report.