
Biochemical Market Size, Competitive Landscape Analysis Report 2035
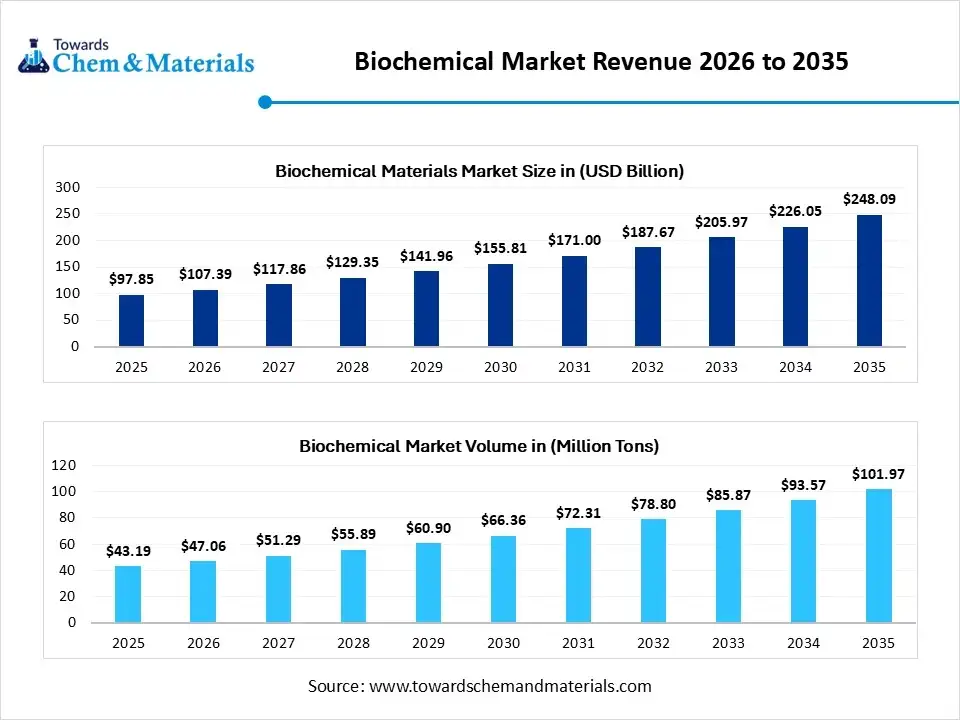
The global biochemical market size was valued at USD 97.85 billion in 2025, is estimated to reach USD 107.39 billion in 2026, and is projected to reach USD 248.09 billion by 2035, exhibiting a compound annual growth rate (CAGR) of 9.75% over the forecast period from 2026 to 2035. In terms of volume, the biochemical market is projected to grow from 43.19 million tons in 2025 to 101.97 million tons by 2035. growing at a CAGR of 8.97% from 2026 to 2035. Increasing demand for sustainable bio-based alternatives is the key factor driving market growth. Also, a surge in R&D investments in life sciences coupled with innovations in synthetic biology can fuel market growth further.
The Biochemicals are measurable molecules in the body like enzymes, proteins, hormones, or DNA, that show normal biological processes, pathogenic diseases, or pharmacological responses to a therapeutic treatment. They are used in clinical settings to gauge disease severity, diagnose conditions, and monitor recovery.
The global biochemical market spans various industrial applications, with the packaging sector currently maintaining the dominant market share. This leading position is mainly sustained by widespread plastic waste reduction initiatives and the integration of circular economy principles. The automotive sector is experiencing robust expansion as manufacturers pursue lightweight materials and adhere to strict carbon emission regulations.
Market Highlights
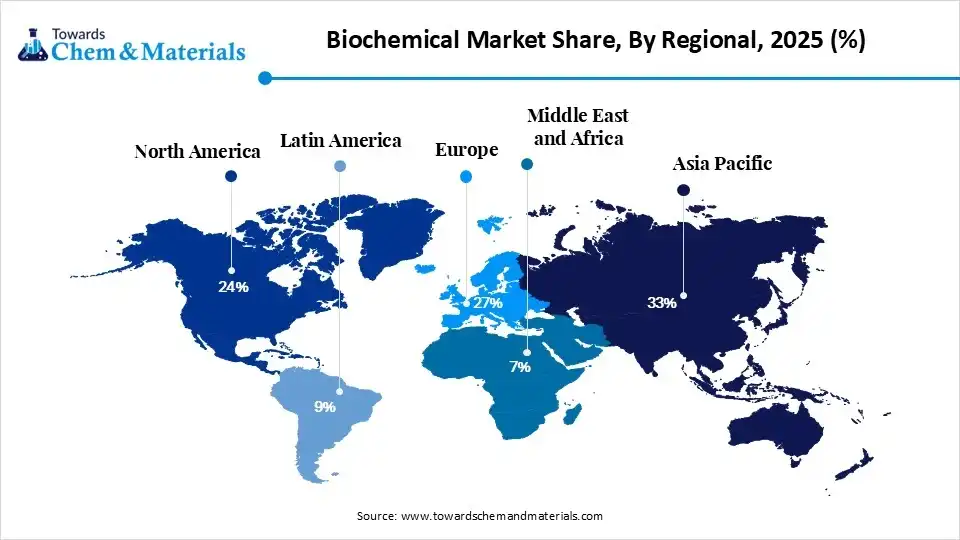
- By region, Asia Pacific dominated the market with the largest share of 33.00% in 2025 and is expected to grow at the fastest CAGR of 11.36% over the forecast period. The dominance and growth of the region can be attributed to the ongoing expansion of the pharmaceutical and food industry.
- By region, Europe held the 27% market share in 2025. The growth is driven by the rising pharmaceutical biochemical demand across the region.
- By product type, the biodiesel segment dominated the market with the largest share of 24.00% in 2025. The dominance of the segment can be attributed to the surge in global biodiesel production capacity.
- By product type, the health care segment is expected to grow at the fastest CAGR of 11.72% over the forecast period. The growth of the segment can be credited to the growing demand for advanced biochemical ingredients.
- By product reagent, the antibody production and purification reagents and kits segment dominated the market with the largest share of 21.00% in 2025. The dominance of the segment can be driven by an increase in investment in monoclonal antibody production.
- By product reagent, The DNA reagents segment is expected to grow at the fastest CAGR of 12.42% over the forecast period. The growth of the segment is owing to the growing PCR and sequencing reagent demand.
- By application, the pharmaceuticals segment dominated the market with the largest share of 31.00% in 2025. The dominance of the segment can be credited to the surge in procurement of biochemicals across the globe.
- By application, the food processing segment is expected to grow at the fastest CAGR of 11.46% during the projected period. The growth of the segment can be linked to the ongoing expansion of the processed food industry.
Quick Stats at a Glance
- Market Estimated Size (2025): USD 97.85 Billion | CAGR (2026–2035): 9.75%
- Market Projected Size (2035): USD 248.09 Billion
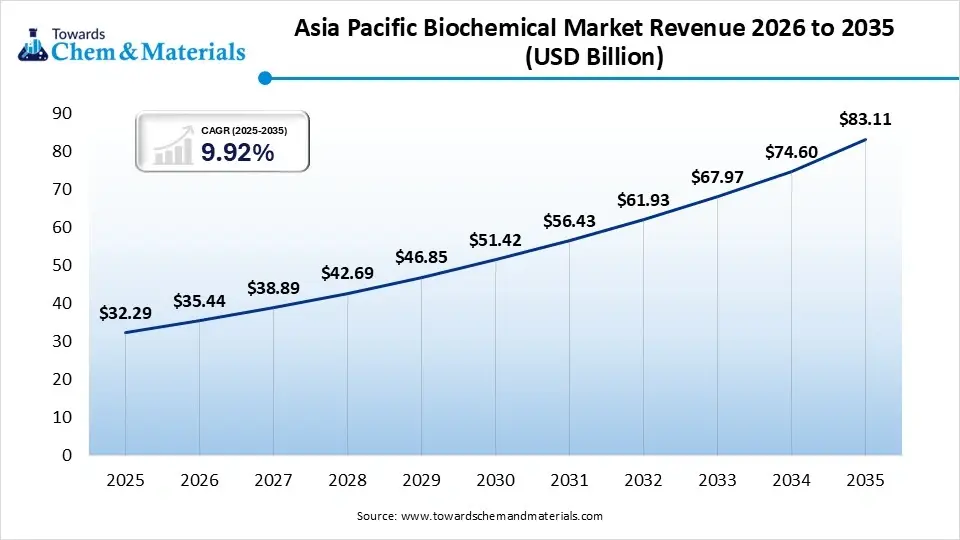
- Asia Pacific: largest Market Revenue Share of 33% in 2025 | USD 32.29 Billion
- Market Estimated Volume (2025): 43.19 Million Tons | Volume CAGR (2026–2035): 8.97%
- Market Projected Volume (2035): 101.97 Million Tons
- Market Pricing (2025):
- Average Manufacturing Price: USD 2,870 per Ton
- Average Selling Price: USD 4,190 per Ton
- Pricing CAGR (2025–2035): 3.89%
Market Trends
- Major market players are making efforts for sustainable and innovative products by partnering and collaborating within industries. Biochemicals are used to improve the efficiency, characteristics, or ecological sustainability of various products, procedures, or materials.
- The elderly population in the emerging region is becoming interested in the nutraceuticals industries, which is the latest trend in the market shaping positive market growth. The demand for phytochemical goods is increasing as a result of this.
- The growing need for cleaner fuels is another major trend in the market driving market growth over the forecast period. Biodiesel is a fuel for diesel engines which is made from oils and fats such as soybean oil and cooking oil. It is healthy, domestic, environmentally sound, and regenerative.
How Are Cutting-Edge AI Technologies Revolutionizing the Biochemical Market?
Artificial intelligence is revolutionizing the market by propelling drug discovery, optimizing bioprocess manufacturing, and facilitating metabolic pathway design. These AI-driven advancements minimize R&D timelines, enhance synthesis efficiency, and help companies to reveal potential market opportunities for current chemicals, reducing overall operational costs.
Report Scope
| Report Attribute | Details |
| Market Size in 2026 | USD 107.39 Billion |
| Expected Size by 2035 | USD 248.09 Billion |
| Growth Rate from 2025 to 2035 | CAGR 9.75% |
| Base Year of Estimation | 2025 |
| Forecast Period | 2025 - 2035 |
| Dominant Region | Asia Pacific |
| Segment Covered | By Product Type, By Product Reagent, By Application, By Regions |
| Key Companies Profiled | Thermo Fisher Scientific Inc, Merck KGaA, F. Hoffmann-La Roche AG, Bio-Rad Laboratories, Inc., Agilent Technologies, Inc., QIAGEN N.V., Danaher Corporation, Abbott Laboratories, Siemens Healthineers AG, Becton, Dickinson and Company (BD),PerkinElmer, Inc |
Supply Chain Analysis of the Biochemical Market
Feedstock Procurement
- It refers to the process of sourcing, purchasing, and transporting renewable biological raw materials like lignocellulose, starch, agricultural waste, and sugars.
- Major Players: Stora Enso, Drax Group
Chemical Synthesis and Processing
- It refers to the method used to create or modify complex biochemical compounds, bio-based chemicals, or Active Pharmaceutical Ingredients (APIs) from simpler materials.
- Major Players: Merck KGaA, Novozymes A/S
Packaging and Labeling
- It includes specialized processes of safely containing and marking sensitive substances like enzymes, reagents, and biologics. It ensures overall product stability and prevents contamination.
- Major Players: Intertek, IQVIA
Regulatory Compliance and Safety Monitoring
- It includes the legal frameworks, safety data protocols, and quality control systems needed to ensure that biochemical products are effective, safe, and environmentally responsible.
- Major Players: Freyr Solutions, Toxminds
Biochemical Markets Regulatory Landscape: Global Regulations
| Country/Region | Key Regulations |
| European Union (EU) | The European Medicines Agency (EMA) acts as the global benchmark for biosimilar approvals, relying heavily on a standardized, analytical, and clinical assessment pathway. |
| United States (USA) | For industrial and food biochemicals, the US leans heavily on voluntary notifications, and the GRAS (Generally Recognized as Safe) designation to bypass long approval queues. |
| United Kingdom (UK) | UK REACH: Implemented by the Health and Safety Executive (HSE), it requires unique data submissions for any chemical imported or manufactured above one tonne per year. |
Market Dynamics
Driver
Surge in Life Sciences Research
The market is witnessing rapid growth due to the expansion of clinical diagnostics and life sciences research. A surge in research in proteomics, molecular biology, genomics, and personalized medicine has facilitated the higher demand for reagents used in sequencing, immunoassays, PCR, and biomarker testing. In addition, the continuous rise in pharmaceutical research and development, combined with the increasing prevalence of chronic and infectious diseases, has driven an expansion in laboratory testing volumes.
Restraint
Financial & Economic Barriers
Manufacturing biochemicals generally costs 20% to 100% more than manufacturing traditional petrochemical alternatives. Scaling production systems from laboratory environments to industrial biorefineries needs intense upfront investment. Moreover, certain bio-based formulations continue to exhibit limitations in fully matching the structural durability, operational performance, and long-term storage efficacy of conventional synthetic chemicals, hindering market growth further.
Opportunity
Increasing Adoption of Personalized Medicine
The growing adoption of personalized medicine and growing healthcare infrastructure in developing countries is the major factor creating lucrative opportunities in the market. A surge in the use of biomarker-driven diagnostics and AI-enabled research platforms is facilitating the need for automation-oriented and specialized reagents. Furthermore, rising investments in biotechnology diagnostic laboratories, research centers, and government-supported healthcare programs across the Asia-Pacific, Latin America, and the Middle East are leading to market expansion soon.
Segmental Insights
Product Type Insights
The biodiesel segment dominated the market with the largest share of 24.00% in 2025. The dominance of the segment can be attributed to the surge in global biodiesel production capacity and growing adoption of cleaner fuel blending strategies. Waste oil recycling further enhances sustainable feedstock utilization efficiency.
The health care segment held a market share of 12.00% in 2025 and is expected to grow at the fastest CAGR of 11.72% over the forecast period. The growth of the segment can be credited to the growing demand for advanced biochemical ingredients and ongoing innovation in biopharmaceuticals boosting healthcare biochemical consumption.
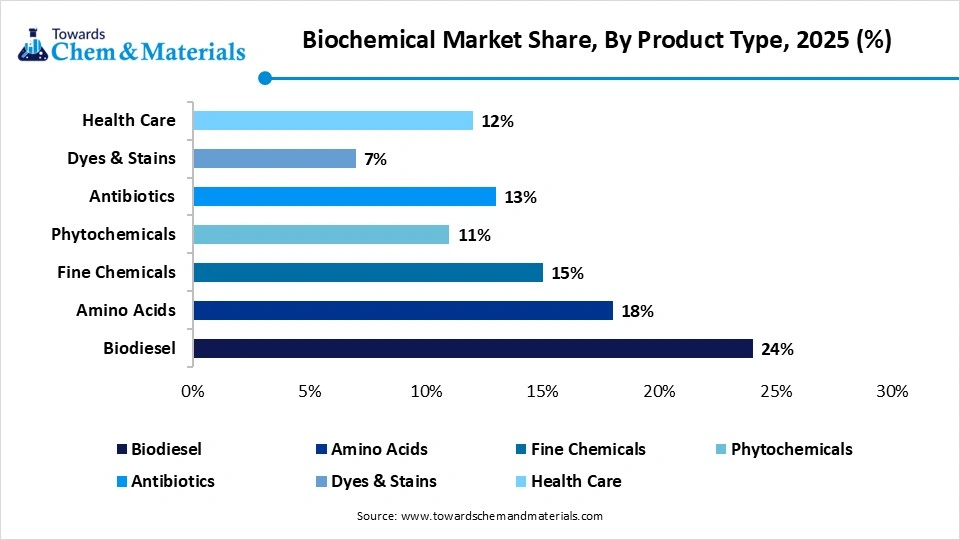
The amino acids segment held a market share of 18.00% in 2025. The growth of the segment can be linked to the increasing demand for specialty amino compounds in pharmaceutical manufacturing and the growth of feed-grade amino acid consumption across the globe. Protein-enriched food applications will soon support market growth.
The fine chemicals segment held a market share of 15.00% in 2025. The growth of the segment can be driven by the growing need for advanced intermediates and laboratory and catalyst applications supporting industrial biochemical usage. Precision chemical synthesis improves overall product customization abilities.
Biochemical Market Share, By Product Type, 2025 (%)
| By Product Type | Revenue Share, 2025 (%) |
| Biodiesel | 24% |
| Amino Acids | 18% |
| Fine Chemicals | 15% |
| Phytochemicals | 11% |
| Antibiotics | 13% |
| Dyes & Stains | 7% |
| Health Care | 12% |
Product Reagent Insights
The antibody production and purification reagents and kits segment dominated the market with the largest share of 21.00% in 2025. The dominance of the segment can be driven by an increase in investment in monoclonal antibody production and growing demand for diagnostic testing boosting purification reagent commercialization across the globe. Biotechnology research initiatives support advanced immunology reagent adoption.
The DNA reagents segment held a market share of 18.00% in 2025 and is expected to grow at the fastest CAGR of 12.42% over the forecast period. The growth of the segment is owing to the growing PCR and sequencing reagent demand due to expansion in genomic research. Precision medicine boosts molecular diagnostic testing across the globe.
The amino alcohols segment held a market share of 14.00% in 2025. The growth of the segment is due to a surge in amino alcohols consumption across different industries and industrial chemical formulations requiring advanced specialized alcohol compounds. Surfactants production increases utilization in specialty biochemical applications.
The carbohydrates segment held a market share of 12.00% in 2025. The growth of the segment can be attributed to the growing utilization of specialty carbohydrates in the food and beverage industries along with the innovation in carbohydrate development. Nutritional ingredient applications boost demand for biochemical sugars.
Biochemical Market Share, By Product Reagent, 2025 (%)
| By Product Reagent | Revenue Share, 2025 (%) |
| Amino Alcohols | 14% |
| Antibody Production and Purification Reagents and Kits | 21% |
| Carbohydrates | 12% |
| DNA Reagents | 18% |
| Filter Aids and Diatomaceous Earth | 9% |
| Fluorescent in situ hybridization Reagents | 11% |
| Food Chemistry Kits and Reagents | 8% |
| Others | 7% |
Application Insights
The pharmaceuticals segment dominated the market with the largest share of 31.00% in 2025. The dominance of the segment can be credited to the surge in procurement of biochemicals across the globe and vaccines and biologics production boosting specialty chemical demand. Pharmaceutical advanced fields continue investments in cutting-edge synthesis technology.
The food processing segment held a market share of 19.00% in 2025 and is expected to grow at the fastest CAGR of 11.46% during the projected period. The growth of the segment can be linked to the ongoing expansion of the processed food industry due to biochemical preservation enhancement applications. Nutritional fortification increases the need for specialty food ingredients across the globe.
The agriculture segment held a market share of 16.00% in 2025. The growth of the segment can be driven by the growing adoption of biochemical crop treatments due to sustainable farming practices and bio stimulants improving overall agricultural productivity and soil health management. Organic farming growth supports sustainable biochemical product demand.The automotive segment held a market share of 14.00% in 2025. The growth of the segment is owing to the surge in biochemical consumption steadily across the globe and the growing adoption of biochemical fuel additives. The automotive industry is focusing on renewable fluid technologies for compliance.
Biochemical Market Share, By Application, 2025 (%)
| By Application | Revenue Share, 2025 (%) |
| Pharmaceuticals | 31% |
| Dairy | 11% |
| Automotive | 14% |
| Agriculture | 16% |
| Textile | 9% |
| Food Processing | 19% |
Regional Insights
How did Asia Pacific Dominate the Biochemical Market in 2025?
The Asia Pacific biochemical market size was estimated at USD 32.29 billion in 2025 and is projected to reach USD 83.11 billion by 2035, growing at a CAGR of 9.92% from 2026 to 2035.Asia Pacific dominated the market with the largest share of 33.00% in 2025 and is expected to grow at the fastest CAGR of 11.36% over the forecast period. The dominance and growth of the region can be attributed to the ongoing expansion of the pharmaceutical and food industries, boosting biochemical consumption in emerging countries along with the surge in healthcare expenditure. In addition, changing consumer preferences is propelling the use of bio-based chemicals.
China
- The increasing incidence of cardiovascular issues, diabetes, and cancer fuels the demand for protein-based therapeutics.
- Chinas biotech IPO volume has competed with the United States, boosting the demand for cell and tissue culture reagents.
India
- The inclination towards regenerative biomanufacturing and eco-friendly manufacturing under the BioE3 policy fuels research and production.
- The ongoing adoption of genomic research and Next-Generation Sequencing (NGS) is impelling the demand for high-grade biochemical reagents.
The Europe biochemical market size was estimated at USD 26.42 billion in 2025 and is projected to reach USD 68.22 billion by 2035, growing at a CAGR of 9.95% from 2026 to 2035.Europe held a market share of 27.00% in 2025. The growth of the region can be credited to the growing pharmaceutical biochemical demand across the region and circular initiatives boosting industrial biotechnology adaptation. Furthermore, a surge in the prevalence of neurological disorders and cancer in emerging nations is impelling research and drug discovery services, facilitating reagent usage.
Germany
- The countrys robust commitment to cell culture research, personalized medicine, and bio-manufacturing requires a proper supply of regulatory proteins.
- Companies in the country are increasingly embedding AI into biochemical research to facilitate strain development.
The North America biochemical market size was estimated at USD 24.46 billion in 2025 and is projected to reach USD 63.26 billion by 2035, growing at a CAGR of 9.97% from 2026 to 2035.North America held a market share of 24.00% in 2025. The growth of the region can be linked to the presence of a robust biotechnology infrastructure supporting cutting-edge biochemical manufacturing growth and ongoing innovations in pharmaceuticals driving the commercialization of specialty reagents activities. Also, a rise in government funding for regenerative medicine and oncology can impact positive market growth further.
United States
- Increasing investment in oncology, regenerative medicine, and stem cell research needs high-purity biological inputs.
- Expanded use in proteomics, genomics, and molecular biology is boosting laboratory-grade reagent consumption in the country.
The Latin America biochemical market size was estimated at USD 8.81 billion in 2025 and is projected to reach USD 23.57 billion by 2035, growing at a CAGR of 10.34% from 2026 to 2035.Latin America held a market share of 9.00% in 2025. The growth of the region can be linked to the surge in biofuel production investment boosting the demand for industrial biochemicals coupled with the growing adoption of specialty biochemical ingredients. Institutions in the region are growing their cell biology research, propelling the consumption of lyophilized powders.
Brazil
- The market in the country is fueled by growing instances of chronic diseases and a surge in the geriatric population that needs regenerative medicine.
- The growth of the pharmaceutical market in the country fueled demand for innovative therapies, leading to market expansion soon.
Argentina
- The ongoing growth of Latin American biotech infrastructure and life sciences, such as major players including Bioceres Crop Solutions, is growing the need for biological reagents.
- Cytokines are crucial in drug discovery platforms, oncology and hematology pipelines, and regenerative medicine.
The Middle East and Africa biochemical market size was estimated at USD 6.85 billion in 2025 and is projected to reach USD 18.61 billion by 2035, growing at a CAGR of 10.51% from 2026 to 2035.The Middle East & Africa held a market share of 7.00% in 2025. The growth of the region can be driven by a surge in R&D investments, growing government initiatives to go beyond oil, and the regions emphasis on building local production infrastructure. Furthermore, updates in logistics and regional supply chains allow good market penetration for bio-based and biochemical reagents.
Biochemical Market Share, By Regional, 2025 (%)
| Regional | Revenue Share, 2025 (%) |
| North America | 24% |
| Europe | 27% |
| Asia-Pacific | 33% |
| Latin America | 9% |
| Middle East & Africa | 7% |
Saudi Arabia
- Major players are expanding their presence heavily to combat chronic diseases, with Saudi Arabia driving market growth soon.
- Growing emphasis on genetic screening and personalized medicine is fueling the local demand for clinical diagnostics.
UAE
- The increase in demand for complex biologic drugs and cancer treatments propels the need for high-grade biochemical reagents.
- Major institutions have already established strong microfluidic and molecular biology labs, boosting the biochemicals consumption.
Recent Development
- In May 2026, The Federal Government has launched the National Bioeconomy Development Plan (PNDBio), established under the framework of the National Bioeconomy Strategy via Decree No. 12,044/2024. This initiative aims to integrate Brazil’s extensive biodiversity as a core pillar of national economic development by 2035.(Source: www.mayerbrown.com)
Biochemical Market Companies
- Thermo Fisher Scientific Inc: Thermo Fisher Scientific Inc. is a global life sciences giant headquartered in Waltham, Massachusetts. Operating at a market capitalization of over $185 billion, it commands a dominant position in the biochemical and clinical research markets by supplying end-to-end analytical instruments, reagents, software, and biopharma services worldwide.
- Merck KGaA: Merck KGaA is a global science and technology leader headquartered in Darmstadt, Germany. In the biochemical and life sciences market, it operates via its Life Science division doing business as MilliporeSigma in the U.S. and Canada.
Other Companies in the Market
- F. Hoffmann La Roche AG
- Bio Rad Laboratories, Inc.
- Agilent Technologies, Inc.
- QIAGEN N.V.
- Danaher Corporation
- Abbott Laboratories
- Siemens Healthineers AG
- Becton, Dickinson and Company (BD)
- PerkinElmer, Inc.
Segments Covered in the Report
By Product Type
- Biodiesel
- Soy-based Biodiesel
- Palm-based Biodiesel
- Waste Oil Biodiesel
- Amino Acids
- Feed Grade Amino Acids
- Pharmaceutical Grade Amino Acids
- Food Grade Amino Acids
- Fine Chemicals
- Specialty Intermediates
- Catalysts
- Laboratory Chemicals
- Phytochemicals
- Flavonoids
- Alkaloids
- Terpenoids
- Polyphenols
- Antibiotics
- Penicillin
- Cephalosporin
- Macrolides
- Tetracyclines
- Dyes & Stains
- Biological Dyes
- Histology Stains
- Textile Biochemical Dyes
- Health Care
- Nutraceuticals
- Biopharmaceutical Ingredients
- Diagnostic Biochemicals
By Product Reagent
- Amino Alcohols
- Ethanolamines
- Propanolamines
- Specialty Amino Alcohols
- Antibody Production and Purification Reagents and Kits
- Affinity Chromatography Reagents
- ELISA Kits
- Protein Purification Kits
- Carbohydrates
- Monosaccharides
- Polysaccharides
- Specialty Sugars
- DNA Reagents
- PCR Reagents
- Sequencing Reagents
- Extraction Kits
- Filter Aids and Diatomaceous Earth
- Natural Diatomaceous Earth
- Calcined Diatomaceous Earth
- Flux-calcined Grades
- Fluorescent in situ hybridization Reagents
- DNA Probes
- RNA Probes
- Hybridization Buffers
- Food Chemistry Kits and Reagents
- Nutrient Testing Kits
- Contaminant Testing Reagents
- Shelf-life Analysis Reagents
- Others
- Enzyme Reagents
- Cell Culture Reagents
- Buffer Solutions
By Application
- Pharmaceuticals
- Drug Formulation
- Vaccine Production
- Biopharmaceutical Manufacturing
- Dairy
- Fermentation Processes
- Enzyme Applications
- Quality Testing
- Automotive
- Biofuels
- Lubricant Additives
- Industrial Fluids
- Agriculture
- Biostimulants
- Crop Protection
- Soil Treatment
- Textile
- Bio-based Dyeing
- Finishing Chemicals
- Fabric Processing
- Food Processing
- Food Preservation
- Flavor Enhancement
- Nutritional Fortification
By Geography
- North America
- Europe
- Asia-Pacific
- Latin America
- Middle East & Africa (MEA)
A Seven-Phase Framework
Our methodology is designed to be universally applicable across commodity chemicals, specialty chemicals, petrochemicals, construction chemicals, coatings, electronic chemicals, industrial gases, agrochemicals, water treatment chemicals, and performance materials. Each phase builds upon the last, creating a layered validation structure that minimizes estimation error and maximizes analytical confidence.
The framework ensures comprehensive market coverage, robust cross-validation, and reliable long-term forecasting — producing market estimates that withstand scrutiny from investors, regulators, and corporate strategy teams.

Seven-Phase Framework — Analytical Effort Distribution
Relative analytical effort allocated across each phase of the Chemicals & Materials research framework

Phase 1 - Secondary Research: Establishing the Foundation
Secondary research collects and evaluates publicly available information from authoritative sources, establishing the foundational understanding of market structure, value chain dynamics, competitive landscape, and end-use demand patterns. Every source is evaluated for credibility, recency, geographic relevance, and methodological soundness before inclusion.
Industry Associations
Sources include ACC, CEFIC, ICCA, JCIA, CPCIF, and SOCMA providing production volumes, consumption trends, capacity developments, and sustainability initiatives.
Company Disclosures
Annual reports, investor presentations, earnings transcripts, and regulatory filings reveal product portfolios, manufacturing footprints, capacity expansions, and revenue segmentation.
Government Databases
National statistical offices, customs authorities, environmental agencies, and industrial production databases provide verified statistics on output, trade flows, and regulatory compliance.
Trade Databases
UN Comtrade, ITC, Eurostat, and national customs authorities enable assessment of global product movement, import dependency, and export competitiveness across regions.
Our Secondary Research Sources
- Ministry of Chemicals and Fertilizers
- European Chemicals Agency
- United States Department of Energy
- Ministry of Industry and Information Technology
- Ministry of Economy Trade and Industry
- Ministry of Trade Industry and Energy
- National Institute of Standards and Technology
- Council of Scientific and Industrial Research
- Fraunhofer Society
- National Institute for Materials Science
Phase 2 — Supply-Side Assessment: Mapping Production Capabilities
Production Capacity Analysis
All major manufacturers are assessed for existing installed capacity, planned additions, expansions, new plant announcements, and technology adoption — mapped at global, regional, and country levels.
Capacity Utilization Adjustment
Installed capacity is adjusted using utilization rates based on demand conditions, feedstock availability, plant operating rates, maintenance schedules, and regulatory restrictions.
Manufacturer Revenue Analysis
Product-specific revenues, segment-level performance, regional distribution, average selling prices, and margin trends are evaluated to establish market value estimates.
Supply-Side Assessment — Capacity vs. Effective Production by Region
Illustrative comparison of installed capacity vs. effective production volume (after utilization rate adjustment) across major regions

Phase 3 — Demand-Side Assessment: Quantifying Chemical Consumption
Demand-side analysis quantifies chemical consumption across industries, applications, and geographies — identifying where and how chemicals are consumed throughout the value chain with precision.
End-Use Industry Analysis
Chemical demand is evaluated across automotive, construction, packaging, electronics, agriculture, healthcare, consumer goods, industrial manufacturing, energy and utilities, and water treatment. Industry output, production trends, and consumption intensity are analyzed to determine demand patterns.
Consumption Modeling
Demand is estimated using measurable indicators: kilograms per vehicle, kilograms per square meter of construction, dosage per cubic meter of water treated, kilograms per hectare of agricultural land, and kilograms per ton of manufactured products. Consumption factors are validated through industry publications and primary interviews.
Application Analysis
The market is segmented by application area to understand product performance requirements, formulation trends, technology adoption, customer preferences, and regulatory requirements improving demand accuracy and segmentation granularity.
Demand-Side Assessment — End-Use Industry Demand Distribution
Illustrative distribution of chemical & materials demand across key end-use industries

Phase 4 - Trade Flow Analysis: Balancing Regional Supply and Demand
Trade flow analysis reconciles regional supply and demand estimates through import and export data, identifying net supply positions, regional dependencies, and market imbalances. It serves as an independent validation layer that tests the consistency of supply-side and demand-side estimates.
Import Analysis
Import data is evaluated to determine volumes, source countries, product dependency, regional supply gaps, and pricing trends — identifying markets that rely heavily on external supply and where domestic production is insufficient to meet demand.
Export Analysis
Export assessments reveal production surplus, export competitiveness, regional manufacturing strength, and global market participation. Export patterns also help validate domestic production estimates and identify net exporting regions.
Apparent Consumption Model
Regional consumption is assessed using the standard apparent consumption formula:
Results identify net importing regions, net exporting regions, regional deficits, and surpluses — serving as an independent validation of supply and demand estimates.
Trade Flow Analysis — Net Supply Position by Region
Illustrative apparent consumption vs. domestic production across major regions — positive gap indicates net import dependency

Phase 5 — Primary Research: The Critical Validation Layer
Primary research tests and refines findings from secondary research through direct engagement with industry participants across the supply chain, demand side, and expert community. It captures intelligence that no database or published report can provide — the real-world experience of manufacturers, buyers, and specialists operating in the market.

Supply-Side Interviews
Conversations with chemical manufacturers, raw material suppliers, contract manufacturers, technology providers, and plant operators cover production trends, capacity utilization, pricing developments, technology shifts, and competitive dynamics.

Demand-Side Interviews
Engagement with OEMs, industrial consumers, procurement managers, distributors, formulators, and end-use manufacturers focuses on consumption trends, purchasing behavior, product substitution, demand outlook, and emerging applications.

Industry Expert Consultations
Additional interviews with industry consultants, independent experts, regulatory specialists, technical professionals, and research institutions provide deeper market context and validate key analytical assumptions.
Focus Areas of Primary Research:
Market Size & Forecast Validation
Revenue estimates, volume consumption, growth rates, forecast assumptions, regional demand.Supply Chain & Value Chain Assessment
Raw material sourcing, supply chain challenges, distribution networks, procurement practices.Production & Capacity Analysis
Manufacturing capacity, utilization rates, expansion projects, plant investments.Pricing & Cost Structure Analysis
Product pricing trends, feedstock costs, energy costs, margin pressures, pricing outlook.Competitive Landscape Assessment
Volume and value estimates confirmed to be fully consistent with one another before publicationInterview Volume by Market Scope
| Study Scope | Number of Interviews |
|---|---|
| Niche Market | 20 – 30 |
| Mid-Sized Market | 30 – 50 |
| Global Market | 50 – 80 |
| Highly Fragmented Market | 80 – 120 |
Interview Details:
Category : Manufacturers, Suppliers, Distributors, End Users, Experts/Associations
Average Duration : 30–60 Minutes
Interview Mode : Video calls, telephonic interviews, expert consultations
Interview Format : Structured / Semi-Structured questionnaire
Focus Areas of Primary Research:
Market Size & Forecast Validation :
Revenue estimates, volume consumption, growth rates, forecast assumptions, regional demand.
Supply Chain & Value Chain Assessment :
Raw material sourcing, supply chain challenges, distribution networks, procurement practices.
Production & Capacity Analysis :
Manufacturing capacity, utilization rates, expansion projects, plant investments.
Pricing & Cost Structure Analysis :
Product pricing trends, feedstock costs, energy costs, margin pressures, pricing outlook.
Competitive Landscape Assessment :
Market share, competitor positioning, strategic initiatives, partnerships, acquisitions.
Primary Research — Stakeholder Coverage by Category
Distribution of interview respondents across stakeholder categories (% share from PPT data)

Primary Research — Respondent Designation Profile
Seniority breakdown of interview respondents (% share from PPT data)

Primary Research — Geographic Coverage of Interviews
Regional distribution of primary research engagement (% share from PPT data)

Phase 6 — Data Triangulation and Market Validation
No single methodology is relied upon in isolation. Multiple independent estimation approaches are combined and reconciled to ensure consistency, accuracy, and analytical defensibility. Any material deviations between approaches are investigated and adjusted through additional validation cycles.
The final market size is derived through weighted triangulation of all validated methodologies. Any material deviations between approaches are investigated and adjusted through additional validation cycles. The outcome represents the most realistic assessment of the market based on available evidence and expert confirmation ensuring that volume and value estimates are fully consistent with one another.
Triangulation Framework — Input Contribution Weight
Relative weight each sizing input contributes to the final reconciled market estimate

Phase 7 — Forecast Modeling: Projecting Future Market Evolution
Forecasting evaluates the future trajectory of the market using a combination of quantitative indicators and qualitative assessments across economic, industry, and regulatory dimensions. Rather than simple extrapolation, each driver is independently modeled and integrated into a composite forecast.
Macroeconomic Indicators
GDP growth, industrial production, manufacturing output, construction activity, consumer spending, and capital investment form the quantitative foundation of long-term demand projections. These are applied at country, regional, and global levels.
Industry Growth Drivers
Urbanization, infrastructure development, industrialization, technological innovation, sustainability initiatives, and evolving product performance requirements are assessed at regional and industry levels — capturing both structural and cyclical demand drivers.
Capacity Expansion Analysis
Announced plant expansions, new manufacturing facilities, technology upgrades, and strategic investments are evaluated to determine future supply-demand dynamics and potential market tightness or oversupply situations.
Regulatory & Sustainability
Environmental regulations, chemical safety standards, emission reduction targets, circular economy initiatives, and sustainability requirements are incorporated as they often influence product adoption rates and market growth trajectories.
Scenario Forecast Range — Indexed Market Growth (Year 1–10)
Illustrative indexed growth trajectories across Base, Optimistic, and Pessimistic scenarios over a 10-year forecast horizon

Forecast Drivers — Relative Impact Score by Category
Impact score (0–100) of each driver type on chemicals & materials market forecast




Comments
Share your thoughts, ask a question, or provide feedback about this report.