Content
What is the Current Chemical Decarbonization Market Size and Share?
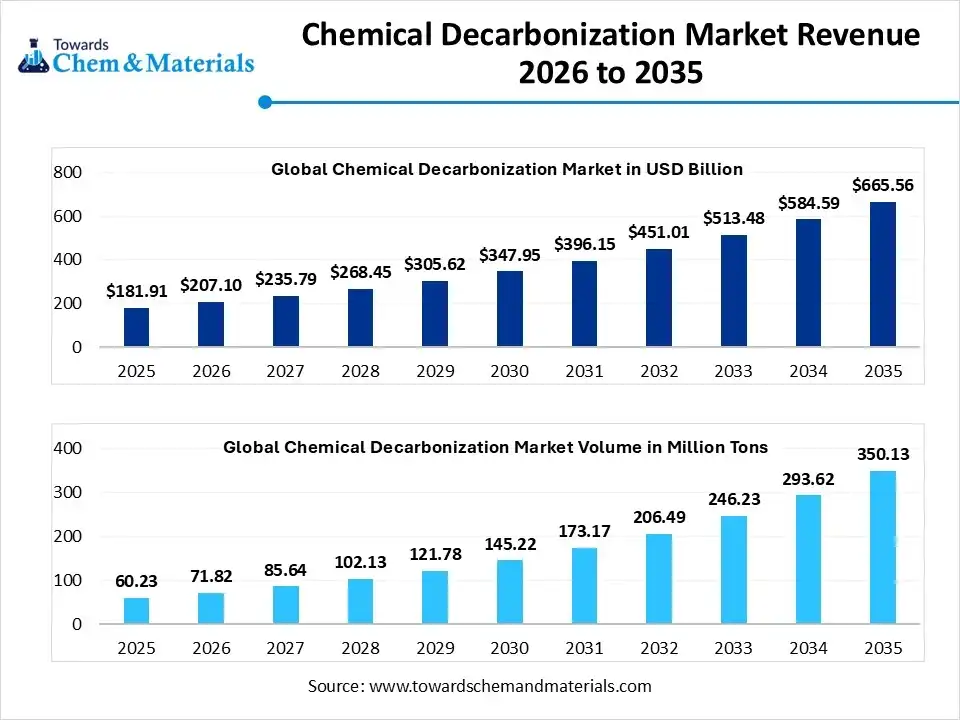
The global chemical decarbonization market size was estimated at USD 181.91 billion in 2025 and is expected to increase from USD 207.10 billion in 2026 to USD 665.56 billion by 2035, growing at a CAGR of 13.85%. In terms of volume, the market is projected to grow from 71.82 million tons in 2026 to 350.13 million tons by 2035. exhibiting at a compound annual growth rate (CAGR) of 19.25% over the forecast period 2026 to 2035. The Asia Pacific dominated chemical decarbonization market with the largest volume share of 42.13% in 2025.

The growth of the market is driven by rising regulatory pressure to cut industrial emissions, increasing adoption of low-carbon technologies, and strong investments in green chemistry and sustainable production processes. the chemical decarbonization market focuses on lowering greenhouse gas emissions from the production of chemicals by using low-carbon feedstocks, electrification of energy, and carbon capture. Adoption among major chemical producers is accelerating due to growing climate commitments, net zero targets, and more stringent environmental regulations.Large-scale implementation of decarbonization solutions is being further supported by public-private investments and technological developments.
Report Highlights
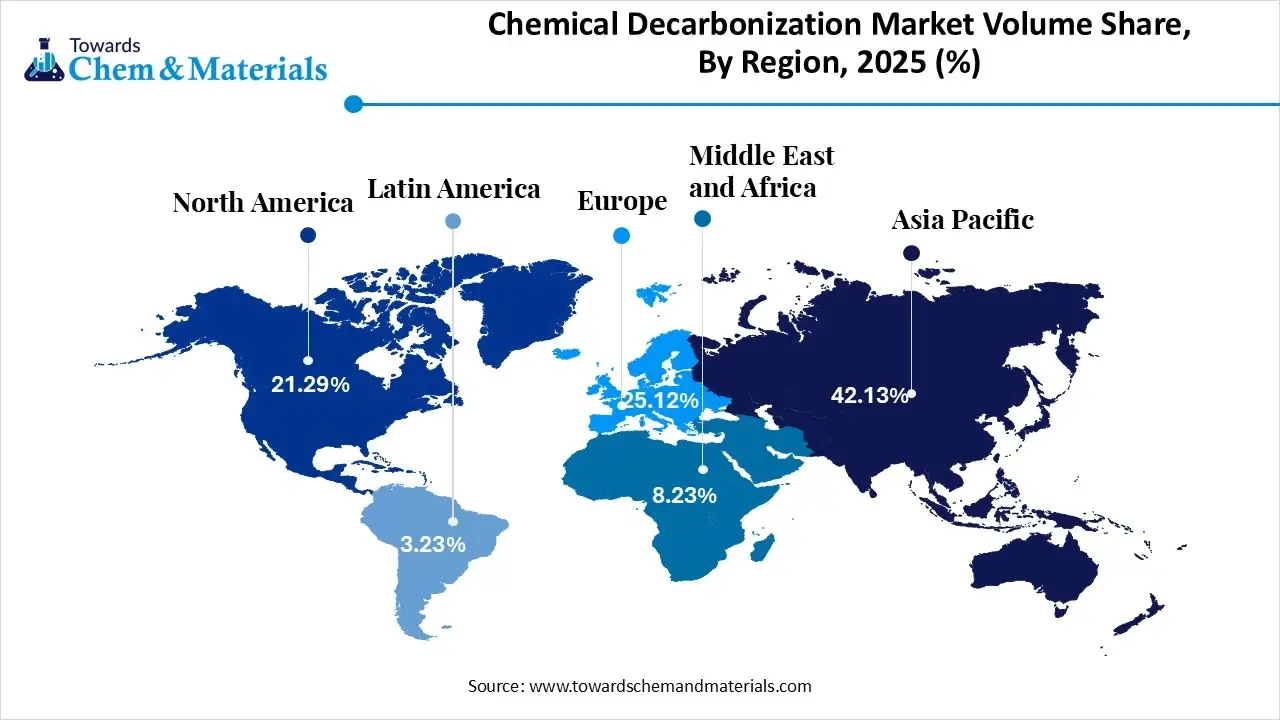
- Asia Pacific dominated the global chemical decarbonization market with the largest volume share of 42.13% in 2025.
- The chemical decarbonization market in Europe is expected to grow at a substantial CAGR of 23.13% from 2026 to 2035.
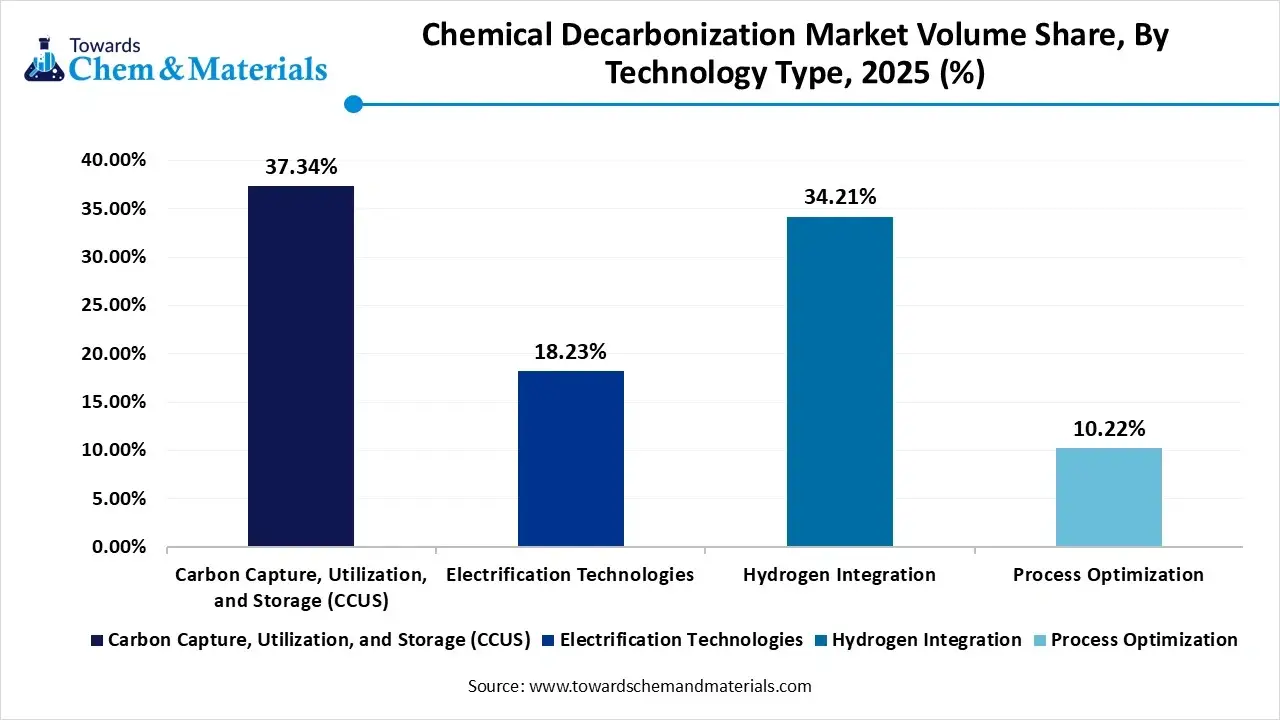
- By technology, the Carbon Capture, Utilization, and Storage (CCUS) segment dominated the market and accounted for the largest volume share of 37% in 2025.
- By technology, the electrification technologies segment is expected to grow at the fastest CAGR of 24.37% from 2026 to 2035 in terms of volume.
- By feedstock, the bio-based feedstocks segment led the market with the largest revenue volume share of 64% in 2025.
- By product group, the ammonia and fertilizers segment dominated the market and accounted for the largest volume share of 37% in 2025.
Market Trends
- Industry Growth Overview: The market is growing due to strict emission regulations, net-zero commitments, and rising investments in low-carbon chemical technologies.
- Sustainability Trends: Companies adopt renewable energy, green hydrogen, and circular production methods to reduce carbon footprints.
- Startup Ecosystem: Startups drive innovation in carbon capture, green chemistry, and digital efficiency solutions through partnerships and funding.
Key Technological Shifts
- Rapid adoption of carbon capture, utilization, and storage (CCUS) technologies to reduce process-related COâ‚‚ emissions.
- Increasing use of electrification and renewable energy integration in chemical production processes.
- Shift toward green hydrogen and bio-based feedstocks as low-carbon alternatives to fossil-based inputs.
- Deployment of advanced catalysts and process optimization technologies to improve energy efficiency and lower emissions.
Market Report Scope
| Report Attribute | Details |
| Market Size and Volume in 2026 | USD 207.10 Billion / 71.82 million tons |
| Revenue Forecast in 2035 | USD 665.56 Billion / 350.13 million tons |
| Growth Rate | CAGR 13.85% |
| Forecast Period | 2026 - 2035 |
| Base Year | 2025 |
| Units Considered | Value (Billion / Million), Volume (Million tons) |
| Dominant Region | Asia Pacific |
| Segment Covered | By Technology Type, By Feedstock Origin, By Target Product Group By Regional |
| Key companies profiled | Carbon Clean, Aker Carbon Capture, LanzaTech, Twelve, Dioxide Materials, Monolith Inc., Nextchem, ANDRITZ, Siemens Energy, Topsoe, Terradot, Carbon Engineering and others. |
Value Chain Analysis
- Chemical Synthesis and Processing : Chemical synthesis and processing in the decarbonization are shifting toward low-emission production methods, energy-efficient reactors, and alternative feedstocks such as green hydrogen and bio-based inputs. Companies are redesigning processes to lower carbon intensity while maintaining output quality and scale.
- Key Players: BASF, Dow, Air Liquide, Air Products and Chemicals, thyssenkrupp Uhde, Linde
- Quality Testing and Certification : Quality testing and certification ensure that low-carbon chemicals meet safety, performance, and sustainability standards. As green chemicals and hydrogen gain adoption, independent verification of emissions, purity, and compliance has become increasingly important.
- Key Players: SGS, Bureau Veritas, Intertek Group, TÜV SÜD, TÜV Rheinland, DNV
- Distribution to Industrial Users : Distribution networks play a critical role in supplying decarbonized chemicals, industrial gases, and hydrogen to end-use industries. Efficient logistics, on-site supply models, and secure transport systems support large-scale industrial adoption.
- Key Players: Air Liquide, Linde, Air Products and Chemicals, Messer Group, Reliance Industries, Yingde Gases
Segmental Insights
By Technology Insights
What Made The CCUS Segment Dominate The Chemical Decarbonization Market In 2025?
The CCUS segment dominated the market with 37.34% share, driven by its strict environmental laws, expanding industrial carbon reduction goals, and its efficiency in reducing greenhouse gas emissions from chemical production processes, which are the main factors driving its widespread adoption. To meet sustainability targets, large-scale chemical producers in North America and the Asia Pacific still rely on CCUS.
")
The electrification technologies segment is expected to experience the fastest-growth in the market during the forecast period, as heat pumps, electric boilers, and electrified chemical reactors are becoming increasingly popular due to the global movement toward low-carbon processes and the integration of renewable energy. Government incentives and a growing industry emphasis on energy efficiency and lower emissions are driving the segment's growth.
Chemical Decarbonization Market Volume and Share, By Technology Type 2025-2035
| By Technology Type | Market Volume Share (%), 2025 | Market Volume (Million Tons)2025 | Market Volume (Million Tons)2035 | CAGR(%) 2026-2035 | Market Volume Share (%), 2035 |
| Carbon Capture, Utilization, and Storage (CCUS) | 37.34% | 22.49 | 116.35 | 20.04% | 33.23% |
| Electrification Technologies | 18.23% | 10.98 | 78.15 | 24.37% | 22.32% |
| Hydrogen Integration | 34.21% | 20.60 | 126.47 | 22.34% | 36.12% |
| Process Optimization | 10.22% | 6.16 | 29.17 | 18.87% | 8.33% |
By Feedstock Insights
Why Did The Bio-Based Feedstocks Segment Dominate The Chemical Decarbonization Market In 2025?
The bio-based feedstocks segment dominates the market with 64% share due to their sustainable sourcing of energy crops and agricultural residues, which lessen dependency on fossil fuels, while providing compatibility with current chemical production infrastructure, which is what makes them so popular. Consumer demand for more environmentally friendly products and corporate sustainability pledges also support this market segment, which is steadily gaining traction in the main chemical manufacturing regions.
The CO2-derived feedstocks segment is the fastest growing type in the market, as businesses look for novel ways to transform captured carbon into fueles chemicals, and other products with added value. This market is expanding rapidly due to the growing emphasis on carbon recycling and circular economy strategies. Government support for carbon-to-chemical technologies and partnerships between tech startups and chemical companies are speeding up development and opening new markets.
By Product Group Insights
What Made The Ammonia And Fertilizers Segment Dominate The Chemical Decarbonization Market In 2025?
The ammonia and fertilizers segment dominated the market with 37% share because of their established production methods and the ongoing demand for food production. The leadership of this sector is still supported by traditional manufacturing infrastructure. Long-term supply agreements with agricultural sectors and continuous investments in energy-efficient production techniques further solidify the market dominance and guarantee steady growth. The demand for ammonia and fertilizer products is further supported by the growing emphasis on sustainable agricultural practices.
The methanol and derivatives segment is expected to experience the fastest growth in the market during the forecast period, driven by their growing usage in carbon-neutral applications, green chemicals, and renewable fuels. This segment's adoption is being accelerated by developments in CO2 utilization and renewable methanol production. Additionally, growing demand for synthetic and bio-methanol as low-carbon substitutes is creating new market opportunities.
By Regional Insights
Why Did The Asia Pacific Region Dominate The Chemical Decarbonization Market In 2025?
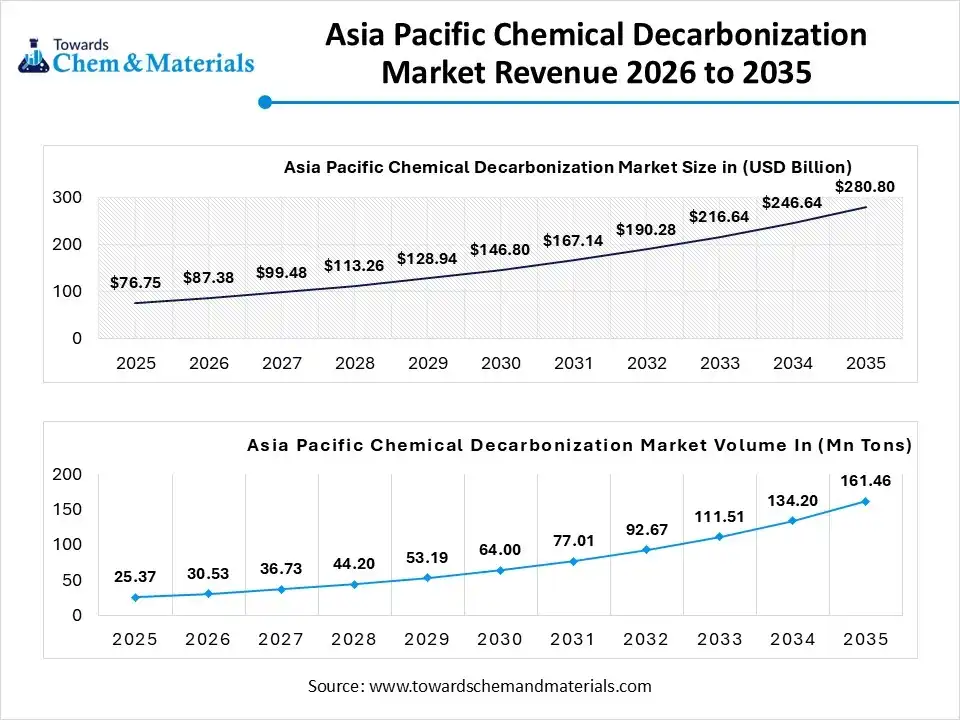
The Asia Pacific Chemical Decarbonization market size was valued at USD 76.75 billion in 2025 and is expected to be worth around USD 280.80 billion by 2035, exhibiting at a compound annual growth rate (CAGR) of 13.87% over the forecast period from 2026 to 2035. The Asia Pacific chemical decarbonization market volume is estimated at 25.37 million tons in 2025 and is projected to reach 161.46 million tons by 2035, growing at a CAGR of 20.33% from 2026 to 2035.

Why Did The Asia Pacific Region Dominate The Chemical Decarbonization Market In 2025?
Asia Pacific dominates the market with 42% share in 2025. The region's leadership is a result of rapid industrialization, a robust chemical manufacturing base, and government-led sustainability initiatives. Its market dominance is being further strengthened by significant investments in research infrastructure and the adoption of low-carbon technologies. Furthermore, robust demand from end-use industries like energy, fertilizers, and chemicals is accelerating regional growth.
India Chemical Decarbonization Market Trends
India is witnessing steady growth in the chemical decarbonization market, driven by governments growing emphasis on sustainability and growing industrial emissions. Chemical manufacturers are being encouraged to adopt low-carbon technologies by initiatives that support bio-based chemicals, green hydrogen, and energy-efficient manufacturing. Market expansion is further supported by rising investments in the integration of renewable energy sources.
Chemical Decarbonization Market Volume and Share, By Region 2025-2035
| By Region | Market Volume Share (%), 2025 | Market Volume (Million Tons)2025 | Market Volume (Million Tons)2035 | CAGR(%) 2026-2035 | Market Volume Share (%), 2035 |
| North America | 21.29% | 12.82 | 81.76 | 22.85% | 23.35% |
| Europe | 25.12% | 15.13 | 98.42 | 23.13% | 28.11% |
| Asia Pacific | 42.13% | 25.37 | 134.20 | 20.33% | 38.33% |
| South America | 3.23% | 1.95 | 10.85 | 21.05% | 3.10% |
| Middle East & Africa | 8.23% | 4.96 | 24.89 | 19.64% | 7.11% |
Europe Chemical Decarbonization Market Trends
Europe expects the fastest growth in the market during the forecast period, motivated by significant investments in renewable feedstocks, carbon taxation, and strict climate regulations. The emphasis on reaching net-zero emissions and decarbonization infrastructure is driving market expansion throughout European countries. Innovation in low-carbon technologies is fueled by partnerships between government, business, and academic institutions. It is anticipated that incentives to produce green chemicals and the integration of renewable energy sources will support the region's rapid market expansion.
Germany Chemical Decarbonization Market Trends
Germany plays a pivotal role in Europe’s chemical decarbonization efforts, backed by sophisticated industrial infrastructure and robust regulatory frameworks. To meet aggressive climate targets, the nation is actively investing in CCUS, electrifying chemical processes, and green feedstocks. Innovation is accelerated by cooperation between research institutions and chemical companies.
")
North America Chemical Decarbonization Market Trends
North America is witnessing the growing adoption in the chemical decarbonization market, driven by robust industrial capability and the early adoption of cutting-edge technologies. Investments in CCUS and low-carbon feedstocks are being driven by growing pressure to reduce carbon emissions and the presence of large chemical manufacturers. Funding and policy support for clean technologies enhance regional development even more.
U.S. Chemical Decarbonization Market Trends
The U.S. is gradually increasing its use in the chemical decarbonization market because of increasing corporate sustainability commitments and strict emission regulations. Chemical firms are being encouraged to switch to low-emission production methods by federal incentives for carbon capture, clean energy, and sustainable manufacturing. One of the main forces behind growth is still technological innovation.
MEA Chemical Decarbonization Market Trends
MEA is seeing rising demand for the chemical decarbonization market, encouraged by diversification initiatives to reduce reliance on fossil fuels. Carbon capture, hydrogen, and low-carbon ammonia projects are seeing an increase in investment. Long-term market development is being aided by rising environmental sustainability awareness.
UAE Chemical Decarbonization Market Trends
The UAE is emerging as a key market within the MEA, supported by investments in clean technologies and government-led sustainability initiatives. The nation is concentrating on CCUS green hydrogen and low-carbon chemicals to cut emissions from its energy and chemical industries. Strategic alliances are speeding up the implementation of projects.
South America Chemical Decarbonization Market Trends
South America’s chemical decarbonization market is gaining traction due to increasing environmental regulations and the availability of bio-based feedstocks. Countries in the region are leveraging agricultural resources to promote sustainable chemical production. Gradual industrial modernization is supporting the adoption of low-carbon solutions.
Brazil Chemical Decarbonization Market Trends
Brazil stands out in South America due to its robust bio-based economy and availability of renewable feedstock. To lower carbon intensity, the nation's chemical industry is progressively implementing bio-based and energy-efficient procedures. The market is expanding due to government support for sustainable manufacturing and renewable energy.
Recent Developments
- In November 2025, BASF and ExxonMobil announced a joint development agreement to advance methane pyrolysis technology, aiming to produce low-emission hydrogen and solid carbon. The partnership plans to build a demonstration plant at ExxonMobil's Baytown Complex in Texas with an annual production target of 2,000 tons of hydrogen and 6,000 tons of high-purity solid carbon. (Source: https://www.basf.com )
- In May 2025, ExxonMobil and Marubeni Corporation finalized an agreement to supply 250,000 metric tons of low-carbon ammonia annually from Texas to Japan. Marubeni will also take an equity stake in the project, which utilizes carbon capture to create a large-scale clean fuel supply chain for the chemical and power industrie (Source: https://www.chemicaltoday.in)
Market Top Companies
- BASF (Germany): Launched Germany’s largest electrolyzer in 2025 to produce green hydrogen for zero-carbon manufacturing.
- Dow (US): Building the world’s first net-zero carbon emissions ethylene cracker complex in Canada.
- SABIC (Saudi Arabia): Pioneering the use of electric-heated steam crackers to drastically reduce industrial CO2 emissions.
- LG Chem (South Korea): Started construction on South Korea's first HVO plant in 2025 to produce sustainable chemical feedstocks and biofuels.
- Carbon Clean
- Aker Carbon Capture
- LanzaTech
- Twelve
- Dioxide Materials
- Monolith Inc.
- Nextchem
- ANDRITZ
- Siemens Energy
- Topsoe
- Terradot
- Carbon Engineering
Segments Covered in the Report
By Technology Type
- Carbon Capture, Utilization, and Storage (CCUS)
- Post-combustion Capture
- Pre-combustion Capture
- Oxy-fuel Combustion
- Carbon Utilization (CO2-to-Chemicals)
- Electrification Technologies
- Electric Steam Crackers
- Industrial Heat Pumps
- Electric Boilers and Furnaces
- Plasma-based Heating
- Hydrogen Integration
- Green Hydrogen (Electrolysis)
- Blue Hydrogen (SMR/ATR with CCS)
- Process Optimization
- Advanced Catalysis
- Digital Twin & AI Efficiency Systems
- Waste Heat Recovery
By Feedstock Origin
- Bio-based Feedstocks
- First-generation (Food-based)
- Second-generation (Lignocellulosic)
- Circular/Recycled Feedstocks
- Pyrolysis Oil (Chemical Recycling)
- Monomer Recovery
- CO2-derived Feedstocks
- Power-to-Methanol
- Power-to-Olefins
By Target Product Group
- High-Value Chemicals (HVCs)
- Ethylene
- Propylene
- Butadiene
- Benzene/Toluene/Xylenes (BTX)
- Ammonia and Fertilizers
- Methanol and Derivatives
- Polymers and Plastics
- Polyethylene (PE)
- Polypropylene (PP)
- Polyvinyl Chloride (PVC)
- Polyethylene Terephthalate (PET)
- Inorganic Chemicals
- Chlor-Alkali
- Soda Ash
By Regional
- North America
- U.S.
- Canada
- Mexico
- Europe
- Germany
- UK
- France
- Asia Pacific
- China
- Japan
- India
- South Korea
- Australia
- South America
- Brazil
- Middle East and Africa (MEA)
- Kingdom of Saudi Arabia
- UAE
- South Africa
Select User License to Buy
Figures (4)