
Asia Pacific Nitrogenous Fertilizer Market Size Analysis Report 2035
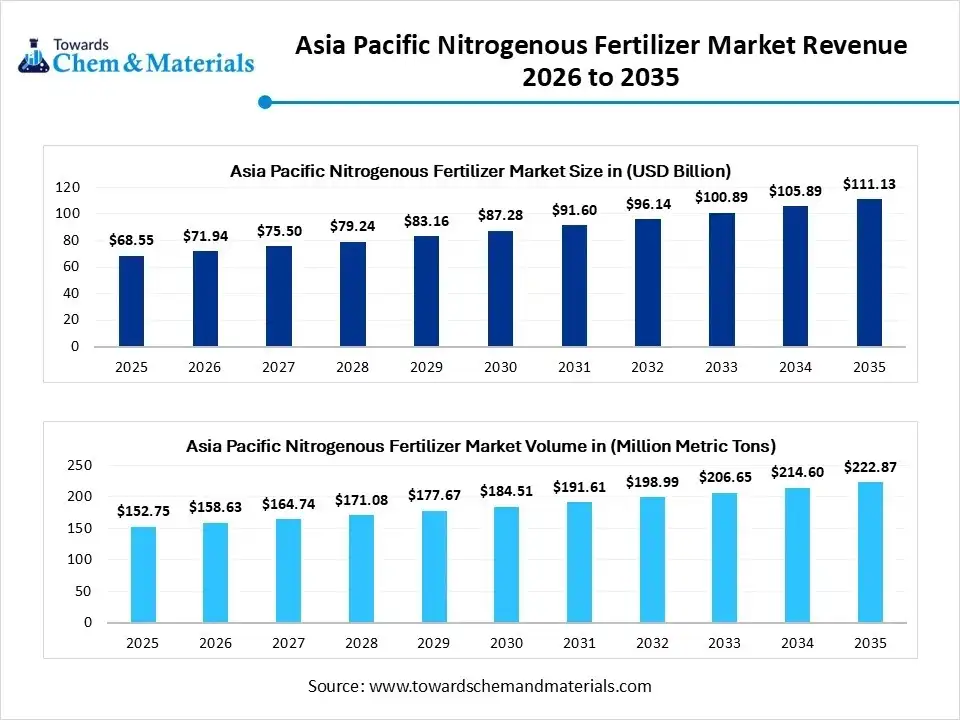
The Asia Pacific nitrogenous fertilizer market size was valued at USD 68.55 billion in 2025, is estimated to reach USD 71.94 billion in 2026, and is projected to reach USD 111.13 billion by 2035, growing at a CAGR of 4.95% from 2026 to 2035 In terms of volume, the market is projected to grow from 152.75 million metric tons in 2025 to 222.87 million metric tons by 2035. growing at a CAGR of 3.85% from 2026 to 2035. The growing food production and adoption of modern farming practices drive the market growth.
Key Takeaways
- China dominated the Asia Pacific nitrogenous fertilizer market with a 47% share in 2025
- India is growing at a 6.14% CAGR in the market during the forecast period.
- By product, the urea segment held a 40% share in the market in 2025.
- By product, the specialty nitrogen segment is expected to grow at a 6.11% CAGR in the market during the forecast period.
- By physical form, the granular or prilled segment held a 38.43% share in the market in 2025.
- By physical form, the liquid segment is expected to grow at a 5.88% CAGR in the market during the forecast period.
- By application, the cereals & grains segment held a 37.79% share in the market in 2025.
- By application, the fruits & vegetables and horticulture segment is expected to grow at a 5.92% CAGR in the market during the forecast period.
- By technology, the conventional nitrogen fertilizers segment held a 41.54% share in the Asia Pacific nitrogenous fertilizer market in 2025.
- By technology, the controlled-release or stabilized nitrogen fertilizers segment is expected to grow at a 6.07% CAGR in the market during the forecast period.
Market Size and Volume Forecast
- Market Estimated Size (2025): USD 68.55 Billion | CAGR (2026–2035): 4.95%
- Market Projected Size (2035): USD 111.13 Billion
- Market Volume (2025): 152.75 Million Metric Tons | Volume CAGR (2026–2035): 3.85%
- Market Projected Volume (2035): 222.87 Million Metric Tons
- Market Pricing (2025):
- Average Manufacturing Price: USD 219/MT
- Average Selling Price: USD 295/MT
- Pricing CAGR (2025–2035): 2.11%
Agri Pulse Asia Pacific: The Nitrogenous Fertilizer Growth Factors
Asia Pacific nitrogenous fertilizer market growth is driven by a growing population, decreasing arable land, shift towards modern farming practices, a strong focus on food security, increasing soil deficiencies, and growing export of agricultural products.
What is Nitrogenous Fertilizer?
Nitrogenous fertilizer provides nitrogen to the soil for higher yield production and plant growth. It is available in solid, liquid, prilled, granular, suspension, and powder form. Nitrogenous fertilizers offer benefits like maintaining soil fertility, boosting plant growth, and improving crop quality. The diverse types of nitrogenous fertilizers are nitrate, amide, ammoniacal, organic, and ammoniacal nitrate.
Asia Pacific Nitrogenous Fertilizer Market Outlook:
- Industry Growth Overview: Between 2025 and 2034, the industry is expected to see accelerated growth in high-margin niches such as precision farming, high crop production, and sustainable agriculture. Growth is being reinforced by limited arable land and a strong focus on food security, particularly in China and India.
- Sustainability Trends: Sustainability is transforming the Asia Pacific nitrogenous fertilizer landscape, with growing production of green ammonia, adoption of precision agriculture, and development of bio-fertilizers. For instance, the Indian Farmers Fertiliser Cooperative Limited company produces a diverse range of biofertilizers.
- Major Investors: Domestic Companies and International Corporations are actively entering the space, drawn by the development of higher crop yields and growing demand for food. Companies like Sinofert Holdings Limited, National
- Fertilizers Limited, Coromandel International, and Yara International are heavily investing in nitrogenous fertilizers.
Report Scope
| Report Attributes | Details |
| Market Size and Volume in 2026 | USD 71.94 Billion / 158.63 Million Metric Tons |
| Expected Size and Volume by 2035 | USD 111.13 Billion / 222.87 Million Metric Tons |
| Growth Rate from 2025 to 2035 | CAGR 4.95% |
| Base Year of Estimation | 2025 |
| Forecast Period | 2025 - 2035 |
| Segment Covered | By Product Type, By Physical Form, By Application, By Technology |
| Key Companies Profiled | Yara International ASA , Nutrien Ltd. , CF Industries Holdings, Inc. , EuroChem Group, OCI N.V. , SABIC Agri-Nutrients Company, Coromandel International Ltd., Indian Farmers Fertiliser Cooperative Limited (IFFCO), National Fertilizers Limited, Chambal Fertilisers and Chemicals Ltd., PT Pupuk Indonesia, Haifa Group, The Mosaic Company, Lotte Fine Chemical |
Key Technological Shifts in the Asia Pacific Nitrogenous Fertilizer Market:
The Asia Pacific nitrogenous fertilizer market is undergoing key technological shifts driven by the demand for improving nutrient uptake, increasing crop yields, and lowering environmental impact. One of the most significant transformations is the development of nano-fertilizers, which enhance fertilizer efficiency and increase crop quality. Nano-fertilizers enhance the uptake of nutrients in plant leaves & roots. It lowers application rates and offers slow-release & controlled-release of fertilizers.
- For instance, the Indian Farmers Fertiliser Cooperative Limited manufactures nitrogenous nano-fertilizer like IFFCO Nano Urea Liquid.
Trade Analysis of the Asia Pacific Nitrogenous Fertilizer Market: Import & Export Statistics
- China exported $5.05B of nitrogenous fertilizers in 2023.(Source: oec.world )
- India imported $3.85B of nitrogenous fertilizers in 2023.(Source: oec.world)
- China imported $23.2M of nitrogenous fertilizers in 2024.(Source: oec.world )
- Malaysia exported 7,995 shipments of urea.(Source: www.volza.com )
- China exported 11,670 shipments of ammonium sulphate.(Source: www.volza.com)
Asia Pacific Nitrogenous Fertilizer Market Value Chain Analysis
- Feedstock Procurement : The feedstock procurement involves the sourcing of feedstocks like naphtha, natural gas, nitrogen gas, coal, ammonia, and carbon dioxide.
- Key Players: IFFCO, Coromandel International Limited, Gujarat State Fertilizers and Chemicals Limited.
- Chemical Synthesis and Processing : The chemical synthesis and processing involve the haber-bosch process to manufacture diverse nitrogenous fertilizers.
- Key Players: National Fertilizers Limited, Rashtriya Chemicals and Fertilizers, IFFCO, China BlueChemical Ltd., Yara International ASA
- Quality Testing and Certifications : The quality testing involves testing of properties like nutrient content, moisture, granule hardness, contaminant testing, biuret content, particle size, & pH value, and certifications like the Fertilizer Control Act, ISO, & Fertiliser Regulation 1997.
Feeding the Green: Deep Spectrum into Nitrogenous Fertilizer Types
| Fertilizer | Solubility | Use | Soil Reaction | Suitability for Crops |
| Urea | High |
|
Slightly Acidic |
|
| Ammonium Nitrate | High |
|
Neutral |
|
| Ammonium Sulfate | Moderate |
|
Acidifying |
|
| Calcium Nitrate | High |
|
Alkaline |
|
Segmental Insights
Product Type Insights
Why the Urea Segment Dominates the Asia Pacific Nitrogenous Fertilizer Market?
The urea segment dominated the Asia Pacific nitrogenous fertilizer market with a 40% share in 2025. The growing production of higher crop yields and the increasing need for food increase the adoption of urea. The increasing modern farming practices and growing cultivation of crops like wheat, rice, & maize require urea. The lower cost of urea and the need for high nitrogen concentration drive the overall growth of the market.
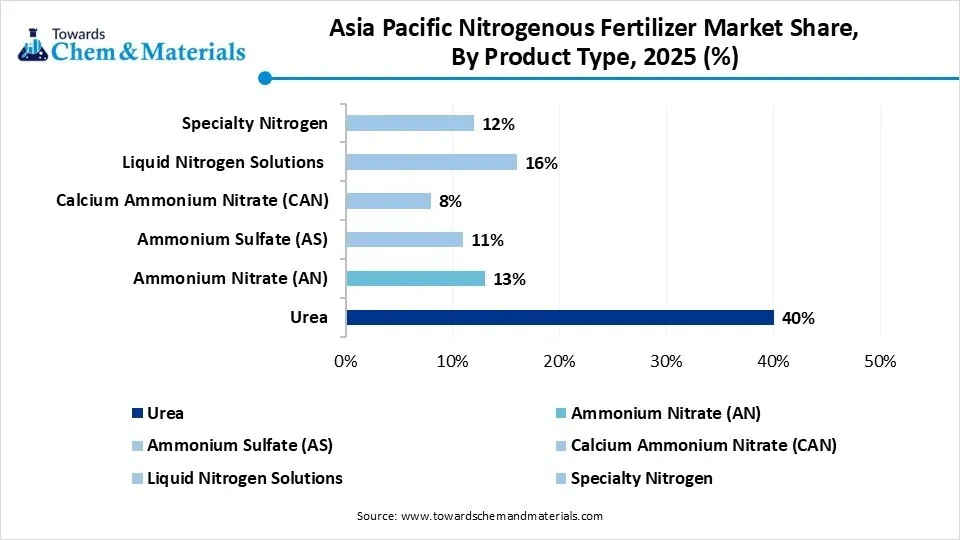 The specialty nitrogen segment is growing at a 6.11% CAGR in the market during the forecast period. The strong focus on boosting crop quality and a rise in sustainable agriculture practices increase the adoption of specialty nitrogen. The adoption of precision farming practices and the development of higher crop yields require specialty nitrogen. The growing cultivation of vegetables & fruits requires specialty nitrogen, supporting the overall market growth.
Additionally, the ammonium nitrate segment is significantly growing in the market. The growing agricultural practices and growing demand for food require ammonium nitrate. The increasing cultivation of barley, maize, & wheat and the adoption of precision agriculture require ammonium nitrate. The strong focus on enhancing food security and increasing intensive farming of oilseed & cereal requires ammonium nitrate, driving the overall market growth.
Asia Pacific Nitrogenous Fertilizer Market Share, By Product Type, 2025 (%)
| By Product Type | Revenue Share, 2025 (%) |
| Urea | 40% |
| Ammonium Nitrate (AN) | 13% |
| Ammonium Sulfate (AS) | 11% |
| Calcium Ammonium Nitrate (CAN) | 8% |
| Liquid Nitrogen Solutions | 16% |
| Specialty Nitrogen | 12% |
Physical Form Insights
How did Granular or Prilled Segment Hold the Largest Share in the Asia Pacific Nitrogenous Fertilizer Market?
- The granular or prilled segment held the largest revenue share of 38.43% in the Asia Pacific nitrogenous fertilizer market in 2025,The strong focus on efficient nutrient delivery and ease of handling increases the adoption of the granular or prilled form. The stability of granular form during degradation, caking, and dusting helps market growth. The growing cultivation of wheat & rice and focus on quick nutrient release requires a granular form, driving the overall market growth.
- The liquid segment is growing at a 5.88% CAGR in the market during the forecast period. The rise in precision agricultural practices and focus on lowering environmental impact increases demand for the liquid form. The strong focus on faster absorption and high compatibility with different crop protection products requires a liquid form. The diverse application methods, like foliar sprays & drip irrigation, support the overall market growth.
- Furthermore, the powder or crystalline segment is growing significantly in the market. The strong focus on targeted nutrient delivery and the production of higher crop yields requires powder or crystalline form. The strong focus on lowering nutrient loss and the effective absorption of fertilizers requires powder or crystalline form. The availability of foliar feeding and fertigation applications drives the overall market growth.
Asia Pacific Nitrogenous Fertilizer Market Share, Physical Form Insights, 2025 (%)
| Physical Form Insights | Revenue Share, 2025 (%) |
| Granular / Prilled | 38.43% |
| Liquid (UAN / Foliar Solutions) | 24.57% |
| Powder / Crystalline | 21.00% |
| Suspension | 16.00% |
Application Insights
Which Application Dominated the Asia Pacific Nitrogenous Fertilizer Market?
- The cereals & grains segment dominated the Asia Pacific nitrogenous fertilizer market with a 37.79% share in 2025. The high consumption of staple foods and the presence of large cultivation areas increase demand for cereals & grains. The increased cultivation of corn, rice, & wheat and the adoption of modern practices require nitrogenous fertilizers. The high cultivation of cereals & grains and a strong focus on food security drive the overall market growth.
- The fruits & vegetables or horticulture segment is growing in the market during the forecast period. The high consumption of nutritious vegetables & fruits and changing dietary preferences increase demand for nitrogenous fertilizers. The rise in the cultivation of fruits & vegetables and the focus on improving crop yields require nitrogenous fertilizers. The strong government support to produce fruits & vegetables supports the overall market growth.
- The oilseeds & pulses segment is significantly growing in the market. The growing need for minerals, protein, and vitamins increases demand for oilseeds & pulses. The growing demand for food and increasing need for edible oils requires oilseeds & pulses. The strong focus on optimizing plant growth and the rise in the cultivation of soybean & mustard drives the overall market growth.
Asia Pacific Nitrogenous Fertilizer Market Share, By Application, 2025 (%)
| By Application | Revenue Share, 2025 (%) |
| Cereals & Grains | 37.79% |
| Oilseeds & Pulses | 18.50% |
| Fruits & Vegetables | 16.75% |
| Plantation Crops | 13.00% |
| Horticulture & Floriculture | 13.96% |
Technology Insights
Why does the Conventional Nitrogen Fertilizers Segment hold the Largest Share in the Asia Pacific Nitrogenous Fertilizer Market?
- The conventional nitrogen fertilizers segment held the largest revenue share of 41.54% in the Asia Pacific nitrogenous fertilizer market in 2025. The growing cultivation of staple crops and a strong focus on food security increase demand for conventional nitrogen fertilizers. The cheaper price and ease of production help market growth. The increased maximization of crop yields and the need for high nitrogen content require conventional nitrogen fertilizers, driving the overall market growth.
- The controlled-release or stabilized nitrogen fertilizers segment is growing at a 6.07% CAGR in the market during the forecast period. The strong focus on lowering nitrogen loss and improving nutrient efficiency increases demand for controlled-release fertilizers. The growing cultivation of higher crop yields and adoption of sustainable agriculture requires stabilized nitrogen fertilizers. The growing cultivation of high-value ornamentals, crops, & turf supports the overall market growth.
- Additionally, the blended or complex NPK segment is growing significantly in the market. The growing production of higher crop yields, specialty crops, and fruits increases demand for complex NPK. The focus on improving the nutrient delivery of crops and the rise in precision agriculture require blended NPK. The growing expansion of horticulture and the rising demand for food require blended NPK, supporting the overall market growth.
Asia Pacific Nitrogenous Fertilizer Market share , By Technology, 2025(%)
| By Technology | Revenue Share, 2025 (%) |
| Conventional Nitrogen Fertilizers | 41.54% |
| Blended / Complex NPK (High N Content) | 23.18% |
| Controlled-Release / Polymer-Coated Nitrogen | 15.37% |
| Stabilized / Nitrification-Inhibitor Nitrogen | 10.25% |
| Bio-Enhanced Nitrogen Fertilizers | 9.66% |
Country-Level Insights
From Coal to Crops: China’s Nitrogenous Fertilizer Grip on the Asia Pacific
- China dominated the Asia Pacific nitrogenous fertilizer market with a 47% share in 2025. The growing cultivation of staple crops like corn, rice, and wheat increases demand for nitrogenous fertilizers. The presence of vast agricultural land and the increasing demand for food require nitrogenous fertilizers. The strong focus on food security and growing adoption of modern agricultural practices increase demand for nitrogenous fertilizers.
- The well-established fertilizer production base drives the overall market growth.
- China exported $2.85B of nitrogenous fertilizers in 2024.(Source: oec.world)
From Soil to Supply: India’s Rising Influence in the Nitrogenous Fertilizer
India is growing at a 6.4% CAGR in the market during the forecast period. The growing population and higher demand for food require nitrogenous fertilizers. The rise in modern agricultural practices and a strong focus on food security increases the adoption of nitrogenous fertilizers. The increasing cultivation of oilseeds, cereals, and grains requires nitrogenous fertilizers. The expansion of the agriculture sector and a strong focus on precision agriculture require nitrogenous fertilizers, supporting the overall market growth.
- India exported $48.2M of nitrogenous fertilizers in 2023.(Source: oec.world)
- From June 2024 to May 2025, India exported 447 shipments of urea with a growth rate of 80% compared to the previous 12 months.(Source: www.volza.com)
Japan Strengthening Nitrogenous Fertilizer Growth for a Sustainable Future
Japan is a key contributor to the Asia Pacific nitrogenous fertilizer market. The presence of advanced agricultural practices and a strong focus on boosting crop yields increases demand for nitrogenous fertilizer. The strong government support for the agricultural industry and adoption of precision agriculture requires nitrogenous fertilizers. The expansion of greenhouse agriculture and growing horticulture requires nitrogenous fertilizers, driving the overall market growth.
Recent Developments
- In February 2025, Wilbur-Ellis launched an organic nitrogen fertilizer, BenVireo TerraLux 10-0-0. The fertilizer lowers greenhouse gas emissions and supports sustainable agriculture practices.(Source: www.growingproduce.com)
- In February 2025, FFC launched Sona Urea Zinc Coated fertilizer. The fertilizer consists of 1% zinc and 42% nitrogen. The fertilizer enhances soil efficiency and uniformly distributes zinc in the soil.(Source: tradechronicle.com)
- In November 2024, the NFL launched nano urea production at the Nangal plant. The daily production capacity is 1.5 lakh bottles of 500 ml. The nano urea enhances soil health and improves the absorption of nutrients in crops. (Source: chemindigest.com)
Top Companies List
Sinofert Holdings Limited
Corporate Information
- Name: Sinofert Holdings Limited.
- Stock listing: Hong Kong Stock Exchange (HK: 0297).
- Headquarters: Hong Kong registered (Bermuda incorporated) investment holding company, with key operations in Mainland China.
- Controlling shareholder: Sinochem Group (through its subsidiary structure) holds the majority stake.
History and Background
- Sinofert traces its roots to the fertilizer business of Sinochem, and was established (or reorganized) in the early 1990s (1993/94) and listed on HKEx in 2005.
- It has grown into one of China’s largest integrated fertilizer companies, covering upstream (resource procurement/mining), manufacturing, and downstream (distribution & services) segments.
Key Developments and Strategic Initiatives
- Shift towards differentiation & innovation: In its 2022 results, Sinofert highlighted that it increased sales of differentiated products (bio fertilizers, new type phosphate, compound fertilizers) by ~31 % YoY.
- Implementation of a “Bio+ / Soil Health / Nutrientâ€Efficiency” strategy: The company is emphasizing soil health, microbial/biofertiliser products, reducing conventional inputs while raising crop yields.
Mergers & Acquisitions
- In 2012 (or around then) Sinofert acquired Xundian Lomon Phosphorus Chemical Co (a phosphate mining firm in Yunnan) for ~$218.7 million, to bolster its upstream phosphate resource base.
- Strategic investment/licensing: e.g., earlier stake by PotashCorp in Sinofert
Partnerships & Collaborations
- Longâ€term supply/partnership with potash producers such as Canpotex for China market supply.
- Collaboration with research institutions (e.g., Chinese Academy of Agricultural Sciences) and national engineering centres for soil/land protection and new fertilizer tech.
- Product Launches / Innovations
- The company highlights launches of “bio fertilizers + soil health” oriented products: in 2022, sales of bio fertilisers increased ~73 % YoY to ~600,000 tons.
- Advanced products: slowâ€release fertilizers, nitrification inhibitors (source suggests development in that space).
Key Technology Focus Areas
- Nutrient efficiency: improving how fertilizers are taken up by plants, reducing waste, increasing yield per unit input.
- Soil health: microbiome, biological agents, “bio fertilizer” concepts to restore or maintain soil fertility.
- Digitalisation & distribution technology: mobile apps for sales, CRM, logistics to remote farmers; supply chain optimisation.
R&D Organisation & Investment
- The company has established R&D platforms such as the “National Engineering Research Centre for Farmland Protection” in partnership with CAAS.
- From the 2023 Annual Report: hiring chief scientists from top universities to improve plant physiology, molecular biology, synthetic biology capabilities.
SWOT Analysis
Strengths
- Strong market position in China: major integrated fertilizer company with upstream, manufacturing, distribution and retail capabilities.
- Extensive distribution and network reach across China’s arable land (often cited ~95 % coverage).
Strategic resource control: mining, procurement, partnerships for potash/phosphate giving supply security.
Product diversification beyond basic fertilizers: compound, bio, slowâ€release, special fertilizers.
Weaknesses
- Heavy reliance on the Chinese domestic market: exposure to Chinese agricultural policy/regulation risk, commodity price swings.
- Traditional fertilizer business exposed to cyclical commodity pricing and raw material cost volatility.
- Transformation into “bio/soil health” segment may require significant capital and time to scale; risk of slower adoption in traditional farming segments.
Opportunities
- Growth in higherâ€value differentiated products (biofertilizers, controlledâ€release, soil health) instead of commodity bulk fertilizers.
- Digitalisation and serviceâ€based agriculture (farmer advisory, precision agriculture) can open new revenue streams.
- Expansion beyond China into Asia Pacific or emerging markets with growing fertilizer demand (though evidence of international focus is still developing).
Threats
- Intense competition from local and global players in China and internationally; margin pressure in commodity segments.
- Raw material import risk (e.g., potash price increases, logistics disruptions, trade policy).
- Environmental/ regulatory risk: fertilizer over use, soil/groundwater degradation risks, government policy may favour environmentâ€friendly products thereby penalising older high nitrogen/ high phosphate models.
- Currency / commodity cost cycles and global macro factors (e.g., energy cost hikes affecting fertilizer manufacturing).
Recent News & Strategic Updates
- In 2025 Q1: Reported turnover ~RMB 7,167 million and net profit RMB 519 million, up ~4 % from same period 2024, citing the “Bio+” strategic transformation and spring farming support.
- May 2025: Secured an Information System Services Agreement with Sinochem Information for 2025 an effort to enhance operational efficiency.
- Yara International ASA: The Norwegian-based company supplies & produces nitrogen-based fertilizers, services, and digital tools for sustainable agriculture.
- Nutrien Ltd.: The Canadian-based company offers a diverse range of nitrogen-based products like nitrates, ammonia, and urea for precision & sustainable agricultural practices.
- CF Industries Holdings, Inc.: The global distributor and manufacturer of nitrogen-based fertilizers for industrial and agricultural applications.
- EuroChem Group: The global manufacturer of potash, nitrogen, and phosphate fertilizer to support sustainable agriculture.
- OCI N.V.: The global distributor and producer of nitrogen fertilizers like calcium ammonium nitrate, ammonia, and urea to support the agricultural industry.
- SABIC Agri-Nutrients Company
- Coromandel International Ltd.
- Indian Farmers Fertiliser Cooperative Limited (IFFCO)
- National Fertilizers Limited
- Chambal Fertilisers and Chemicals Ltd.
- PT Pupuk Indonesia
- Haifa Group
- The Mosaic Company
- Lotte Fine Chemical
Segments Covered
By Product Type
- Urea
- Ammonium Nitrate (AN)
- Ammonium Sulfate (AS)
- Calcium Ammonium Nitrate (CAN)
- Liquid Nitrogen Solutions (UAN, Ammonium Nitrate Solutions)
- Specialty Nitrogen (Controlled-Release, Slow-Release, Stabilized Nitrogen)
By Physical Form
- Granular / Prilled
- Liquid (UAN / Foliar Solutions)
- Powder / Crystalline
- Suspension
By Application
- Cereals & Grains (Rice, Wheat, Maize)
- Oilseeds & Pulses
- Fruits & Vegetables
- Plantation Crops (Tea, Rubber, Sugarcane)
- Horticulture & Floriculture
By Technology
- Conventional Nitrogen Fertilizers
- Blended / Complex NPK (High N Content)
- Controlled-Release / Polymer-Coated Nitrogen
- Stabilized / Nitrification-Inhibitor Nitrogen
- Bio-Enhanced Nitrogen Fertilizers
A Seven-Phase Framework
Our methodology is designed to be universally applicable across commodity chemicals, specialty chemicals, petrochemicals, construction chemicals, coatings, electronic chemicals, industrial gases, agrochemicals, water treatment chemicals, and performance materials. Each phase builds upon the last, creating a layered validation structure that minimizes estimation error and maximizes analytical confidence.
The framework ensures comprehensive market coverage, robust cross-validation, and reliable long-term forecasting — producing market estimates that withstand scrutiny from investors, regulators, and corporate strategy teams.

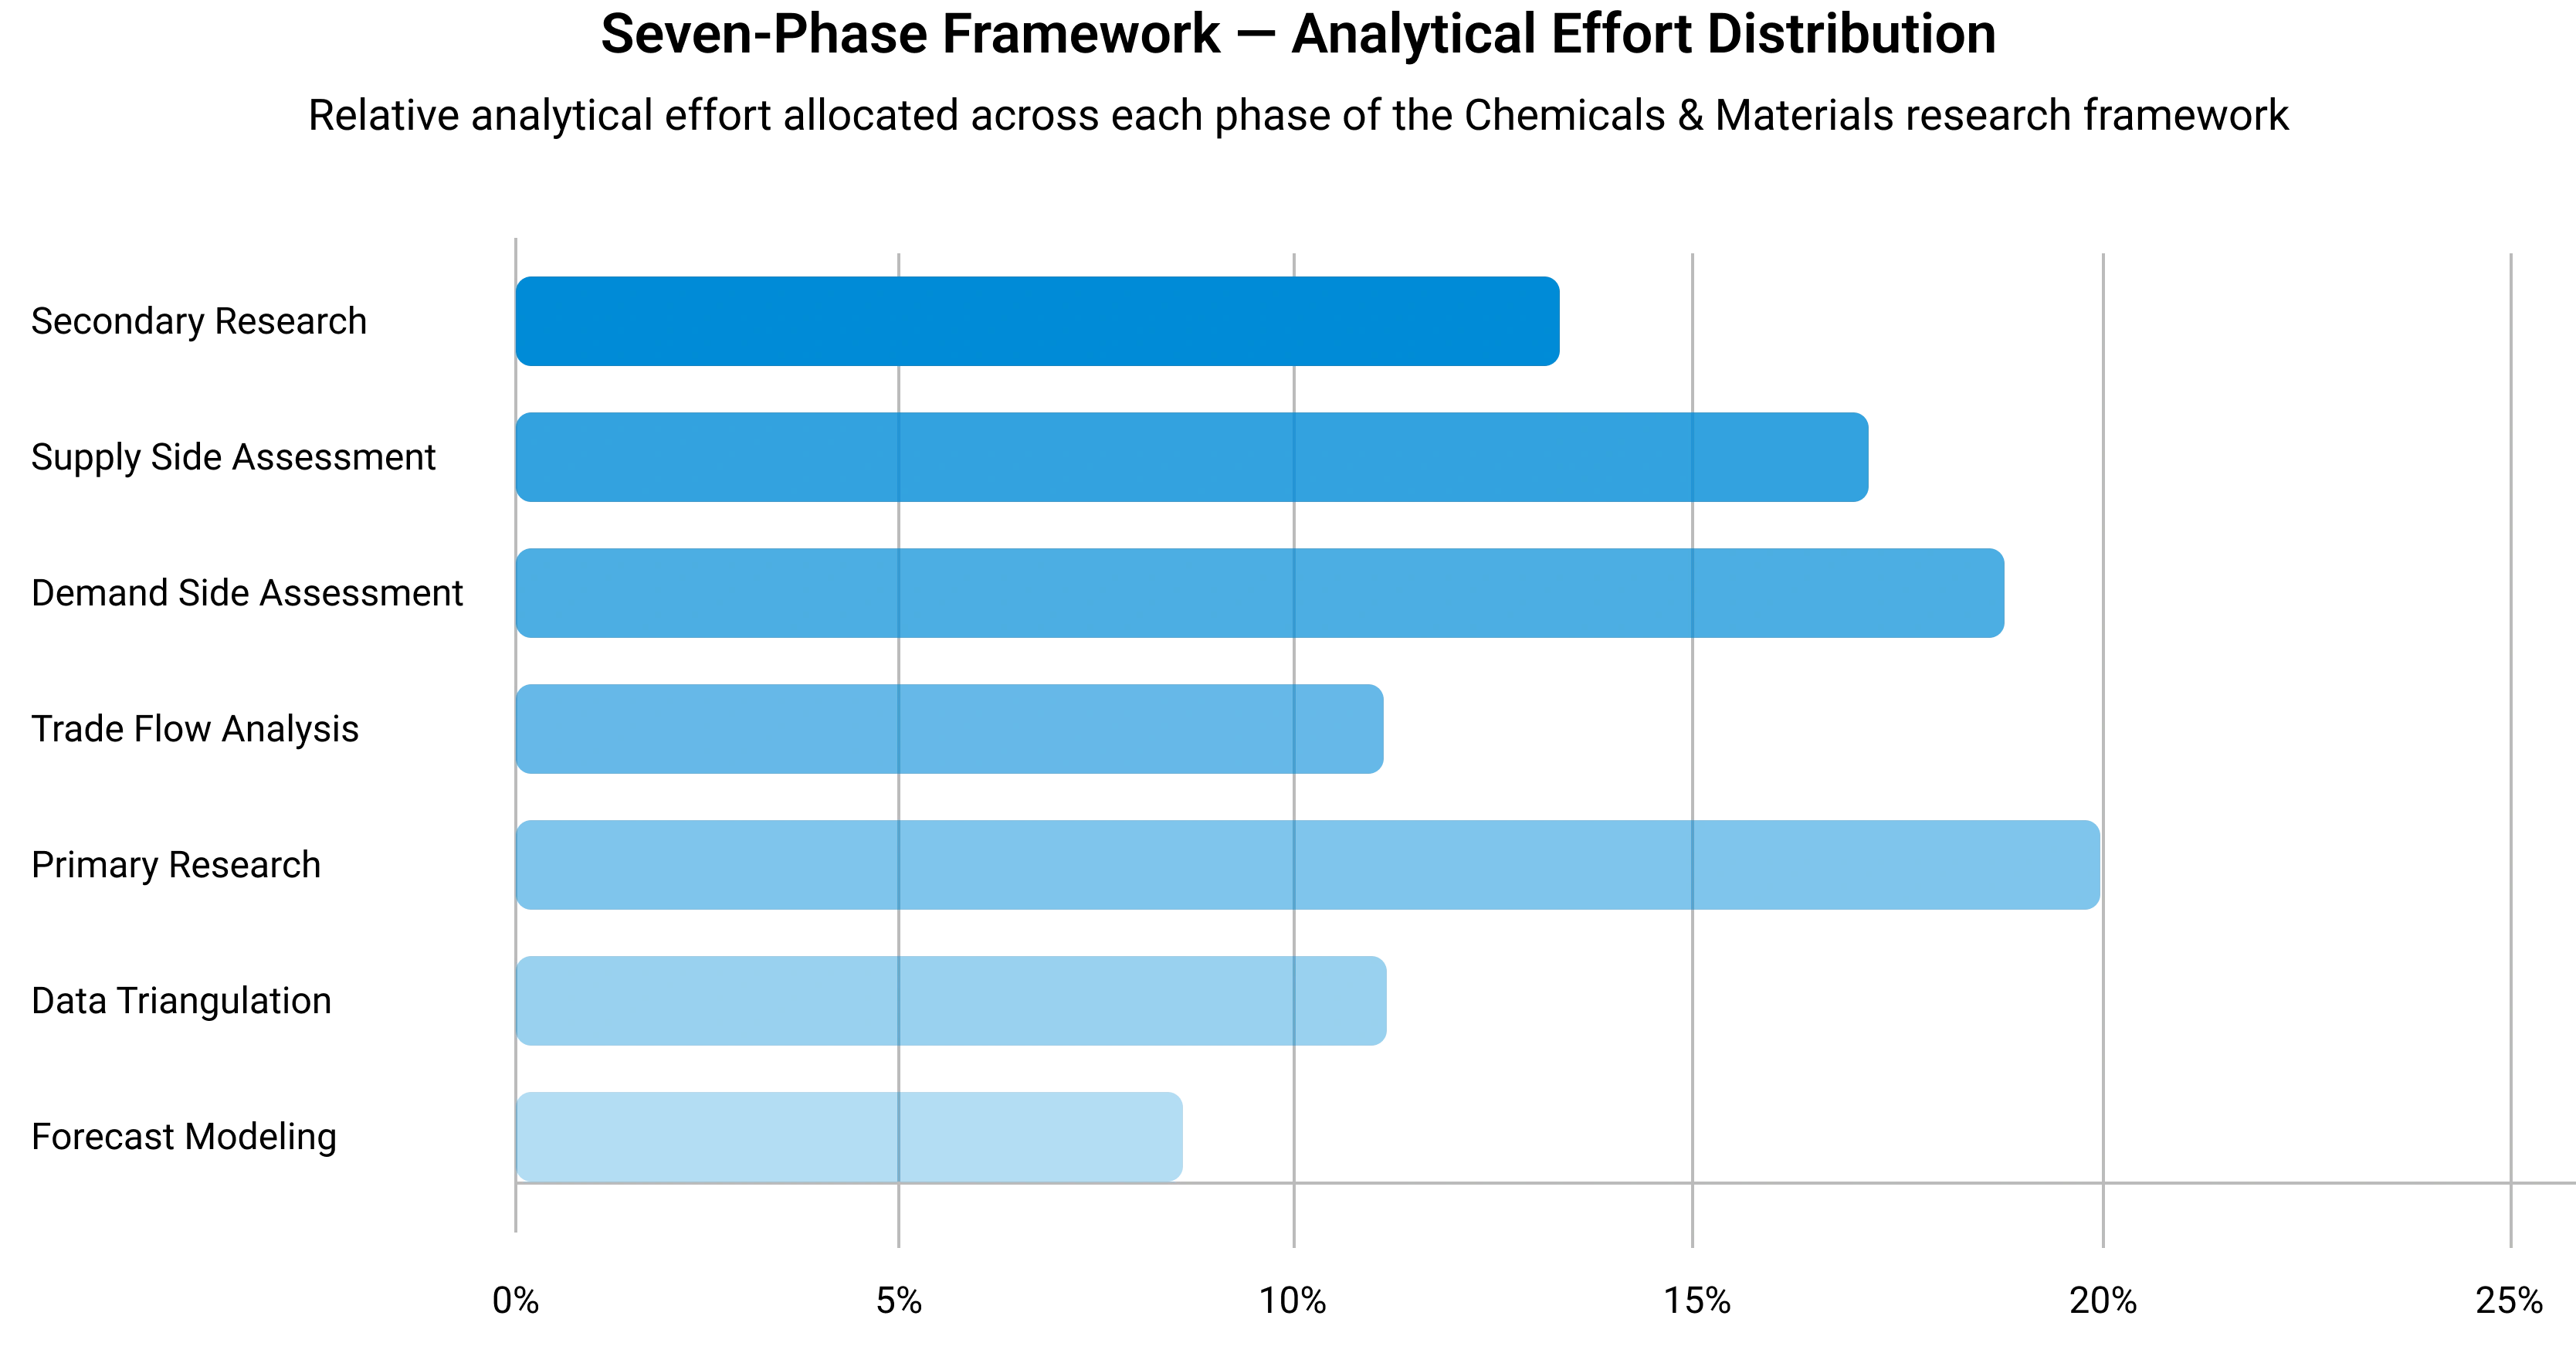
Seven-Phase Framework — Analytical Effort Distribution
Relative analytical effort allocated across each phase of the Chemicals & Materials research framework
Phase 1 - Secondary Research: Establishing the Foundation
Secondary research collects and evaluates publicly available information from authoritative sources, establishing the foundational understanding of market structure, value chain dynamics, competitive landscape, and end-use demand patterns. Every source is evaluated for credibility, recency, geographic relevance, and methodological soundness before inclusion.
Industry Associations
Sources include ACC, CEFIC, ICCA, JCIA, CPCIF, and SOCMA providing production volumes, consumption trends, capacity developments, and sustainability initiatives.
Company Disclosures
Annual reports, investor presentations, earnings transcripts, and regulatory filings reveal product portfolios, manufacturing footprints, capacity expansions, and revenue segmentation.
Government Databases
National statistical offices, customs authorities, environmental agencies, and industrial production databases provide verified statistics on output, trade flows, and regulatory compliance.
Trade Databases
UN Comtrade, ITC, Eurostat, and national customs authorities enable assessment of global product movement, import dependency, and export competitiveness across regions.
Our Secondary Research Sources
- Ministry of Chemicals and Fertilizers
- European Chemicals Agency
- United States Department of Energy
- Ministry of Industry and Information Technology
- Ministry of Economy Trade and Industry
- Ministry of Trade Industry and Energy
- National Institute of Standards and Technology
- Council of Scientific and Industrial Research
- Fraunhofer Society
- National Institute for Materials Science
Phase 2 — Supply-Side Assessment: Mapping Production Capabilities
Production Capacity Analysis
All major manufacturers are assessed for existing installed capacity, planned additions, expansions, new plant announcements, and technology adoption — mapped at global, regional, and country levels.
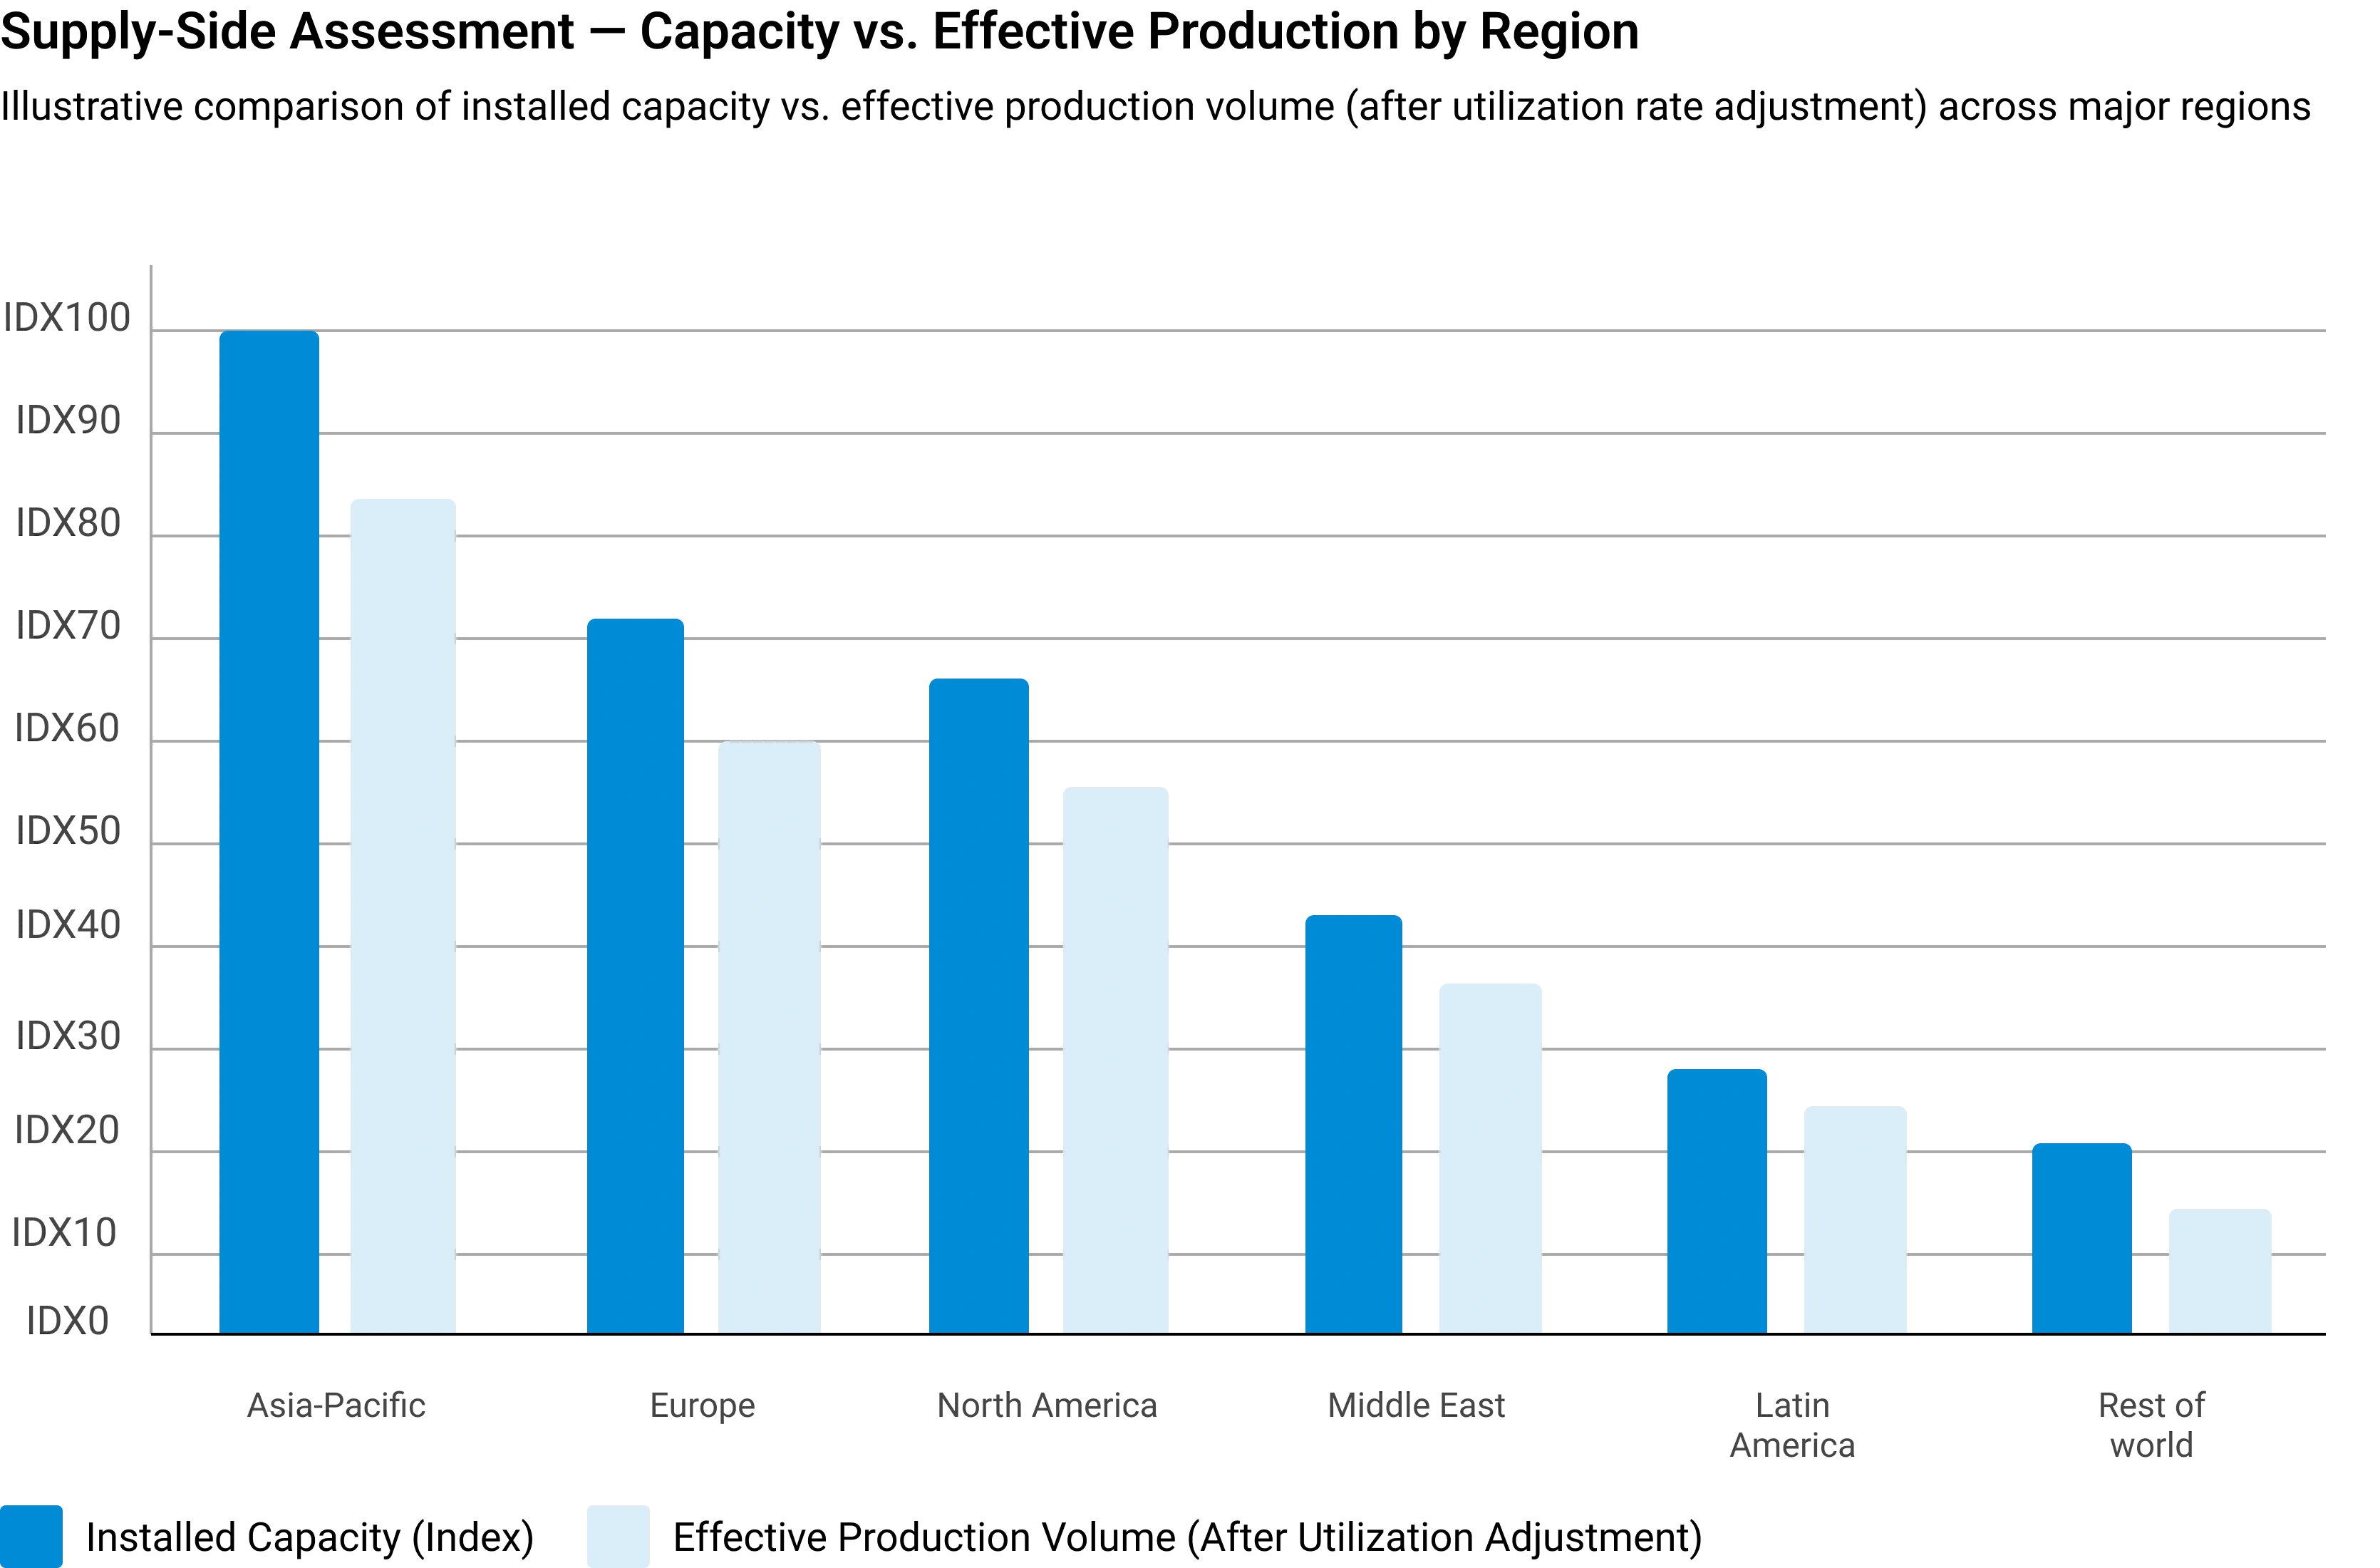
Capacity Utilization Adjustment
Installed capacity is adjusted using utilization rates based on demand conditions, feedstock availability, plant operating rates, maintenance schedules, and regulatory restrictions.
Manufacturer Revenue Analysis
Product-specific revenues, segment-level performance, regional distribution, average selling prices, and margin trends are evaluated to establish market value estimates.
Supply-Side Assessment — Capacity vs. Effective Production by Region
Illustrative comparison of installed capacity vs. effective production volume (after utilization rate adjustment) across major regions
Phase 3 — Demand-Side Assessment: Quantifying Chemical Consumption
Demand-side analysis quantifies chemical consumption across industries, applications, and geographies — identifying where and how chemicals are consumed throughout the value chain with precision.
End-Use Industry Analysis
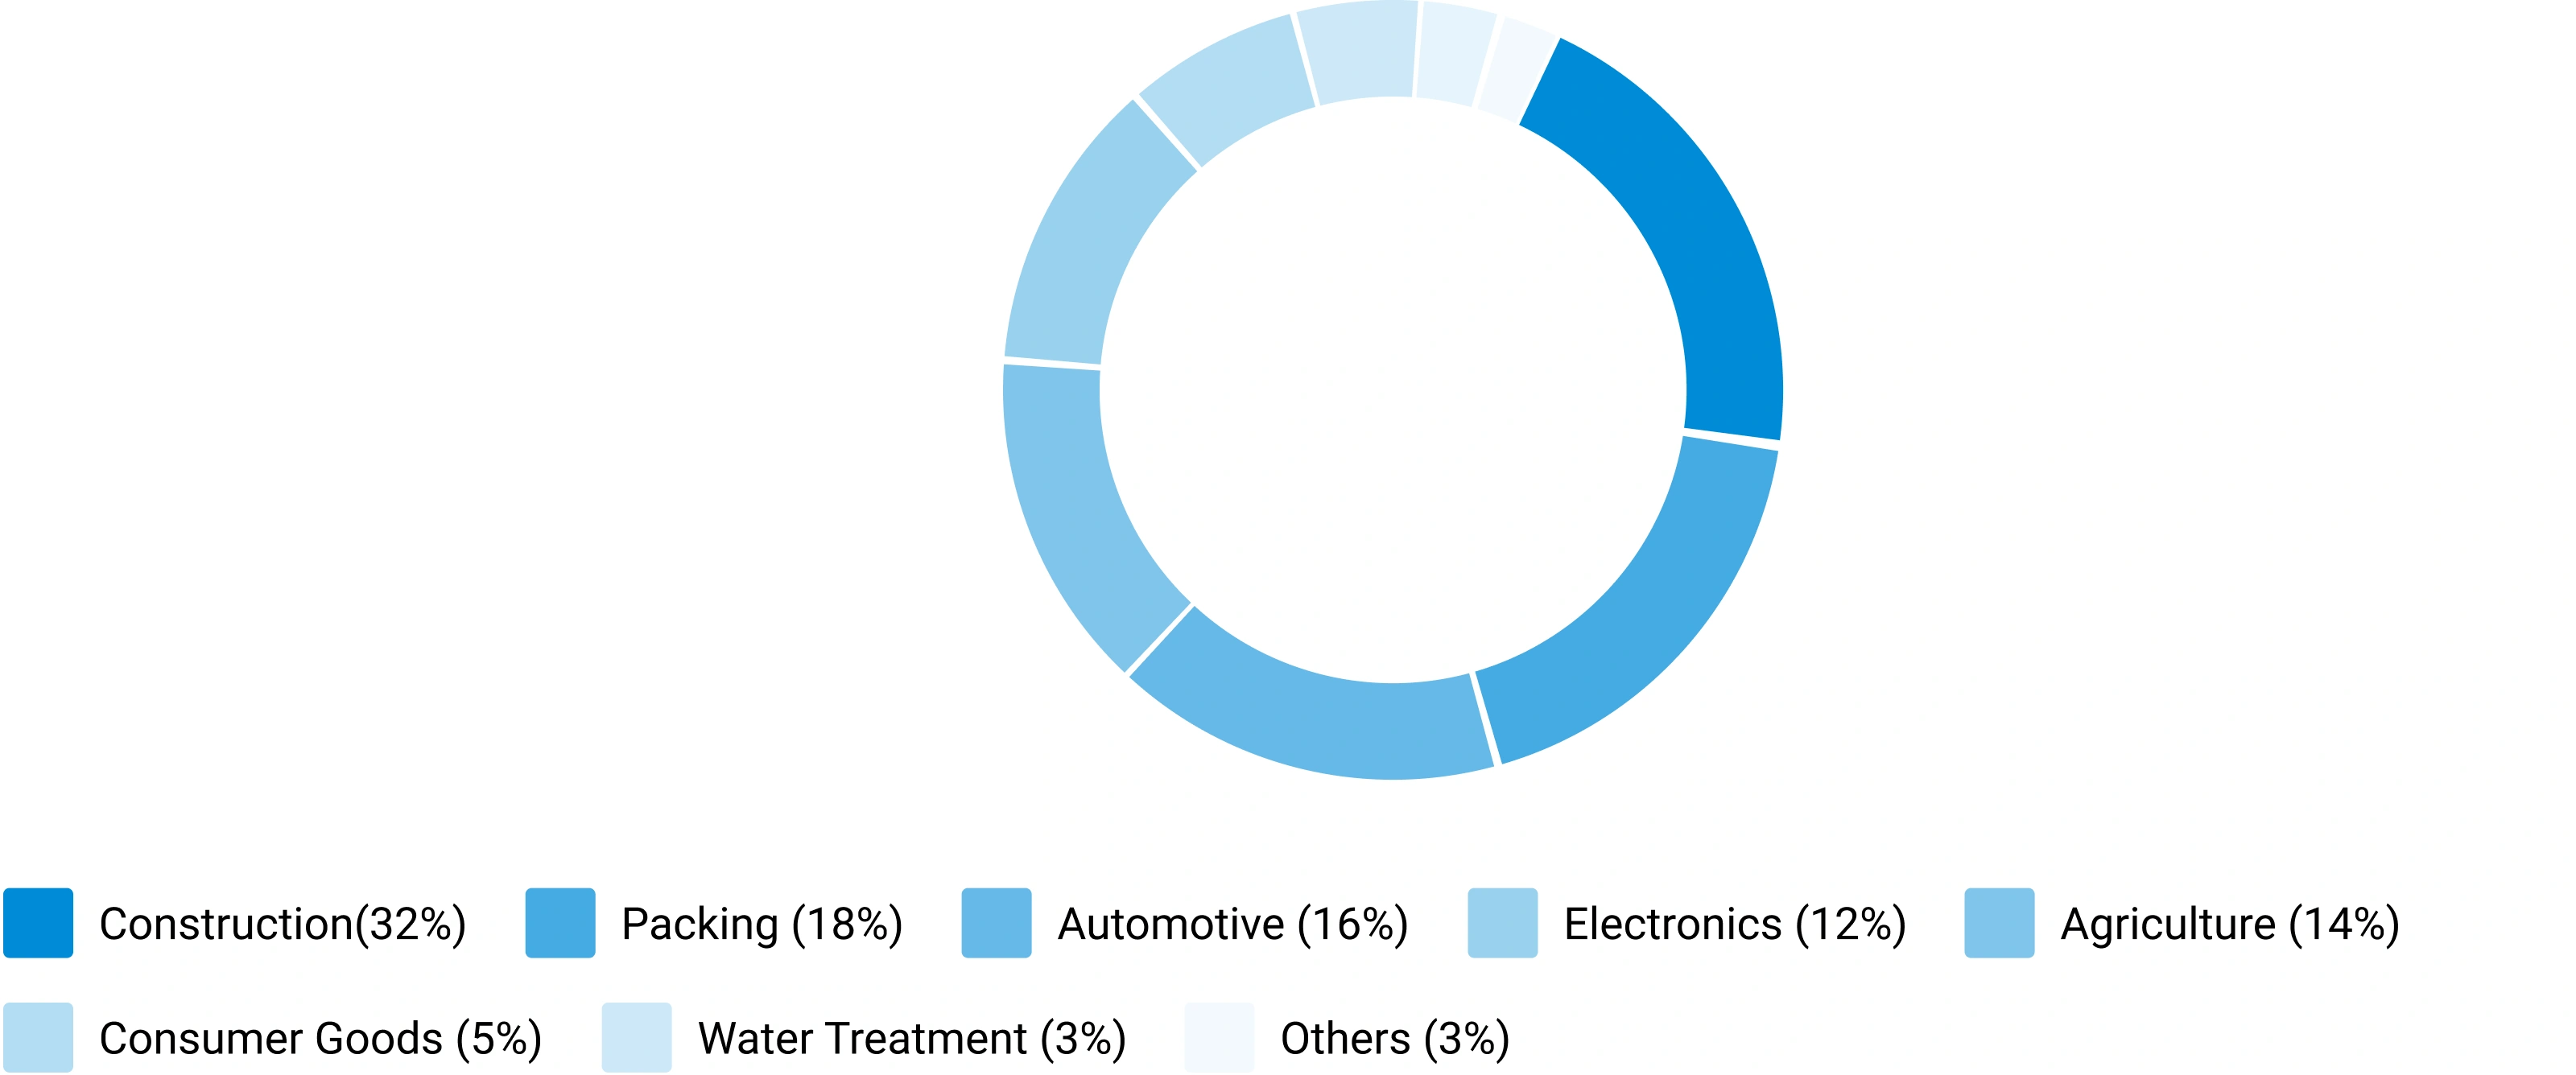
Chemical demand is evaluated across automotive, construction, packaging, electronics, agriculture, healthcare, consumer goods, industrial manufacturing, energy and utilities, and water treatment. Industry output, production trends, and consumption intensity are analyzed to determine demand patterns.
Consumption Modeling
Demand is estimated using measurable indicators: kilograms per vehicle, kilograms per square meter of construction, dosage per cubic meter of water treated, kilograms per hectare of agricultural land, and kilograms per ton of manufactured products. Consumption factors are validated through industry publications and primary interviews.
Application Analysis
The market is segmented by application area to understand product performance requirements, formulation trends, technology adoption, customer preferences, and regulatory requirements improving demand accuracy and segmentation granularity.
Demand-Side Assessment — End-Use Industry Demand Distribution
Illustrative distribution of chemical & materials demand across key end-use industries
Phase 4 - Trade Flow Analysis: Balancing Regional Supply and Demand
Trade flow analysis reconciles regional supply and demand estimates through import and export data, identifying net supply positions, regional dependencies, and market imbalances. It serves as an independent validation layer that tests the consistency of supply-side and demand-side estimates.
Import Analysis
Import data is evaluated to determine volumes, source countries, product dependency, regional supply gaps, and pricing trends — identifying markets that rely heavily on external supply and where domestic production is insufficient to meet demand.
Export Analysis
Export assessments reveal production surplus, export competitiveness, regional manufacturing strength, and global market participation. Export patterns also help validate domestic production estimates and identify net exporting regions.
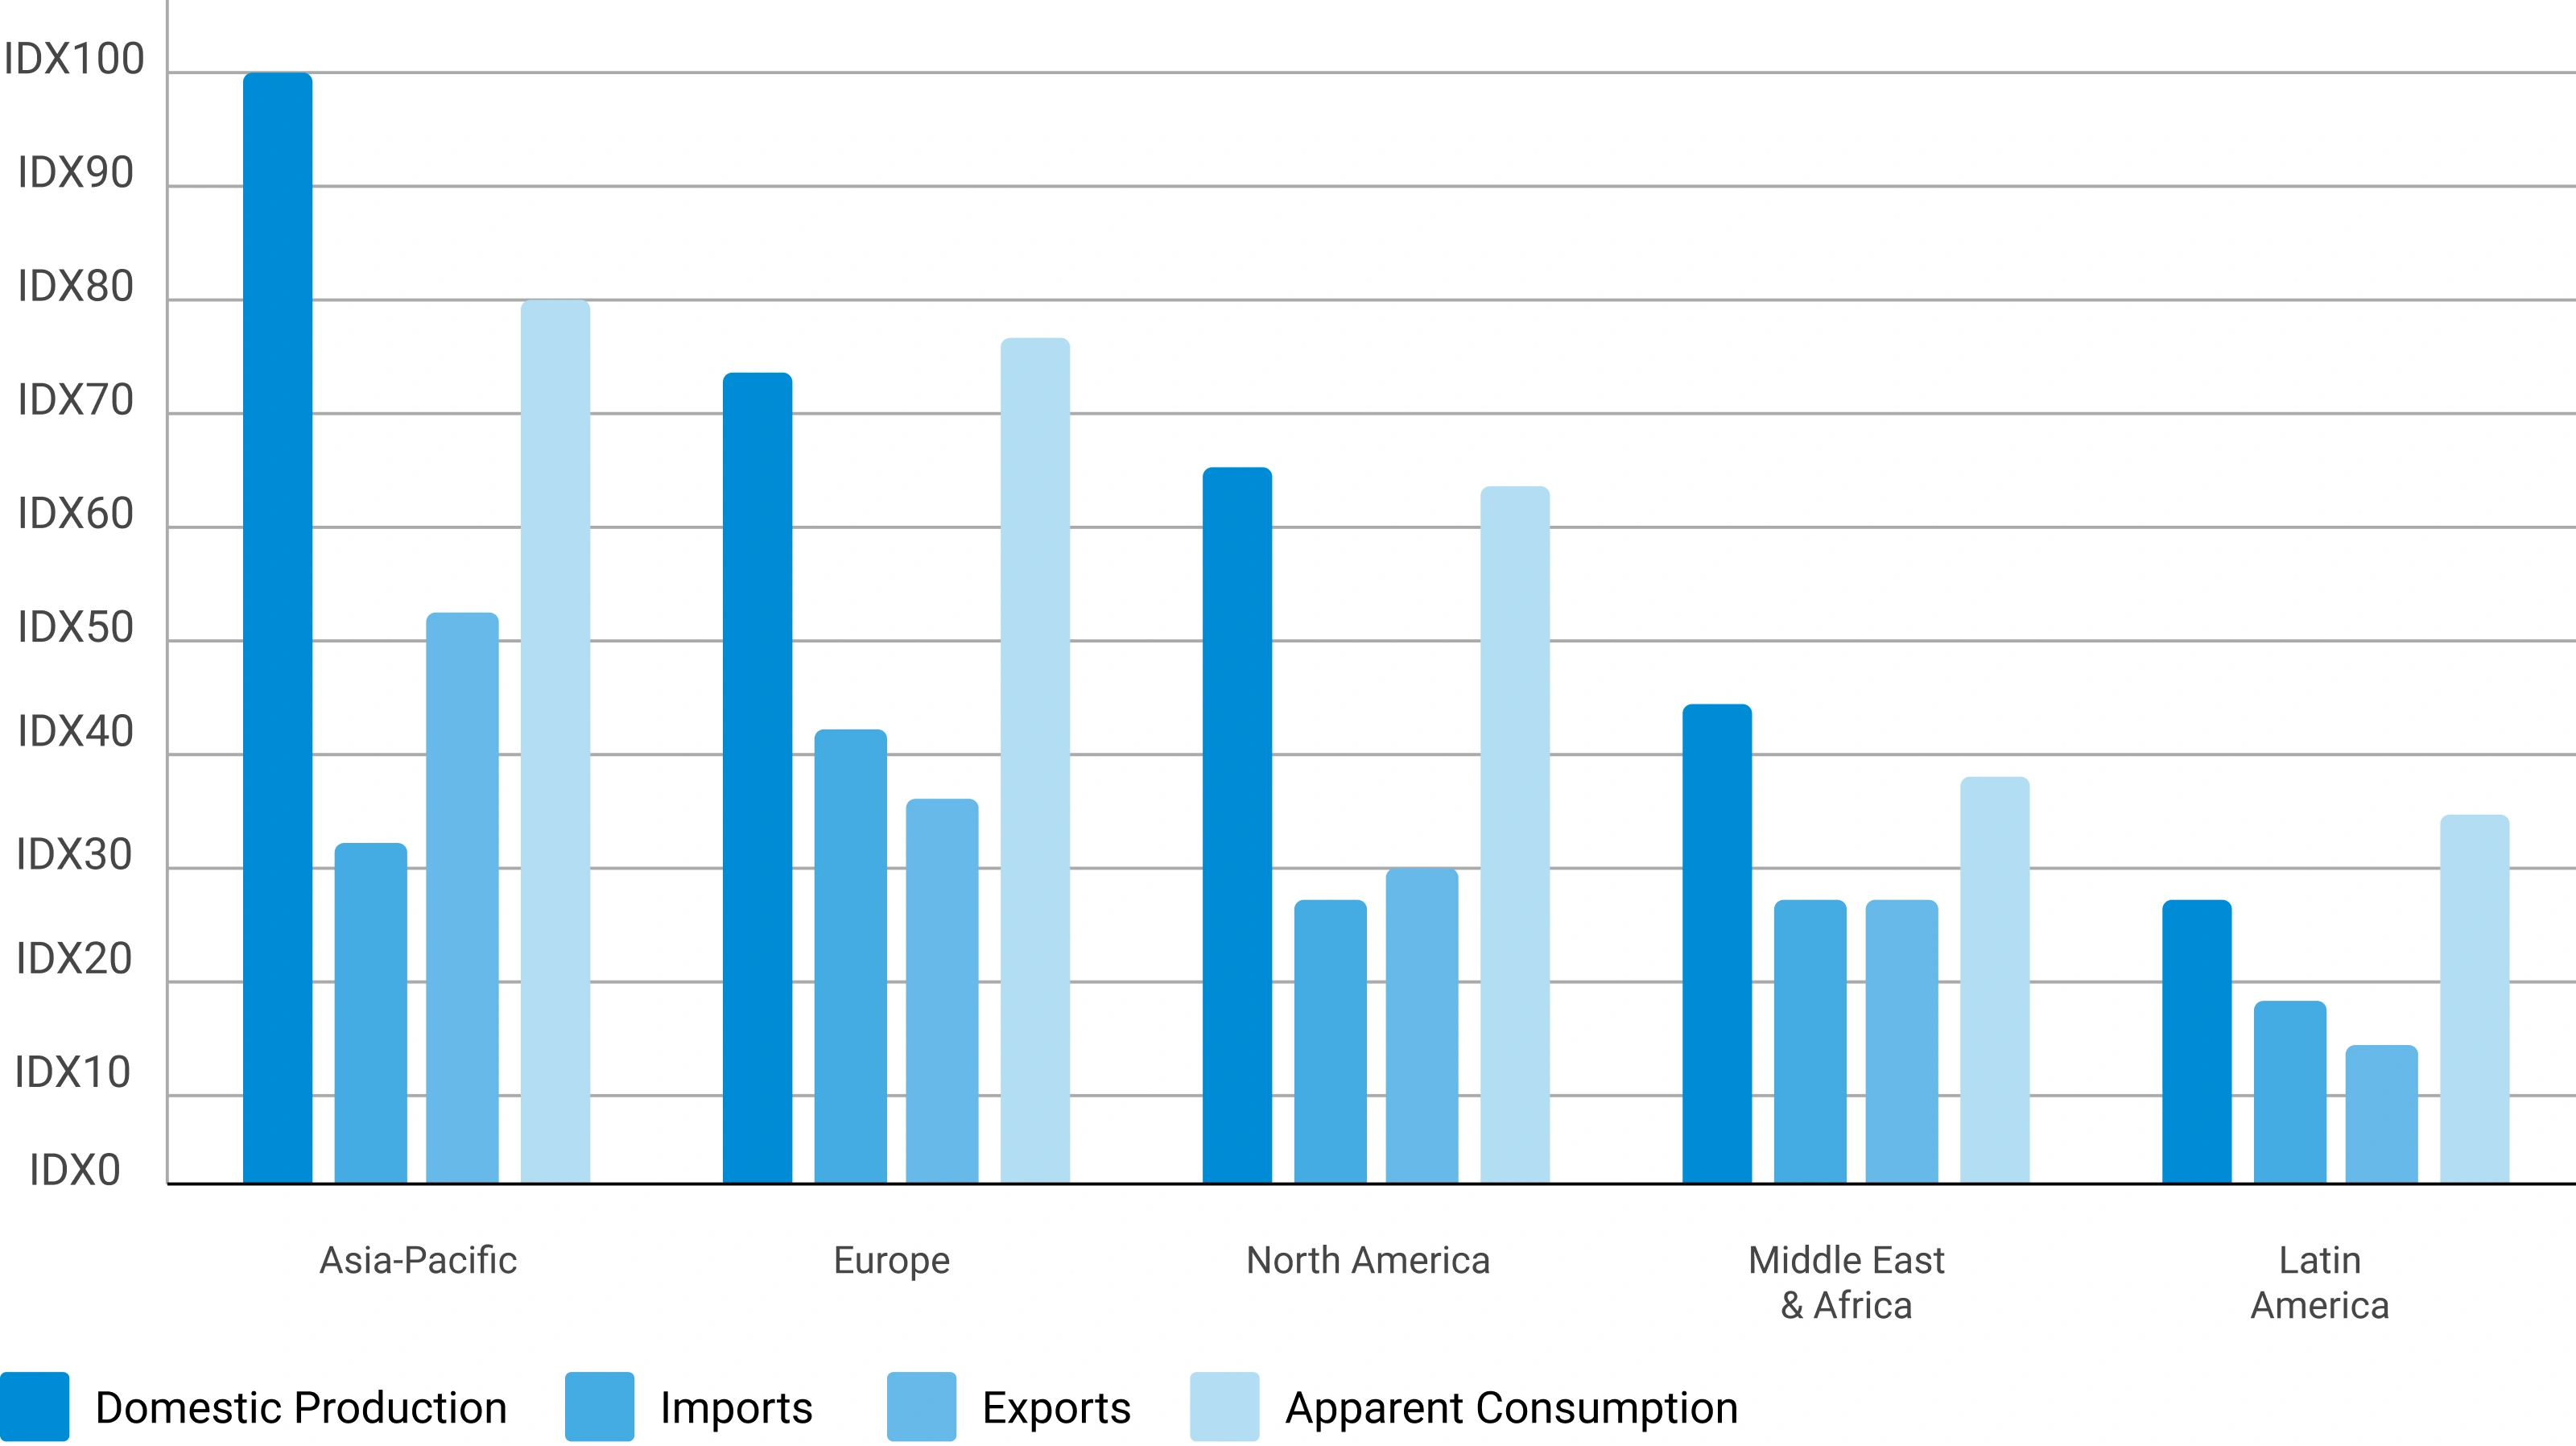
Apparent Consumption Model
Regional consumption is assessed using the standard apparent consumption formula:
Results identify net importing regions, net exporting regions, regional deficits, and surpluses — serving as an independent validation of supply and demand estimates.
Trade Flow Analysis — Net Supply Position by Region
Illustrative apparent consumption vs. domestic production across major regions — positive gap indicates net import dependency
Phase 5 — Primary Research: The Critical Validation Layer
Primary research tests and refines findings from secondary research through direct engagement with industry participants across the supply chain, demand side, and expert community. It captures intelligence that no database or published report can provide — the real-world experience of manufacturers, buyers, and specialists operating in the market.

Supply-Side Interviews
Conversations with chemical manufacturers, raw material suppliers, contract manufacturers, technology providers, and plant operators cover production trends, capacity utilization, pricing developments, technology shifts, and competitive dynamics.

Demand-Side Interviews
Engagement with OEMs, industrial consumers, procurement managers, distributors, formulators, and end-use manufacturers focuses on consumption trends, purchasing behavior, product substitution, demand outlook, and emerging applications.

Industry Expert Consultations
Additional interviews with industry consultants, independent experts, regulatory specialists, technical professionals, and research institutions provide deeper market context and validate key analytical assumptions.
Focus Areas of Primary Research:
Market Size & Forecast Validation
Revenue estimates, volume consumption, growth rates, forecast assumptions, regional demand.Supply Chain & Value Chain Assessment
Raw material sourcing, supply chain challenges, distribution networks, procurement practices.Production & Capacity Analysis
Manufacturing capacity, utilization rates, expansion projects, plant investments.Pricing & Cost Structure Analysis
Product pricing trends, feedstock costs, energy costs, margin pressures, pricing outlook.Competitive Landscape Assessment
Volume and value estimates confirmed to be fully consistent with one another before publicationInterview Volume by Market Scope
| Study Scope | Number of Interviews |
|---|---|
| Niche Market | 20 – 30 |
| Mid-Sized Market | 30 – 50 |
| Global Market | 50 – 80 |
| Highly Fragmented Market | 80 – 120 |
Interview Details:
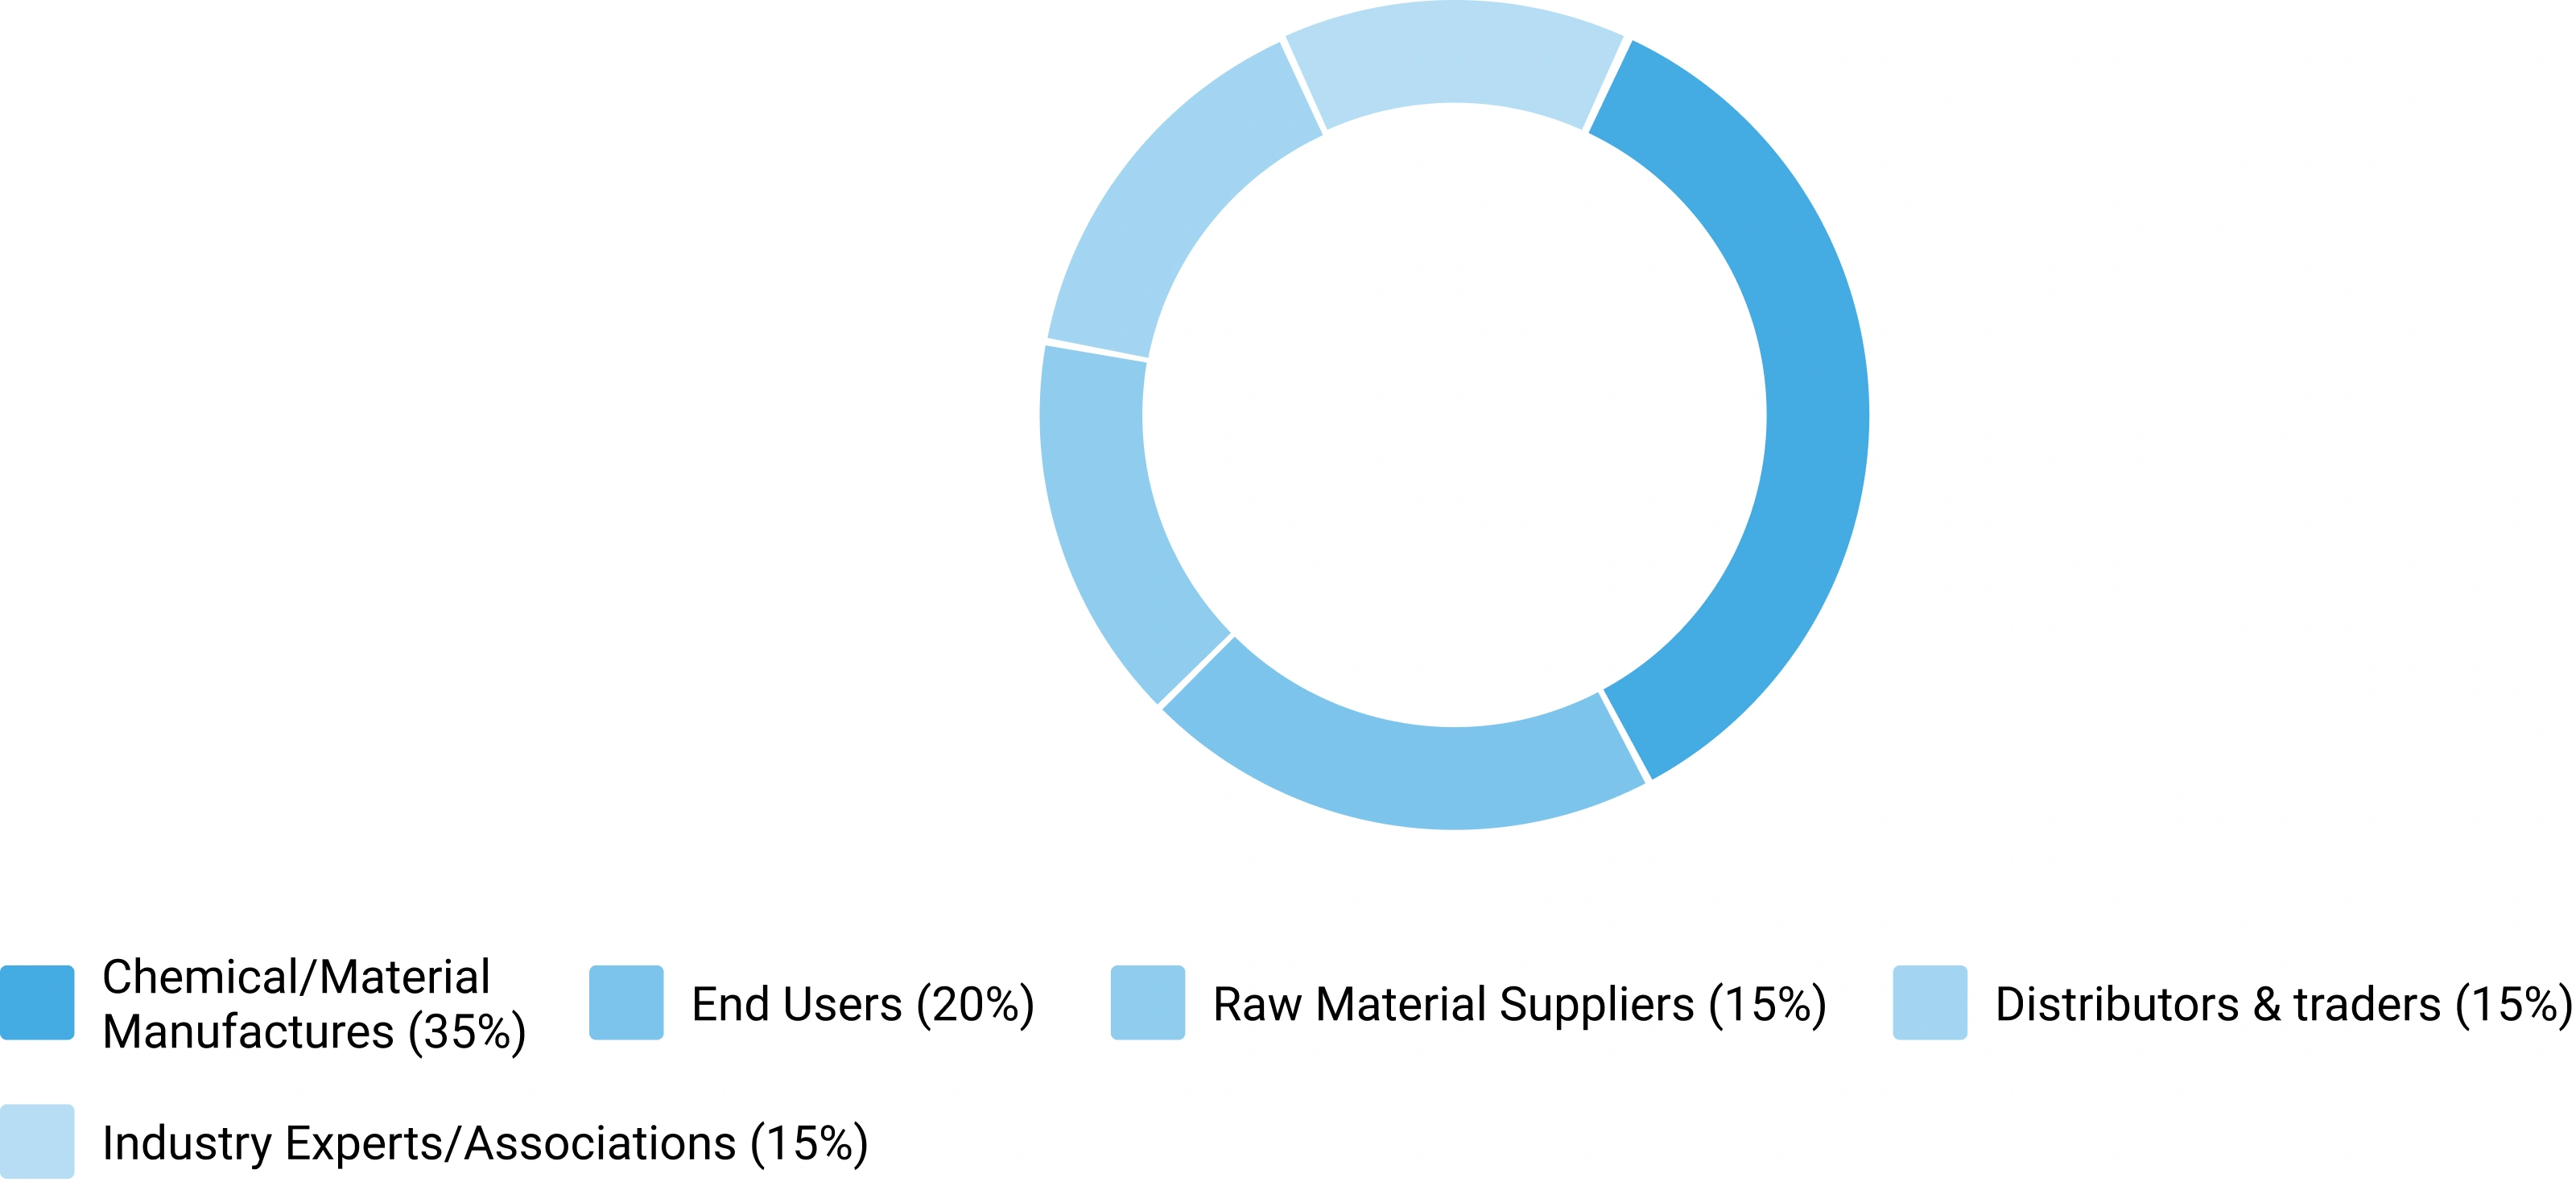
Category : Manufacturers, Suppliers, Distributors, End Users, Experts/Associations
Average Duration : 30–60 Minutes
Interview Mode : Video calls, telephonic interviews, expert consultations
Interview Format : Structured / Semi-Structured questionnaire
Focus Areas of Primary Research:
Market Size & Forecast Validation :
Revenue estimates, volume consumption, growth rates, forecast assumptions, regional demand.
Supply Chain & Value Chain Assessment :
Raw material sourcing, supply chain challenges, distribution networks, procurement practices.
Production & Capacity Analysis :
Manufacturing capacity, utilization rates, expansion projects, plant investments.
Pricing & Cost Structure Analysis :
Product pricing trends, feedstock costs, energy costs, margin pressures, pricing outlook.
Competitive Landscape Assessment :
Market share, competitor positioning, strategic initiatives, partnerships, acquisitions.
Primary Research — Stakeholder Coverage by Category
Distribution of interview respondents across stakeholder categories (% share from PPT data)
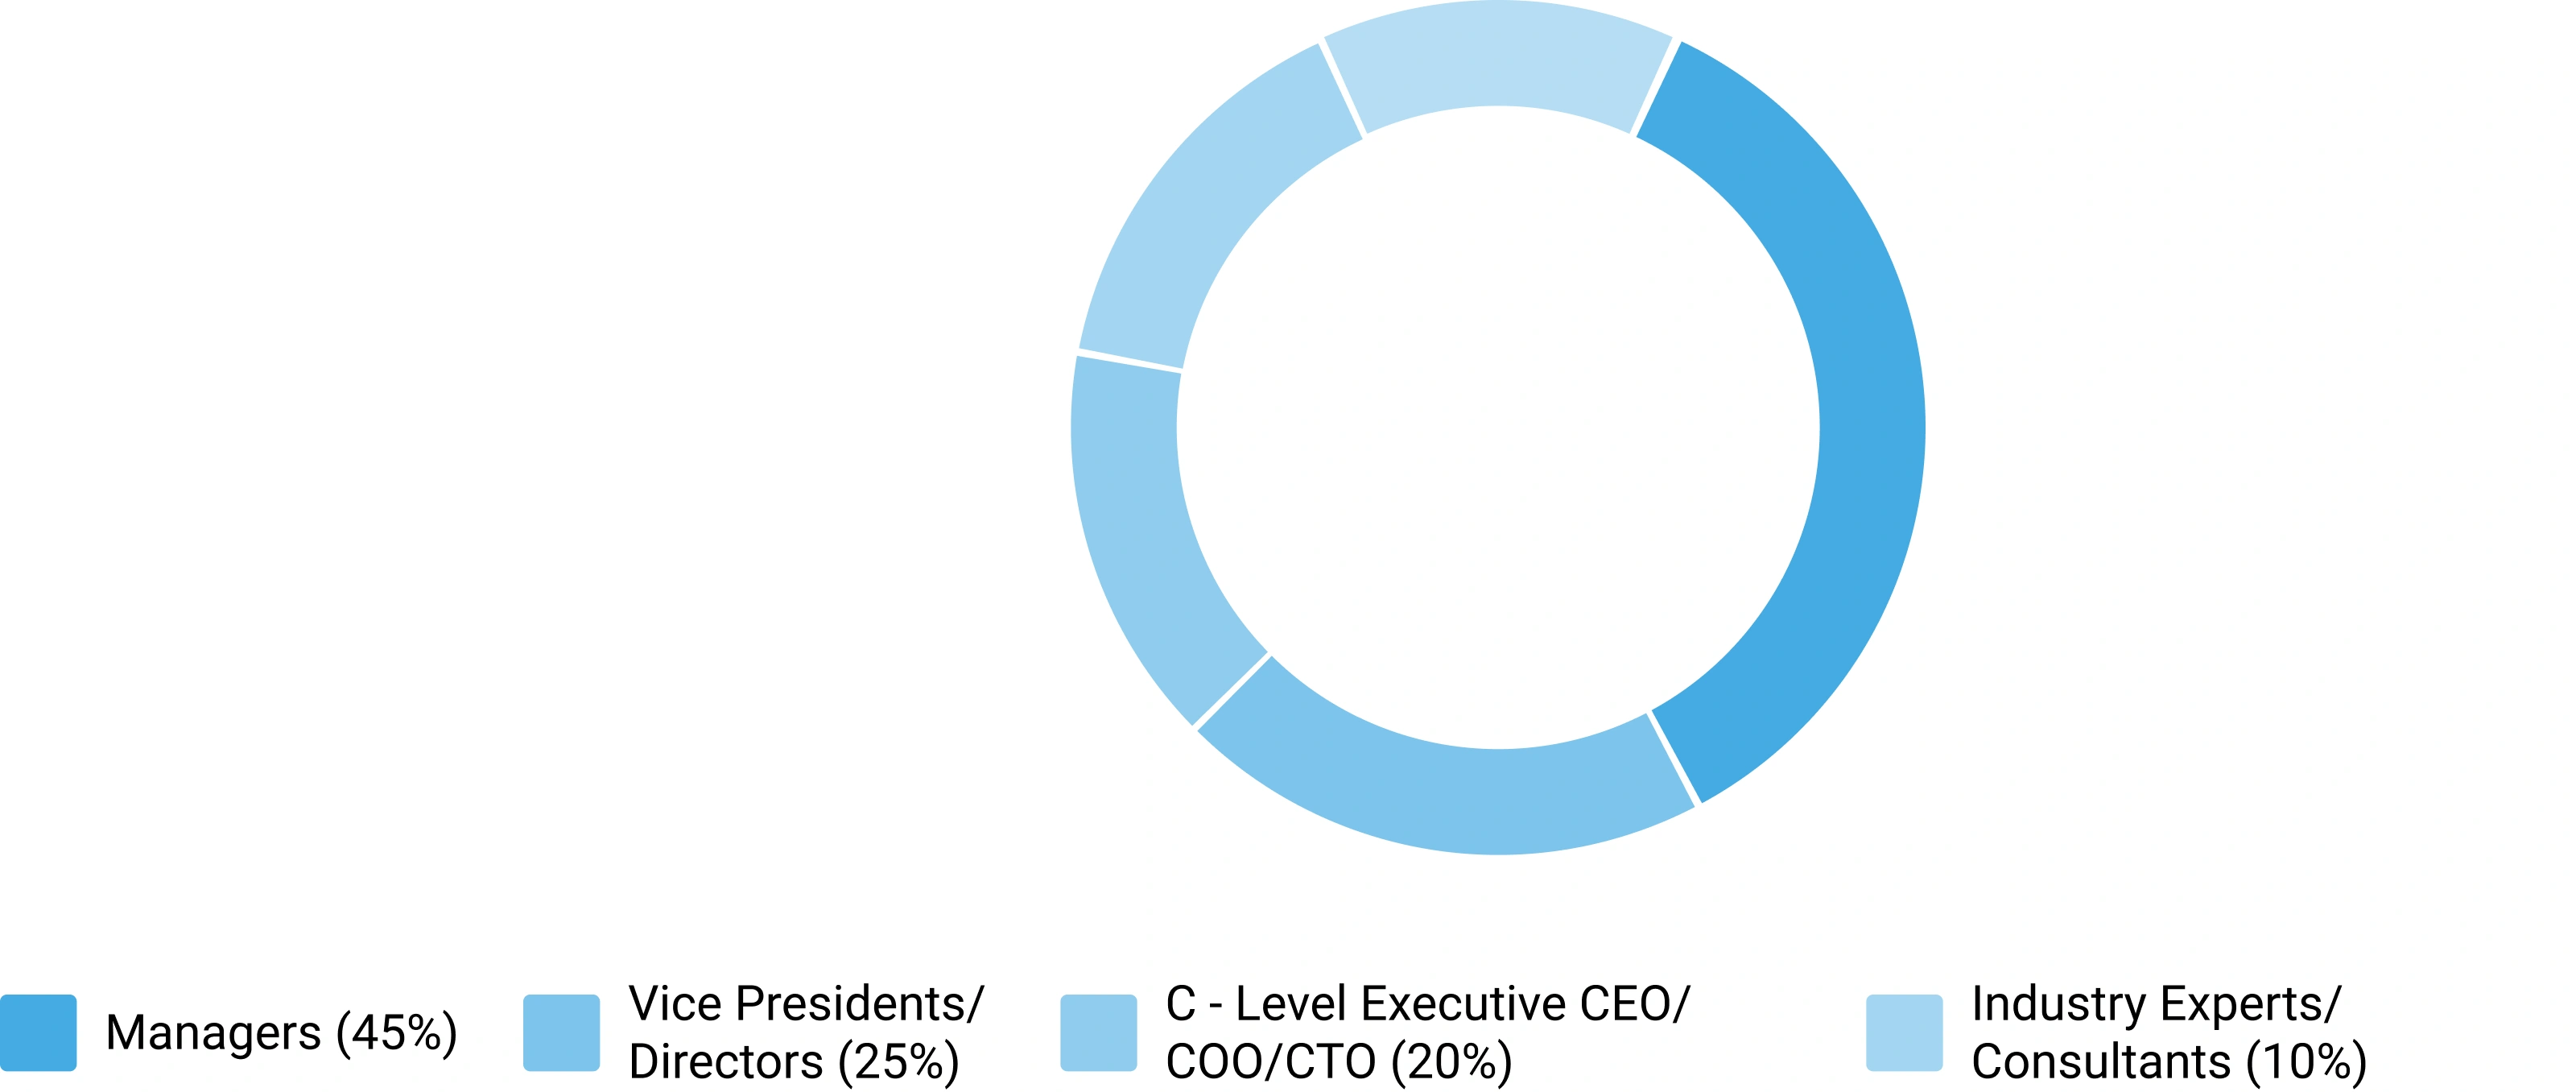
Primary Research — Respondent Designation Profile
Seniority breakdown of interview respondents (% share from PPT data)
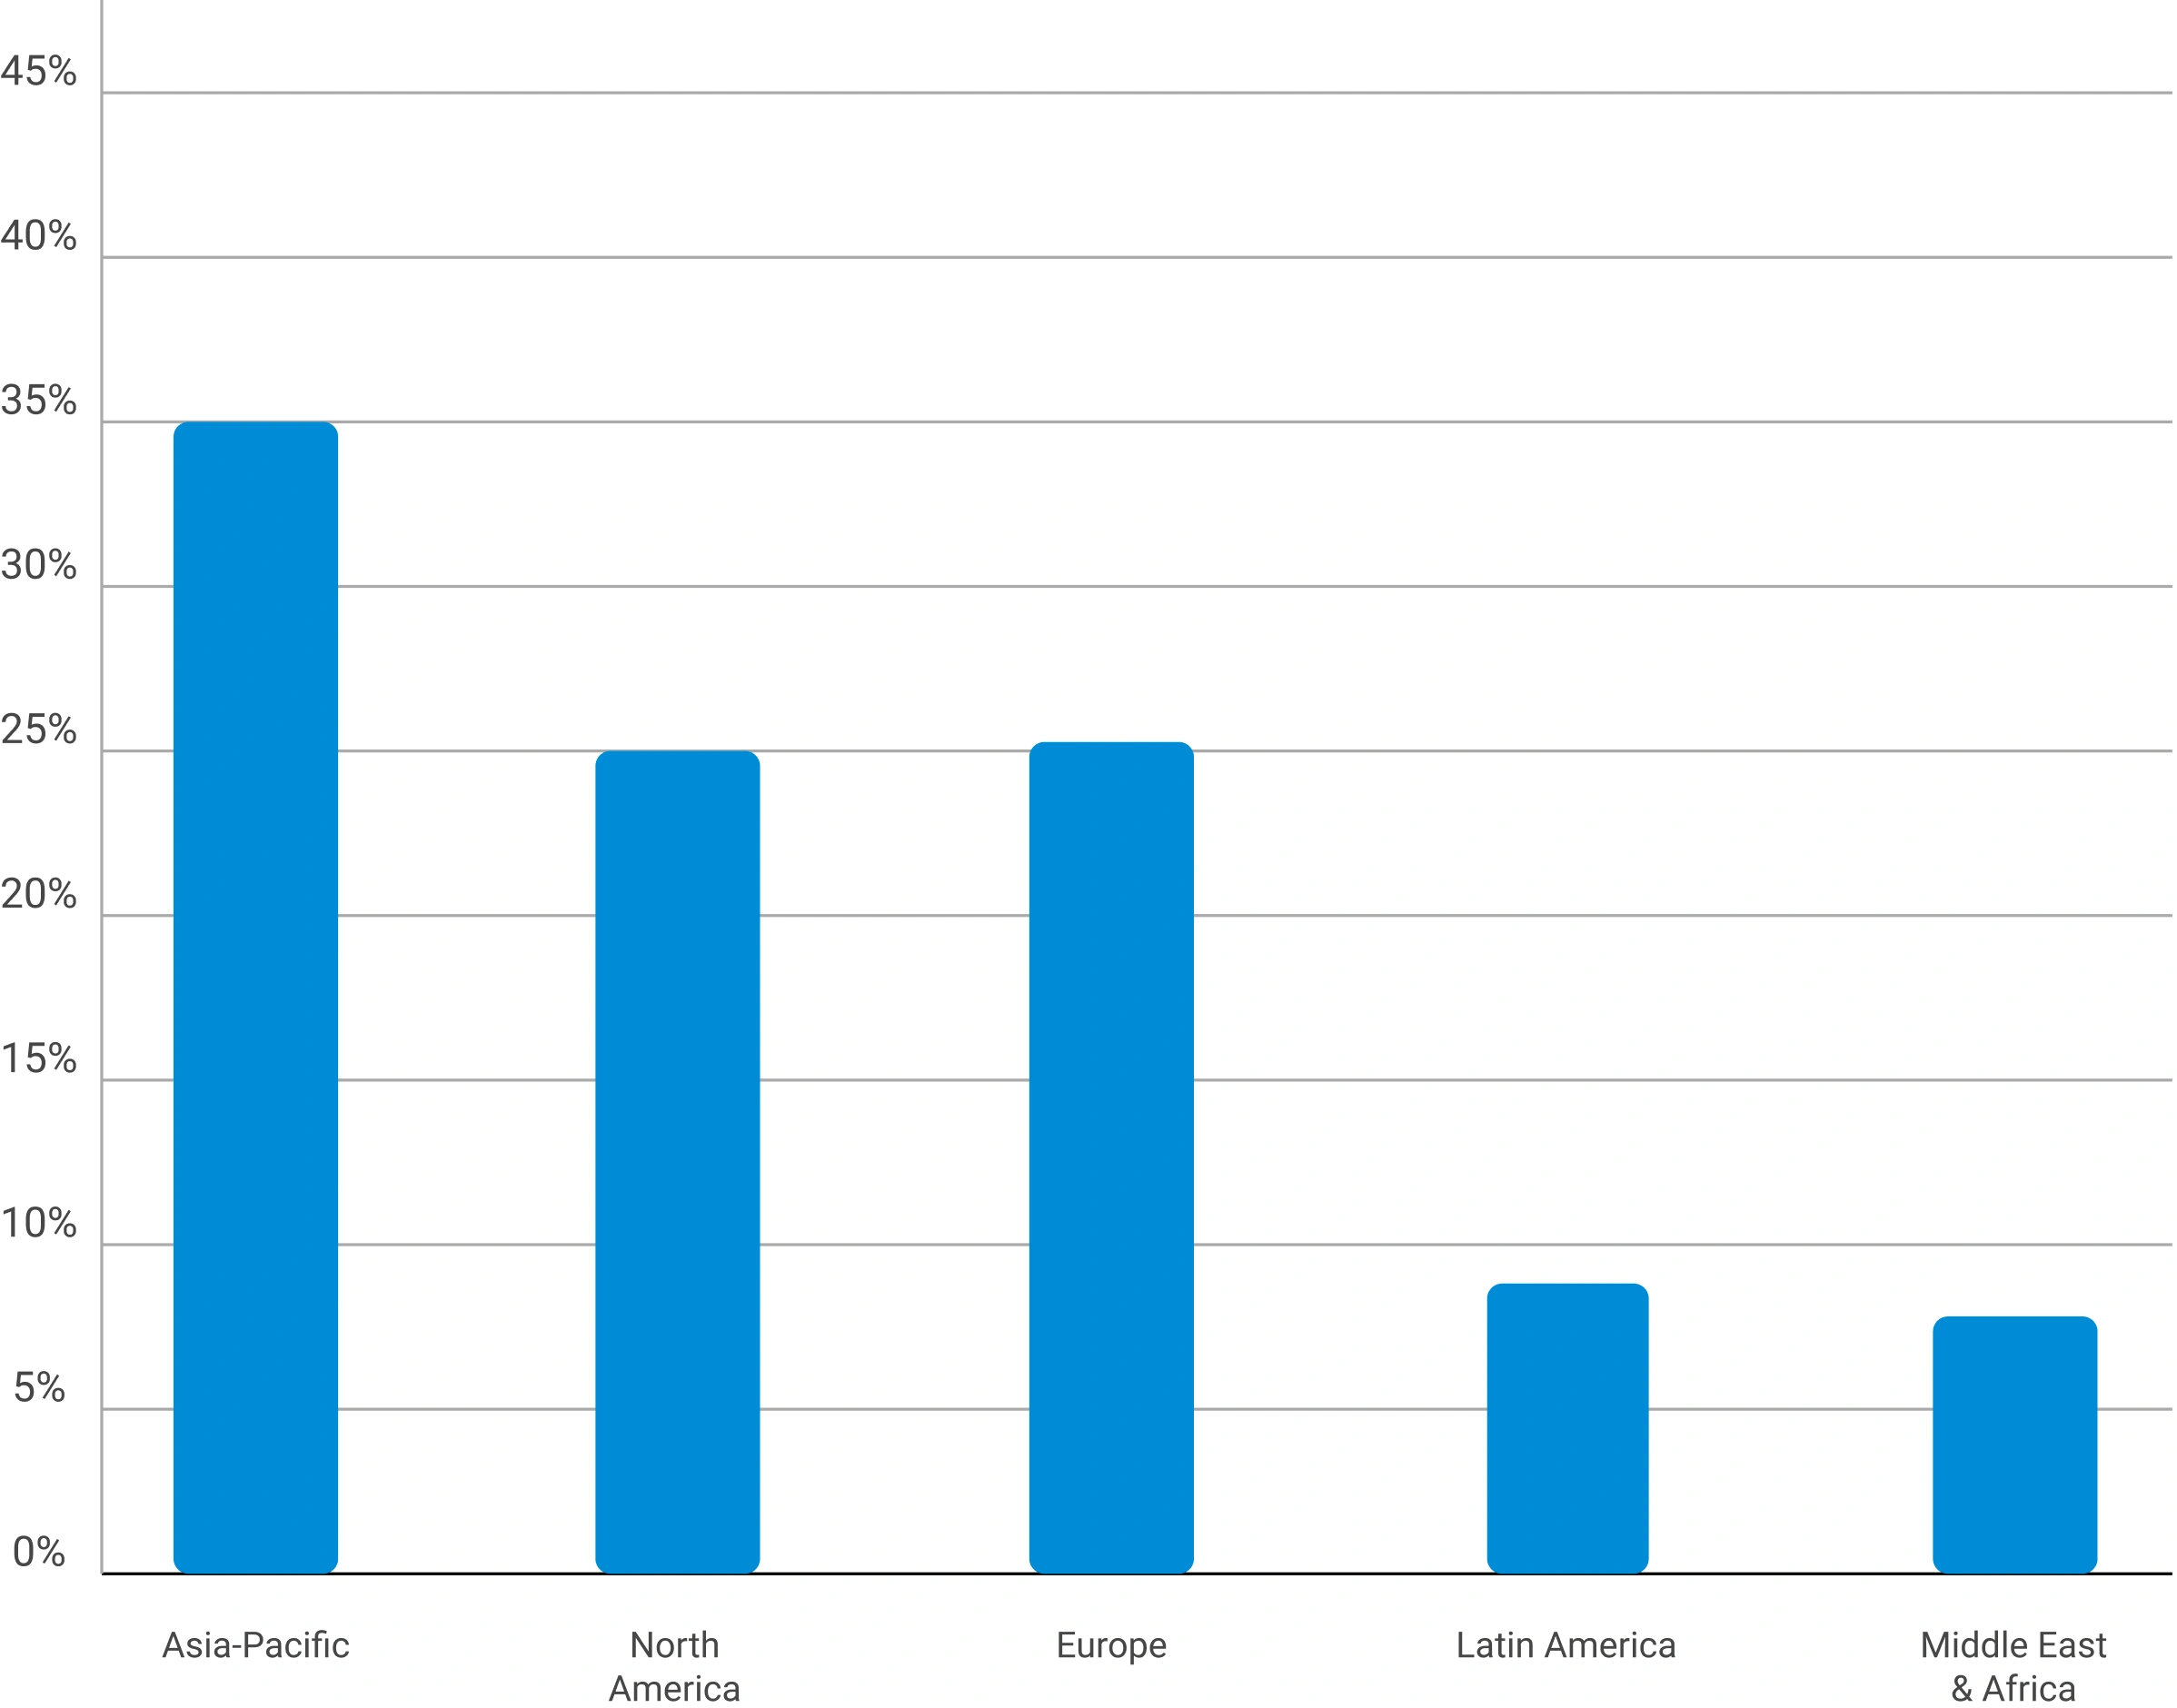
Primary Research — Geographic Coverage of Interviews
Regional distribution of primary research engagement (% share from PPT data)
Phase 6 — Data Triangulation and Market Validation
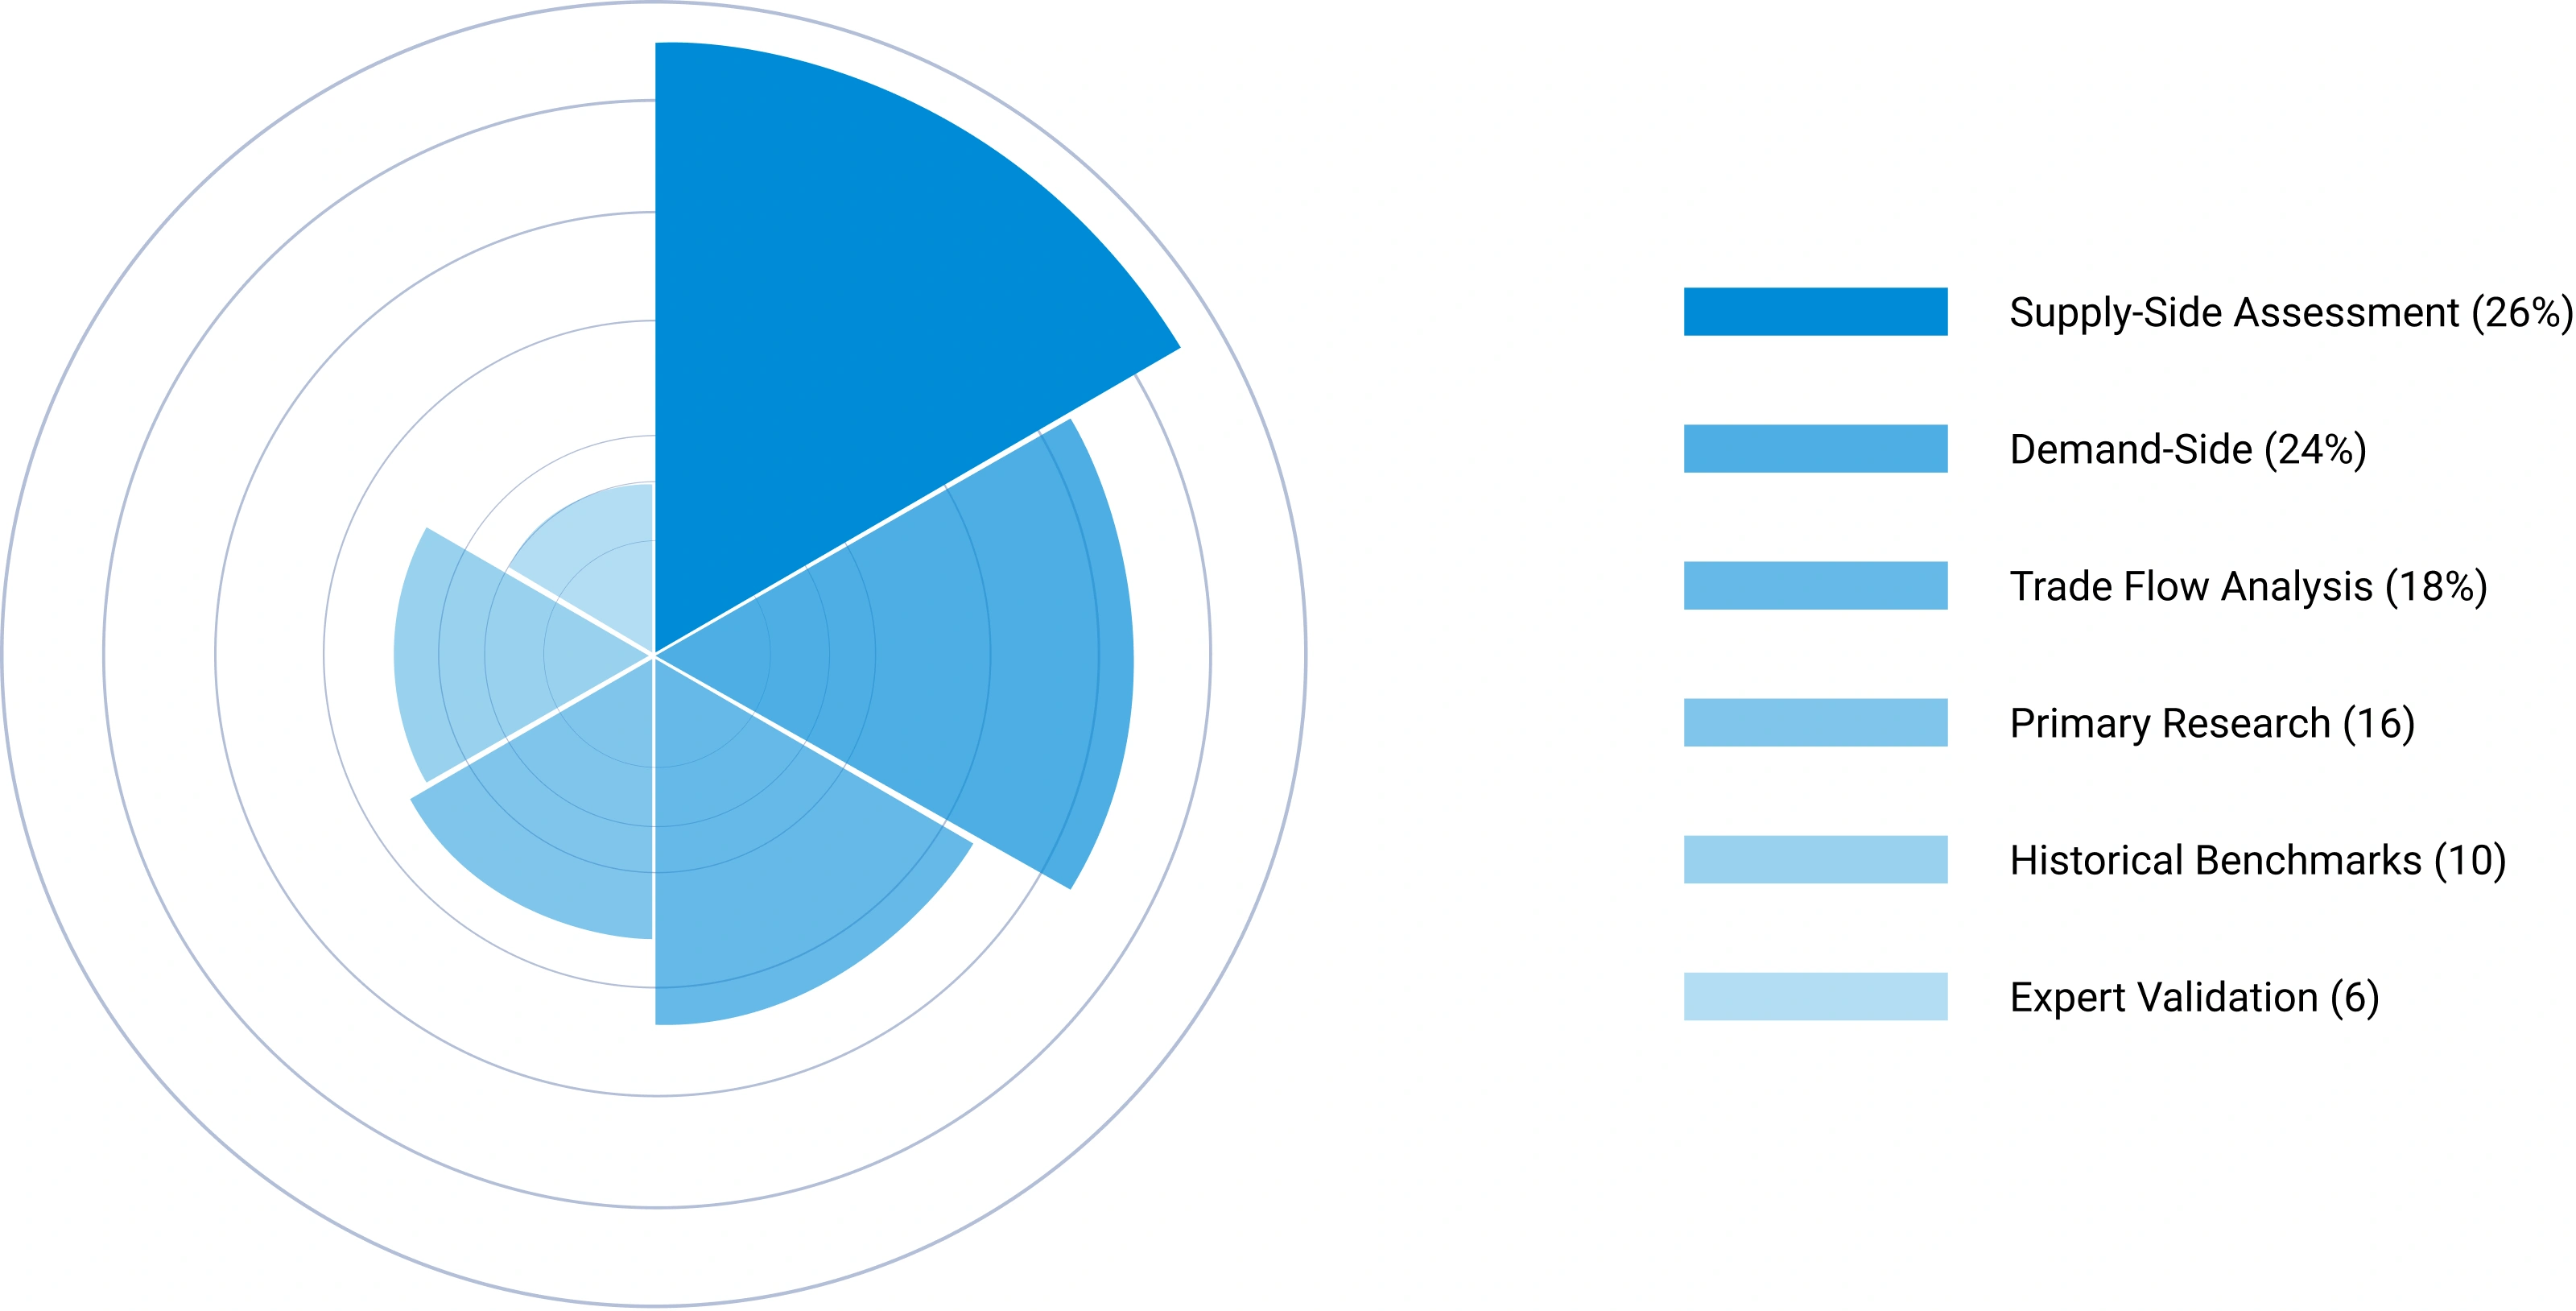
No single methodology is relied upon in isolation. Multiple independent estimation approaches are combined and reconciled to ensure consistency, accuracy, and analytical defensibility. Any material deviations between approaches are investigated and adjusted through additional validation cycles.
The final market size is derived through weighted triangulation of all validated methodologies. Any material deviations between approaches are investigated and adjusted through additional validation cycles. The outcome represents the most realistic assessment of the market based on available evidence and expert confirmation ensuring that volume and value estimates are fully consistent with one another.
Triangulation Framework — Input Contribution Weight
Relative weight each sizing input contributes to the final reconciled market estimate
Phase 7 — Forecast Modeling: Projecting Future Market Evolution
Forecasting evaluates the future trajectory of the market using a combination of quantitative indicators and qualitative assessments across economic, industry, and regulatory dimensions. Rather than simple extrapolation, each driver is independently modeled and integrated into a composite forecast.
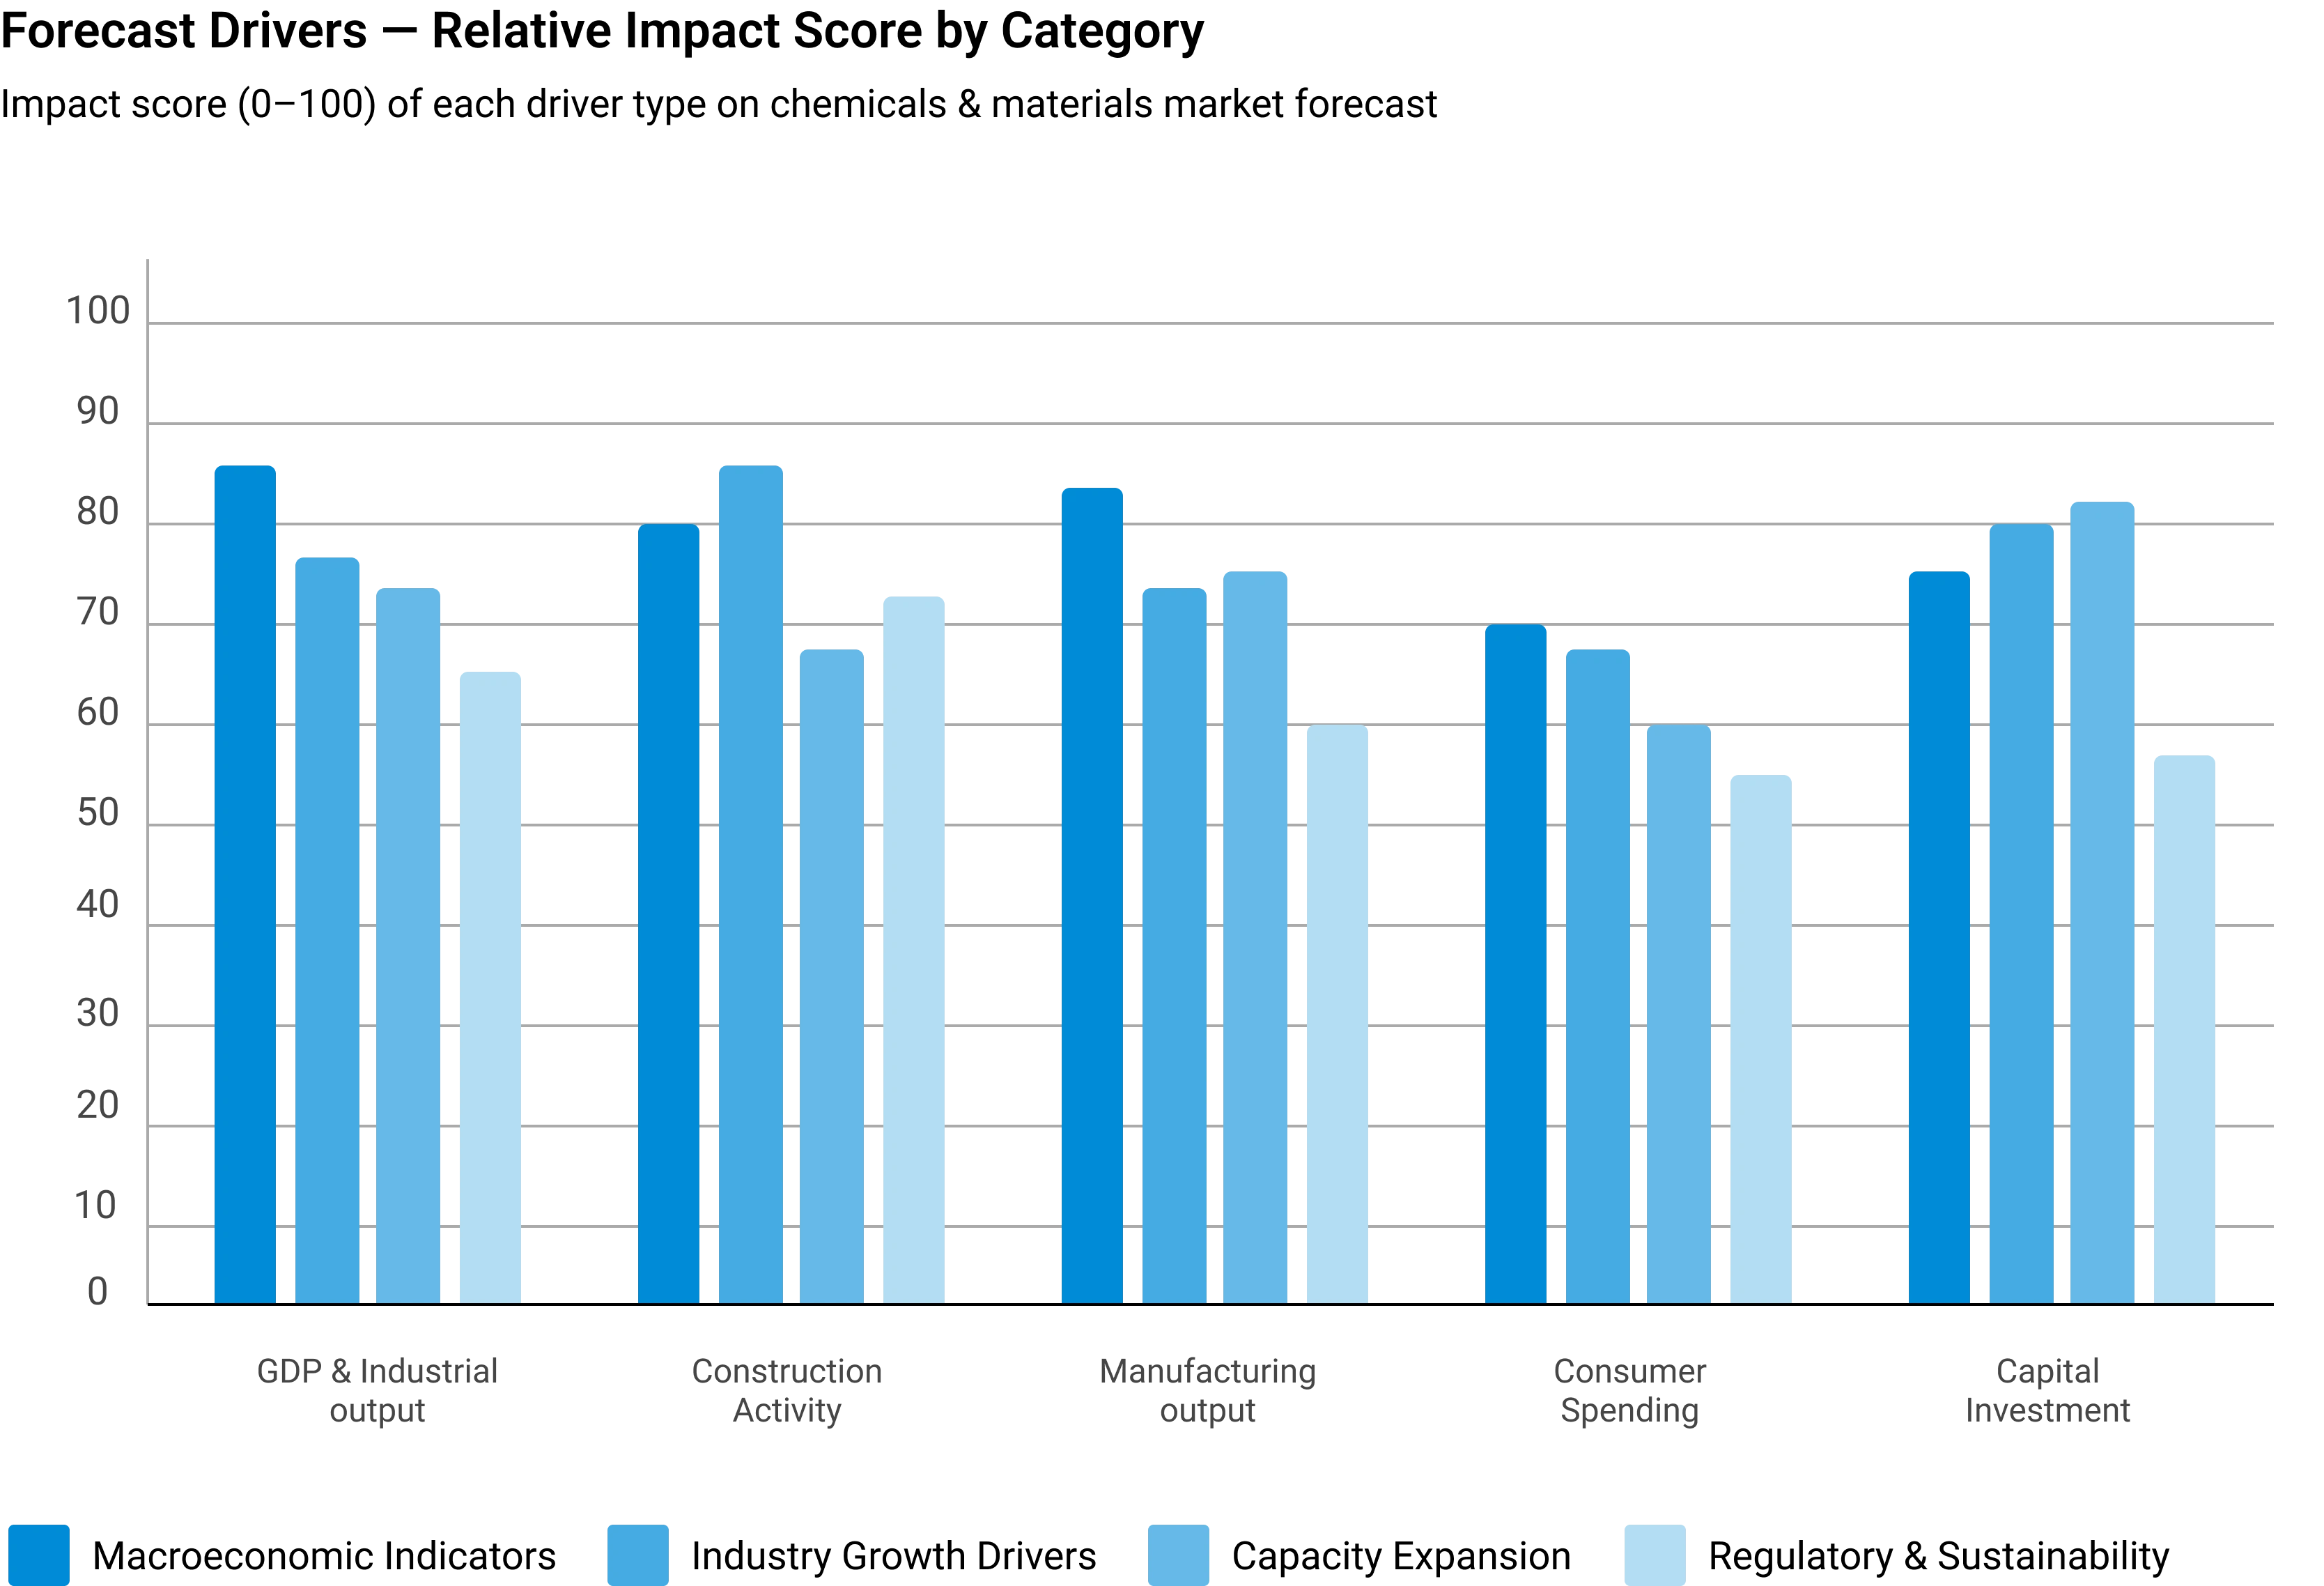
Macroeconomic Indicators
GDP growth, industrial production, manufacturing output, construction activity, consumer spending, and capital investment form the quantitative foundation of long-term demand projections. These are applied at country, regional, and global levels.
Industry Growth Drivers
Urbanization, infrastructure development, industrialization, technological innovation, sustainability initiatives, and evolving product performance requirements are assessed at regional and industry levels — capturing both structural and cyclical demand drivers.
Capacity Expansion Analysis
Announced plant expansions, new manufacturing facilities, technology upgrades, and strategic investments are evaluated to determine future supply-demand dynamics and potential market tightness or oversupply situations.
Regulatory & Sustainability
Environmental regulations, chemical safety standards, emission reduction targets, circular economy initiatives, and sustainability requirements are incorporated as they often influence product adoption rates and market growth trajectories.
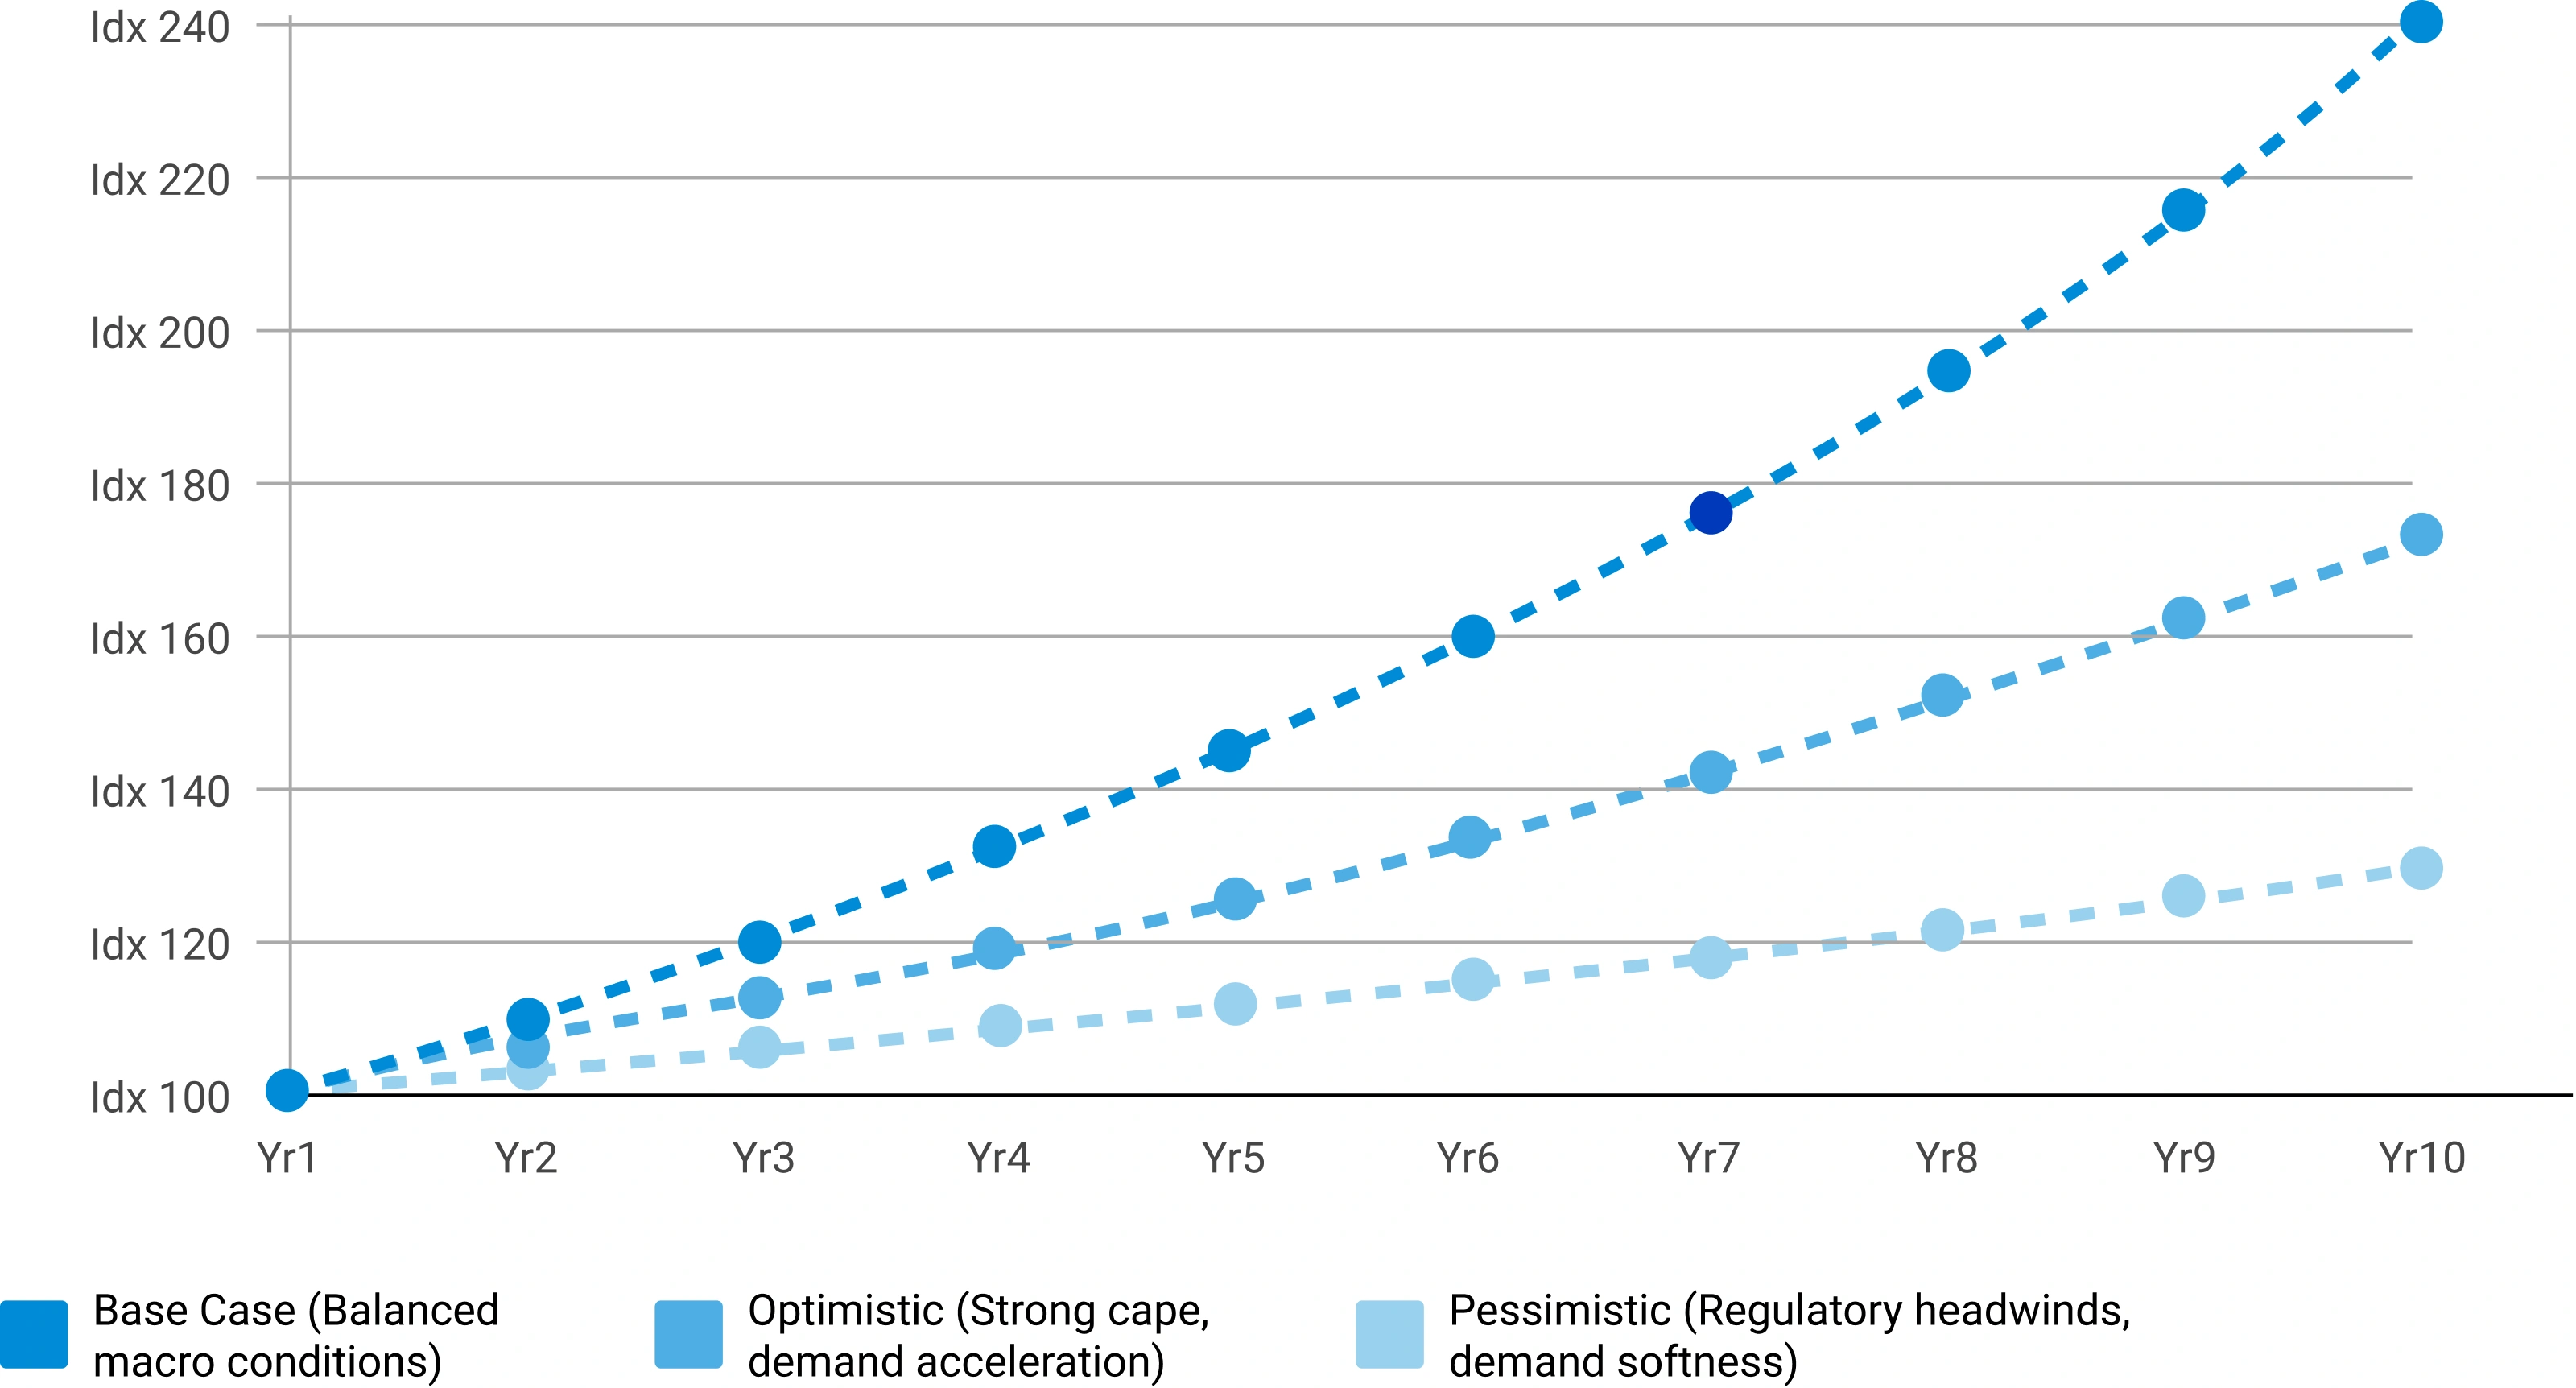
Scenario Forecast Range — Indexed Market Growth (Year 1–10)
Illustrative indexed growth trajectories across Base, Optimistic, and Pessimistic scenarios over a 10-year forecast horizon
Forecast Drivers — Relative Impact Score by Category
Impact score (0–100) of each driver type on chemicals & materials market forecast



Comments
Share your thoughts, ask a question, or provide feedback about this report.