
U.S. Biodegradable Plastics Market Size, Competitive Landscape Analysis Report 2035
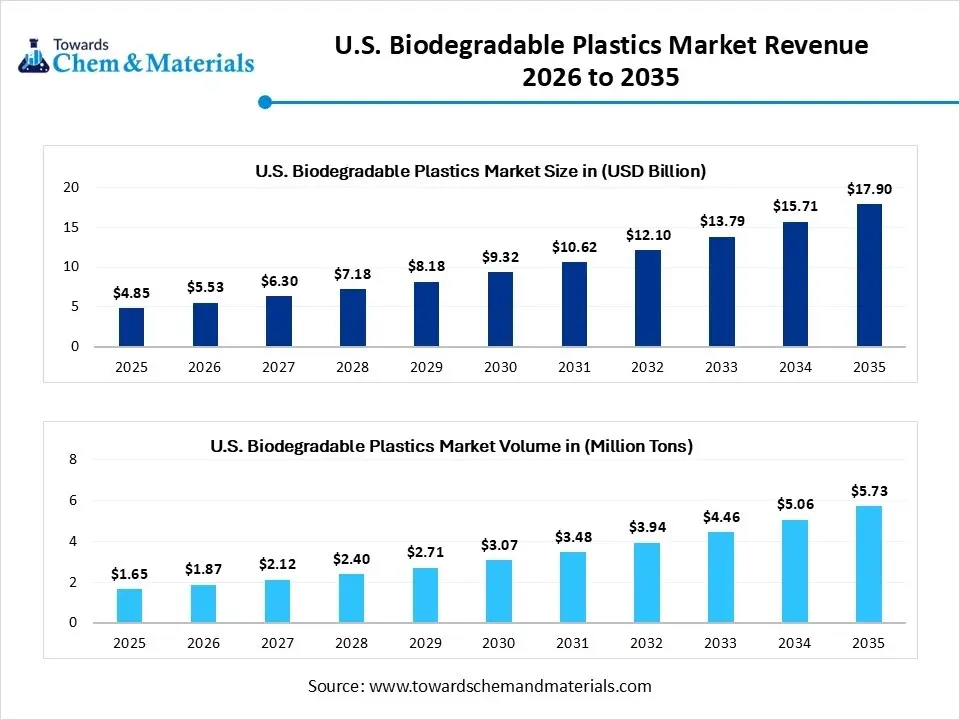
The U.S. biodegradable plastics market market size was estimated at USD 4.85 billion in 2025 and is expected to increase from USD 5.53 billion in 2026 to USD 17.90 billion by 2035, growing at a CAGR of 13.95% from 2026 to 2035. In terms of volume, the market is projected to grow from 1.65 million tons in 2025 to 5.73 million tons by 2035. growing at a CAGR of 13.25% from 2026 to 2035. The shift towards sustainable manufacturing practices has sparked notable advancements in the industry.
Key Takeaways
- By material type, the starch-based blends segment led the U.S. biodegradable plastics market with approximately 42% industry share in 2024, due to its easy processing and cost-effective properties.
- By material type, the PHA segment is expected to grow at the fastest rate in the market during the forecast period, owing to its versatility and any environmental adaptability.
- By product form, the films segment emerged as the top-performing segment in the market with approximately 55% industry share in 2024, as it is considered the direct replacement of single-use plastics in the current period
- By product form, the fibres and nonwovens segment is expected to lead the market in the coming years, as biodegradable plastics enter textiles, hygiene products, and medical applications.
- By end-use industry, the packaging segment led the market with approximately 60% share in 2024, because it is the largest source of plastic waste and the first target for bans and sustainability pledges.
- By end-use industry, the medical and healthcare segment is expected to capture the biggest portion of the market in the coming years, as biodegradable plastics become integral to safe and sustainable medical products.
- By compostability, the industrial compostable segment led the market with approximately 58% industry share in 2024, because most biodegradable plastics today require controlled, high-heat environments to break down effectively
- By compostability, the marine biodegradable segment is expected to capture the biggest portion of the market in the coming years, as plastic pollution in oceans becomes a central environmental crisis.
- By processing technology, the extrusion segment led the market with approximately 50% share in 2024, because it is the most widely used processing method for films, sheets, and packaging products.
- By processing technology, the 3D printing filament production segment is expected to capture the biggest portion of the market in the coming years, as additive manufacturing continues to grow across industries
- By feedstock origin, the corn/maize segment led the U.S. biodegradable plastics market with approximately 44% industry share in 2024, because it is abundant, affordable, and deeply integrated into the agricultural economy
- By feedstock origin, the waste-derived feedstock segment is expected to capture the biggest portion of the market in the coming years, because of the dual benefit of reducing waste and producing sustainable materials.
Market Overview
Can Biodegradable Plastics Replace Traditional Polymers in America’s Industrial Sectors?
The U.S. biodegradable plastics market has experienced rapid growth in recent years. Also, the United States has seen under a heavy plastic usage due to its advanced industrial sectors and export statistics. As the polymeric materials (bio-based and/or fossil-derived) engineered to undergo breakdown by biological activity into water, COâ‚‚ (or CHâ‚„), and biomass under specified environmental conditions (industrial composting, home composting, soil or marine), are used as drop-in or specialty resins across packaging, agriculture, consumer goods, medical, textiles, and other end-uses.
- In January 2025, the plastic production of the United States had decreased by 1.7% by 2023.(Source: www.plasticsindustry.org)
Compostable Packaging Gains Ground Across U.S Industries
The governmental push towards environmentally friendly manufacturing and waste reduction has heavily improved the performance and scalability of the sector in recent years. Moreover, the manufacturers in the United States are actively promoting compostable packaging where it can be industrial areas or food chains. Furthermore, the major brands in the country have been putting in an enlarged investment into the biodegradable plastic R&D activities in the past few years. Also, factors like consumer awareness and single-use plastic bans are likely to maintain industry potential in the United States for the forecasted period.
- In July 2025, Colorado, USA, has implemented a ban on plastic carryout bags in retail food chains and several stores.(Source: www.earthday.org)
Market Trends
- The food producers are demanding compostable packaging in the current period, where the manufacturers are observed in establishing collaboration with them.
- The increasing investment in the innovation of high-performance biopolymers has actively set benchmarks for industry growth in the past years, as per a recent survey.
Report Scope
| Report Attributes | Details |
| Market Size in 2026 | USD 5.53 Billion |
| Expected Size by 2035 | USD 17.90 Billion |
| Growth Rate from 2025 to 2034 | CAGR 13.95% |
| Base Year of Estimation | 2025 |
| Forecast Period | 2025 - 2035 |
| Segment Covered | By Material Type, By Product Form, By End-use Industry, By Compostability / Biodegradation Environment, By Processing Technology, By Feedstock Origin |
| Key Companies Profiled | NatureWorks LLC, TotalEnergies Corbion, BASF SE, Novamont S.p.A., Braskem S.A., Danimer Scientific, Inc., Mitsubishi Chemical Corporation, PTT MCC Biochem Co., Ltd., FKuR Kunststoff GmbH, Biome Bioplastics Ltd., Plantic Technologies Ltd., Trinseo S.A., Kaneka Corporation, Arkema S.A., CJ CheilJedang / CJ Biomaterials, Biomer (Biomer GmbH), Toray Industries, Inc., Perstorp Holding AB, Solvay S.A., NaturePlast (Groupe Barbier) |
Market Opportunity
Agriculture and Food Waste Fuel the Next Bioplastic Boom
The initiatives, like waste-to-bioplastic production, are expected to become a cornerstone for future industry gains. Moreover, several companies are focused on reducing dependence on the regular food crops like corn and others for the development of plastic instead of using agricultural waste and municipal food waste in recent years. Also, the manufacturers can gain major industry advantages by establishing a collaboration with regional waste management companies during the projected period.
- In November 2023, the new startup called AgroRenew LLC was established in Knox County in the United States. Also, this newly launched plastic is likely to use food waste in the production of bioplastics.(Source : www.insideindianabusiness.com)
Market Challenge
Economic Constraints Slow Bioplastic Industry Growth
The higher cost of the bioplastic as compared to the regular plastic is likely to produce industry barriers in the coming years. Also, the bioplastic production methods, like long fermentation and other specialized processing, seem to be increasing the production cost of bioplastics. Also, the cost can limit market entry for new market entrants where the limited budget is the priority.
Segmental Insights
Material Type Insights
How did the Starch-Based Blends Segment Dominate the U.S. Biodegradable Plastics Market in 2024?
The starch-based blends segment held the largest share of the market in 2024, due to its easy processing and cost-effective properties. Moreover, the United States has seen under a huge corn starch availability, which primarily supports the segment growth in the country nowadays. Also, the United States manufacturers are increasingly using starch-based blends in films, bags, and food packaging in recent years.
The PHA segment is expected to grow at a notable rate during the predicted timeframe, owing to its versatility and any environmental adaptability. Furthermore, PHA has gained attention in sectors like textiles, packaging, and healthcare, akin to its thermal stability and biocompatibility. Also, these sectors are seen to expand, which is likely to create greater opportunities for the PHA segment during the forecast period, as per the industry expectations.
Product Form Insights
Why Does The Films Segment Dominate The U.S. Biodegradable Plastics Market By Product Form?
The films segment held the largest share of the U.S. biodegradable plastics market in 2024, as it is considered the direct replacement of single-use plastics in the current period. Moreover, several industrial sectors are actively seeking starch-based biodegradable films due to increased bans on polyethylene and polypropylene films in the United States nowadays. Also, having benefits like easy manufacturing and wide availability due to being integrated with the existing distribution channel, the film segment has gained industry attention in recent years.
The fibers and nonwovens segment is expected to grow at a notable rate in the market during the forecast period, as biodegradable plastics enter textiles, hygiene products, and medical applications. Non-wovens made from PLA or PHA are increasingly used in diapers, wipes, and feminine hygiene products, which are under scrutiny for generating long-lasting waste.
End Use Industry Insights
How Packaging Segment Dominate the U.S. Biodegradable Plastics Market in 2024?
The packaging segment dominated the market with the largest share in 2024 because it is the largest source of plastic waste and the first target for bans and sustainability pledges. Brands like Coca-Cola, Pepsi, and Unilever are investing heavily in biodegradable packaging for bottles, wrappers, and food containers to reduce environmental impact. Retailers and e-commerce giants are also transitioning to compostable mailers and films.
The medical & healthcare is expected to grow at a significant rate in the market during the forecast period, as biodegradable plastics become integral to safe and sustainable medical products. Materials like PLA and PHA are biocompatible, making them ideal for sutures, implants, tissue scaffolds, and drug delivery systems. Single-use medical items like gloves, syringes, and gowns are also being reimagined with biodegradable alternatives to reduce biomedical waste.
Compostability Insights
How did the Industrial Compostable Segment Dominate the U.S. Biodegradable Plastics Market in 2024?
The industrial compostable segment dominated the market with the largest share in 2024 because most biodegradable plastics today require controlled, high-heat environments to break down effectively. Industrial composting facilities provide the right temperature and conditions for PLA and starch-based plastics to degrade within months. Many state policies, such as California's, specifically mandate the use of industrially compostable packaging.
The marine biodegradable is expected to grow at a significant rate in the market during the forecast period, as plastic pollution in oceans becomes a central environmental crisis. U.S. policymakers, NGOs, and global treaties are increasingly targeting ocean plastics, pushing demand for materials that can break down safely in seawater. PHAs and new biopolymer innovations can degrade in marine environments without leaving harmful microplastics, making them ideal for fishing gear, packaging, and coastal industries.
Processing Technology Insights
Why Does The Extrusion Segment Dominate The U.S. Biodegradable Plastics Market By Processing Technology?
The extrusion segment dominated the market with the largest share in 2024 because it is the most widely used processing method for films, sheets, and packaging products. Biodegradable plastics like PLA and starch blends can be processed using standard extrusion equipment with minimal modification, making it cost-efficient for manufacturers.
The 3D printing filament production is expected to grow at a significant rate in the market during the forecast period, as additive manufacturing continues to grow across industries. PLA is already the most widely used filament in desktop 3D printing because of its ease of use, safety, and biodegradability. Future demand will expand into industrial 3D printing, where sustainable materials are increasingly valued for prototyping and small-batch production.
Feedstock Origin Insights
How can Corn/Maize Reform the U.S. Biodegradable Plastic Industry?
The corn/maize segment dominated the market with the largest share in 2024 because it is abundant, affordable, and deeply integrated into the agricultural economy. The U.S. has one of the world's largest corn supplies, making it a reliable feedstock for starch-based blends and PLA production. Using corn for bioplastics also leverages existing supply chains and processing facilities, reducing costs.
The waste-derived feedstock is expected to grow at a significant rate in the market during the forecast period, because of the dual benefit of reducing waste and producing sustainable materials. Instead of competing with food crops, waste-based sources such as agricultural residues, municipal food waste, or even algae offer a more circular and ethical production pathway. In the U.S., policies are pushing for reduced landfill waste and innovative recycling of organics, making waste-to-bioplastics a perfect fit.
U.S. Biodegradable Plastics Market Value Chain Analysis
- Distribution to Industrial Users: The distributors are linked to major sectors like packaging and agriculture in the United States.
- Chemical Synthesis and Processing: Majorly, bioplastics are synthesized microbiologically and even chemically, where processes like fermentation and others play a significant role.
- Regulatory Compliance and Safety Monitoring: The United States has a specialized regulatory standard for the testing of biodegradable plastic, such as the ASTM International standard, and others.
Recent Developments
- In September 2024, EcoPlastic Inc. introduced its latest product line of biodegradable plastic in the United States. Also, this newly launched biodegradable plastic is produced from natural resources, as per the company's claim.(Source: www.plastics-technology.com)
U.S. Biodegradable Plastics Market Top Companies
- NatureWorks LLC
- TotalEnergies Corbion
- BASF SE
- Novamont S.p.A.
- Braskem S.A.
- Danimer Scientific, Inc.
- Mitsubishi Chemical Corporation
- PTT MCC Biochem Co., Ltd.
- FKuR Kunststoff GmbH
- Biome Bioplastics Ltd.
- Plantic Technologies Ltd.
- Trinseo S.A.
- Kaneka Corporation
- Arkema S.A.
- CJ CheilJedang / CJ Biomaterials
- Biomer (Biomer GmbH)
- Toray Industries, Inc.
- Perstorp Holding AB
- Solvay S.A.
- NaturePlast (Groupe Barbier)
Segment Covered
By Material Type
- Starch-based blends
- Polylactic Acid (PLA)
- Polybutylene Adipate-co-Terephthalate (PBAT)
- Polybutylene Succinate (PBS)
- Polyhydroxyalkanoates (PHA)
- Polycaprolactone (PCL)
- Cellulose-based biodegradable polymers
- Other specialty biodegradable polymers
By Product Form
- Films
- Rigid articles (containers, trays, cups, lids)
- Fibers & nonwovens
- Foams
- Coatings & laminates
- Pellets/resin
By End-use Industry
- Packaging
- Foodservice disposables
- Agriculture
- Consumer goods
- Textiles & nonwovens
- Medical & healthcare
- Automotive & transportation
- Electronics & electrical
- Industrial & construction
By Compostability / Biodegradation Environment
- Industrial compostable
- Home compostable
- Soil biodegradable
- Marine biodegradable
- Anaerobic digestible
By Processing Technology
- Extrusion (film, sheet)
- Injection molding
- Blow molding
- Thermoforming
- Fiber spinning
- 3D printing filament production
By Feedstock Origin
- Corn/maize
- Sugarcane
- Cellulosic feedstock
- Vegetable oils/lipids
- Fossil-based biodegradable feedstock (e.g., PBAT)
- Waste-derived feedstock
List of Figures
- Figure 1. U.S. Biodegradable Plastics Market Size (USD 2.14 Billion), 2024–2034
- Figure 2. U.S. Biodegradable Plastics Market CAGR (9.44%), 2025–2034
- Figure 3. U.S. Biodegradable Plastics Market Share by Material Type, 2024 (Starch-based blends 42%, PLA 24%, PBAT 10%, PBS 8%, PHA 7%, PCL 4%, Cellulose-based 3%, Other specialty polymers 2%)
- Figure 4. U.S. Biodegradable Plastics Market Share by Product Form, 2024 (Films 55%, Rigid articles 20%, Fibers & nonwovens 10%, Foams 6%, Coatings & laminates 5%, Pellets/resin 4%)
- Figure 5. U.S. Biodegradable Plastics Market Share by End-use Industry, 2024 (Packaging 60%, Foodservice disposables 12%, Agriculture 9%, Consumer goods 7%, Textiles & nonwovens 5%, Medical & healthcare 4%, Automotive & transportation 2%, Electronics & electrical 1%, Industrial & construction <1%)
- Figure 6. U.S. Biodegradable Plastics Market Share by Compostability, 2024 (Industrial compostable 58%, Home compostable 18%, Soil biodegradable 14%, Marine biodegradable 10%)
- Figure 7. U.S. Biodegradable Plastics Market Share by Processing Technology, 2024 (Extrusion 50%, Injection molding 18%, Blow molding 12%, Thermoforming 8%, Fiber spinning 7%, 3D printing filament 5%)
- Figure 8. U.S. Biodegradable Plastics Market Share by Feedstock Origin, 2024 (Corn/maize 44%, Sugarcane 20%, Cellulosic 12%, Vegetable oils/lipids 8%, Fossil-based feedstock 8%, Waste-derived feedstock 8%)
- Figure 9. Competitive Landscape: Market Presence of Leading Companies, 2024
- Figure 10. Value Chain Analysis of the U.S. Biodegradable Plastics Market
List of Tables
- Table 1. U.S. Biodegradable Plastics Market Size (USD 2.14 Billion), 2024–2034
- Table 2. CAGR (9.44%) Comparison of Biodegradable Plastics vs Traditional Plastics, 2025–2034
- Table 3. U.S. Biodegradable Plastics Market Share by Material Type, 2024 (Starch-based blends 42%, PLA 24%, PBAT 10%, PBS 8%, PHA 7%, PCL 4%, Cellulose-based 3%, Other specialty polymers 2%)
- Table 4. U.S. Biodegradable Plastics Market Share by Product Form, 2024 (Films 55%, Rigid articles 20%, Fibers & nonwovens 10%, Foams 6%, Coatings & laminates 5%, Pellets/resin 4%)
- Table 5. U.S. Biodegradable Plastics Market Share by End-use Industry, 2024 (Packaging 60%, Foodservice disposables 12%, Agriculture 9%, Consumer goods 7%, Textiles & nonwovens 5%, Medical & healthcare 4%, Automotive & transportation 2%, Electronics & electrical 1%, Industrial & construction <1%)
- Table 6. U.S. Biodegradable Plastics Market Share by Compostability, 2024 (Industrial compostable 58%, Home compostable 18%, Soil biodegradable 14%, Marine biodegradable 10%)
- Table 7. U.S. Biodegradable Plastics Market Share by Processing Technology, 2024 (Extrusion 50%, Injection molding 18%, Blow molding 12%, Thermoforming 8%, Fiber spinning 7%, 3D printing filament 5%)
- Table 8. U.S. Biodegradable Plastics Market Share by Feedstock Origin, 2024 (Corn/maize 44%, Sugarcane 20%, Cellulosic 12%, Vegetable oils/lipids 8%, Fossil-based feedstock 8%, Waste-derived feedstock 8%)
- Table 9. Key Developments in the U.S. Biodegradable Plastics Market, 2023–2025
- Table 10. Company Profiles of Major Market Participants
A Seven-Phase Framework
Our methodology is designed to be universally applicable across commodity chemicals, specialty chemicals, petrochemicals, construction chemicals, coatings, electronic chemicals, industrial gases, agrochemicals, water treatment chemicals, and performance materials. Each phase builds upon the last, creating a layered validation structure that minimizes estimation error and maximizes analytical confidence.
The framework ensures comprehensive market coverage, robust cross-validation, and reliable long-term forecasting — producing market estimates that withstand scrutiny from investors, regulators, and corporate strategy teams.

Seven-Phase Framework — Analytical Effort Distribution
Relative analytical effort allocated across each phase of the Chemicals & Materials research framework

Phase 1 - Secondary Research: Establishing the Foundation
Secondary research collects and evaluates publicly available information from authoritative sources, establishing the foundational understanding of market structure, value chain dynamics, competitive landscape, and end-use demand patterns. Every source is evaluated for credibility, recency, geographic relevance, and methodological soundness before inclusion.
Industry Associations
Sources include ACC, CEFIC, ICCA, JCIA, CPCIF, and SOCMA providing production volumes, consumption trends, capacity developments, and sustainability initiatives.
Company Disclosures
Annual reports, investor presentations, earnings transcripts, and regulatory filings reveal product portfolios, manufacturing footprints, capacity expansions, and revenue segmentation.
Government Databases
National statistical offices, customs authorities, environmental agencies, and industrial production databases provide verified statistics on output, trade flows, and regulatory compliance.
Trade Databases
UN Comtrade, ITC, Eurostat, and national customs authorities enable assessment of global product movement, import dependency, and export competitiveness across regions.
Our Secondary Research Sources
- Ministry of Chemicals and Fertilizers
- European Chemicals Agency
- United States Department of Energy
- Ministry of Industry and Information Technology
- Ministry of Economy Trade and Industry
- Ministry of Trade Industry and Energy
- National Institute of Standards and Technology
- Council of Scientific and Industrial Research
- Fraunhofer Society
- National Institute for Materials Science
Phase 2 — Supply-Side Assessment: Mapping Production Capabilities
Production Capacity Analysis
All major manufacturers are assessed for existing installed capacity, planned additions, expansions, new plant announcements, and technology adoption — mapped at global, regional, and country levels.
Capacity Utilization Adjustment
Installed capacity is adjusted using utilization rates based on demand conditions, feedstock availability, plant operating rates, maintenance schedules, and regulatory restrictions.
Manufacturer Revenue Analysis
Product-specific revenues, segment-level performance, regional distribution, average selling prices, and margin trends are evaluated to establish market value estimates.
Supply-Side Assessment — Capacity vs. Effective Production by Region
Illustrative comparison of installed capacity vs. effective production volume (after utilization rate adjustment) across major regions

Phase 3 — Demand-Side Assessment: Quantifying Chemical Consumption
Demand-side analysis quantifies chemical consumption across industries, applications, and geographies — identifying where and how chemicals are consumed throughout the value chain with precision.
End-Use Industry Analysis
Chemical demand is evaluated across automotive, construction, packaging, electronics, agriculture, healthcare, consumer goods, industrial manufacturing, energy and utilities, and water treatment. Industry output, production trends, and consumption intensity are analyzed to determine demand patterns.
Consumption Modeling
Demand is estimated using measurable indicators: kilograms per vehicle, kilograms per square meter of construction, dosage per cubic meter of water treated, kilograms per hectare of agricultural land, and kilograms per ton of manufactured products. Consumption factors are validated through industry publications and primary interviews.
Application Analysis
The market is segmented by application area to understand product performance requirements, formulation trends, technology adoption, customer preferences, and regulatory requirements improving demand accuracy and segmentation granularity.
Demand-Side Assessment — End-Use Industry Demand Distribution
Illustrative distribution of chemical & materials demand across key end-use industries

Phase 4 - Trade Flow Analysis: Balancing Regional Supply and Demand
Trade flow analysis reconciles regional supply and demand estimates through import and export data, identifying net supply positions, regional dependencies, and market imbalances. It serves as an independent validation layer that tests the consistency of supply-side and demand-side estimates.
Import Analysis
Import data is evaluated to determine volumes, source countries, product dependency, regional supply gaps, and pricing trends — identifying markets that rely heavily on external supply and where domestic production is insufficient to meet demand.
Export Analysis
Export assessments reveal production surplus, export competitiveness, regional manufacturing strength, and global market participation. Export patterns also help validate domestic production estimates and identify net exporting regions.
Apparent Consumption Model
Regional consumption is assessed using the standard apparent consumption formula:
Results identify net importing regions, net exporting regions, regional deficits, and surpluses — serving as an independent validation of supply and demand estimates.
Trade Flow Analysis — Net Supply Position by Region
Illustrative apparent consumption vs. domestic production across major regions — positive gap indicates net import dependency

Phase 5 — Primary Research: The Critical Validation Layer
Primary research tests and refines findings from secondary research through direct engagement with industry participants across the supply chain, demand side, and expert community. It captures intelligence that no database or published report can provide — the real-world experience of manufacturers, buyers, and specialists operating in the market.

Supply-Side Interviews
Conversations with chemical manufacturers, raw material suppliers, contract manufacturers, technology providers, and plant operators cover production trends, capacity utilization, pricing developments, technology shifts, and competitive dynamics.

Demand-Side Interviews
Engagement with OEMs, industrial consumers, procurement managers, distributors, formulators, and end-use manufacturers focuses on consumption trends, purchasing behavior, product substitution, demand outlook, and emerging applications.

Industry Expert Consultations
Additional interviews with industry consultants, independent experts, regulatory specialists, technical professionals, and research institutions provide deeper market context and validate key analytical assumptions.
Focus Areas of Primary Research:
Market Size & Forecast Validation
Revenue estimates, volume consumption, growth rates, forecast assumptions, regional demand.Supply Chain & Value Chain Assessment
Raw material sourcing, supply chain challenges, distribution networks, procurement practices.Production & Capacity Analysis
Manufacturing capacity, utilization rates, expansion projects, plant investments.Pricing & Cost Structure Analysis
Product pricing trends, feedstock costs, energy costs, margin pressures, pricing outlook.Competitive Landscape Assessment
Volume and value estimates confirmed to be fully consistent with one another before publicationInterview Volume by Market Scope
| Study Scope | Number of Interviews |
|---|---|
| Niche Market | 20 – 30 |
| Mid-Sized Market | 30 – 50 |
| Global Market | 50 – 80 |
| Highly Fragmented Market | 80 – 120 |
Interview Details:
Category : Manufacturers, Suppliers, Distributors, End Users, Experts/Associations
Average Duration : 30–60 Minutes
Interview Mode : Video calls, telephonic interviews, expert consultations
Interview Format : Structured / Semi-Structured questionnaire
Focus Areas of Primary Research:
Market Size & Forecast Validation :
Revenue estimates, volume consumption, growth rates, forecast assumptions, regional demand.
Supply Chain & Value Chain Assessment :
Raw material sourcing, supply chain challenges, distribution networks, procurement practices.
Production & Capacity Analysis :
Manufacturing capacity, utilization rates, expansion projects, plant investments.
Pricing & Cost Structure Analysis :
Product pricing trends, feedstock costs, energy costs, margin pressures, pricing outlook.
Competitive Landscape Assessment :
Market share, competitor positioning, strategic initiatives, partnerships, acquisitions.
Primary Research — Stakeholder Coverage by Category
Distribution of interview respondents across stakeholder categories (% share from PPT data)

Primary Research — Respondent Designation Profile
Seniority breakdown of interview respondents (% share from PPT data)

Primary Research — Geographic Coverage of Interviews
Regional distribution of primary research engagement (% share from PPT data)

Phase 6 — Data Triangulation and Market Validation
No single methodology is relied upon in isolation. Multiple independent estimation approaches are combined and reconciled to ensure consistency, accuracy, and analytical defensibility. Any material deviations between approaches are investigated and adjusted through additional validation cycles.
The final market size is derived through weighted triangulation of all validated methodologies. Any material deviations between approaches are investigated and adjusted through additional validation cycles. The outcome represents the most realistic assessment of the market based on available evidence and expert confirmation ensuring that volume and value estimates are fully consistent with one another.
Triangulation Framework — Input Contribution Weight
Relative weight each sizing input contributes to the final reconciled market estimate

Phase 7 — Forecast Modeling: Projecting Future Market Evolution
Forecasting evaluates the future trajectory of the market using a combination of quantitative indicators and qualitative assessments across economic, industry, and regulatory dimensions. Rather than simple extrapolation, each driver is independently modeled and integrated into a composite forecast.
Macroeconomic Indicators
GDP growth, industrial production, manufacturing output, construction activity, consumer spending, and capital investment form the quantitative foundation of long-term demand projections. These are applied at country, regional, and global levels.
Industry Growth Drivers
Urbanization, infrastructure development, industrialization, technological innovation, sustainability initiatives, and evolving product performance requirements are assessed at regional and industry levels — capturing both structural and cyclical demand drivers.
Capacity Expansion Analysis
Announced plant expansions, new manufacturing facilities, technology upgrades, and strategic investments are evaluated to determine future supply-demand dynamics and potential market tightness or oversupply situations.
Regulatory & Sustainability
Environmental regulations, chemical safety standards, emission reduction targets, circular economy initiatives, and sustainability requirements are incorporated as they often influence product adoption rates and market growth trajectories.
Scenario Forecast Range — Indexed Market Growth (Year 1–10)
Illustrative indexed growth trajectories across Base, Optimistic, and Pessimistic scenarios over a 10-year forecast horizon

Forecast Drivers — Relative Impact Score by Category
Impact score (0–100) of each driver type on chemicals & materials market forecast




Comments
Share your thoughts, ask a question, or provide feedback about this report.