
Refinery Catalyst Market Size, Competitive Landscape Analysis Report 2035
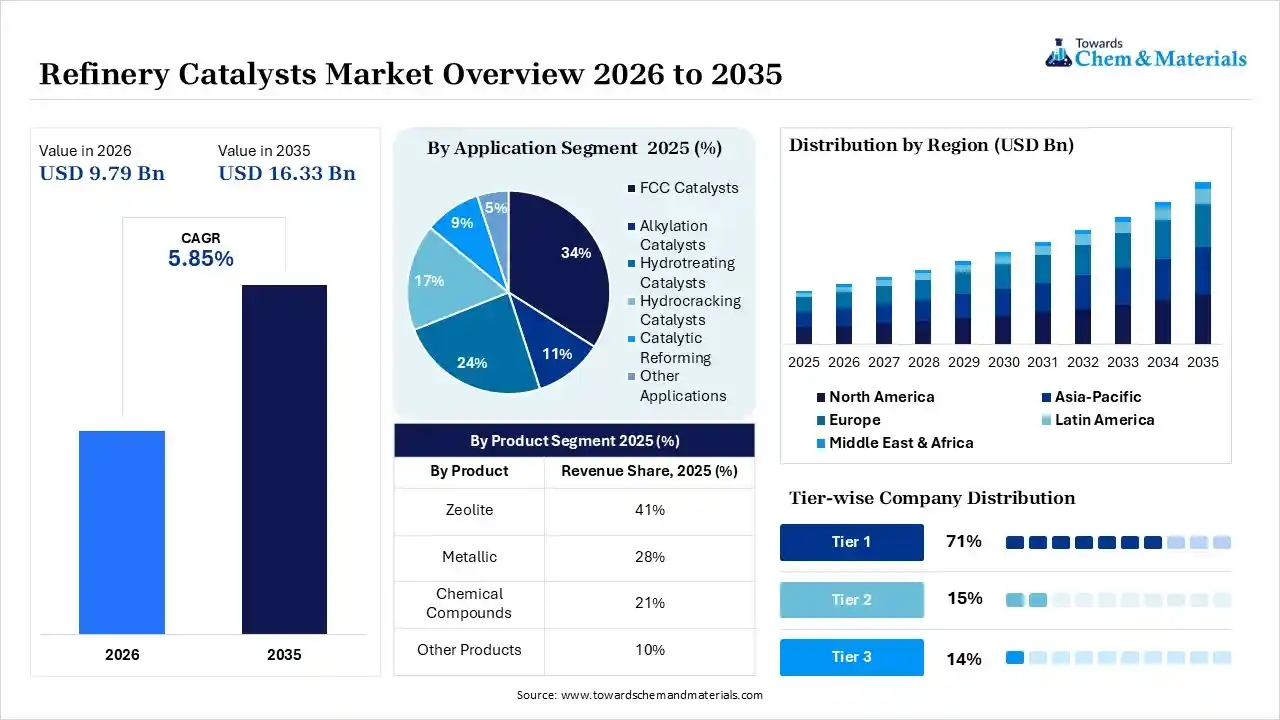
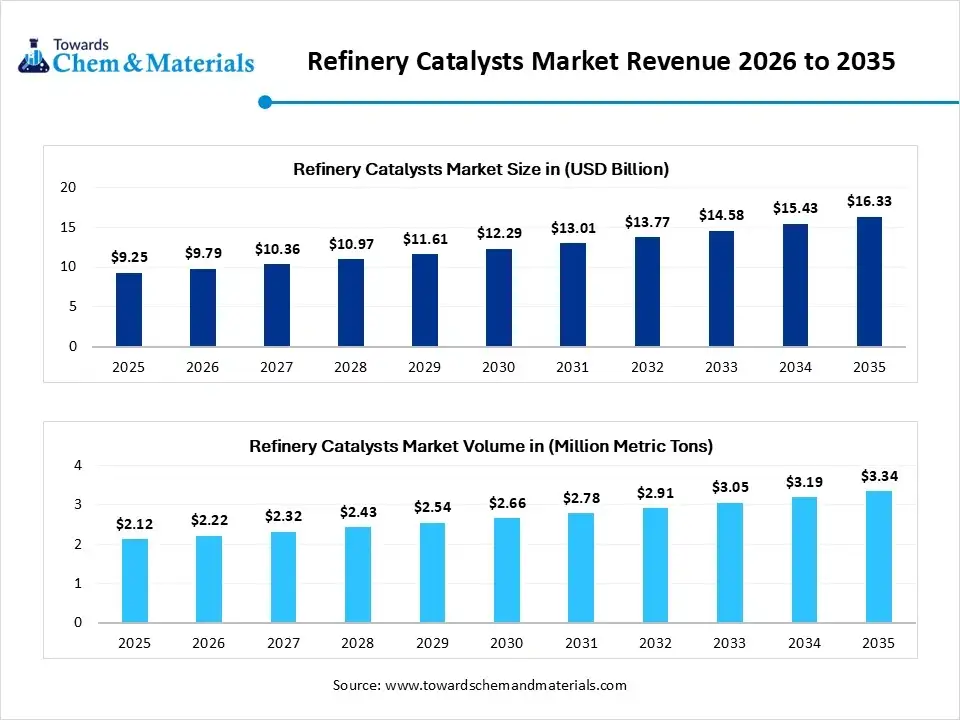
The global refinery catalyst market size was estimated at USD 9.25 billion in 2025 and is expected to increase from USD 9.79 billion in 2026 to USD 16.33 billion by 2035, growing at a CAGR of 4.35% from 2026 to 2035. Asia Pacific dominated the refinery catalyst market with the largest revenue share of 39% in 2025 and is expected to grow at the fastest CAGR of 5.98% during the forecast period.In terms of volume, the market is projected to grow from 2.12 million metric tons in 2025 to 3.34 million metric tons by 2035. growing at a CAGR of 5.95% from 2026 to 2035. Asia Pacific dominated the refinery catalyst market with the largest volume share of 40.12% in 2025. The increased need for high-octane fuel and stricter regulations on sulfur drive the market growth.
The refinery catalyst market growth is driven by growing refining activity, rapid industrialization, increased production of ultra-low sulfur diesel, development of high-performance vehicles, strong focus on energy transition, advancement in catalyst design, and focus on lowering energy use. the Refinery catalyst is a substance that speeds up chemical reactions in petroleum refining. The lower energy cost and enhances the product quality. Refinery catalyst converts low-value crude oil into valuable products. They are widely used in applications like hydrocracking, reforming, cracking, and hydrotreating. The examples of refinery catalysts are platinum, zeolites, cobalt-molybdenum, and hydrofluoric acid. The growth of the market is driven by the strict environmental benefits and mandates to produce ultra-low sulfur fuels, the need to optimize throughput from heavier and low-quality crude oils, and increased demand for high octane gasoline. The global market players such as BASF SE, Honeywell International, and Albemarle Corporation have launched advanced technology and invested heavily in the processing, which supports the market growth, according to the report.
Key Takeaways
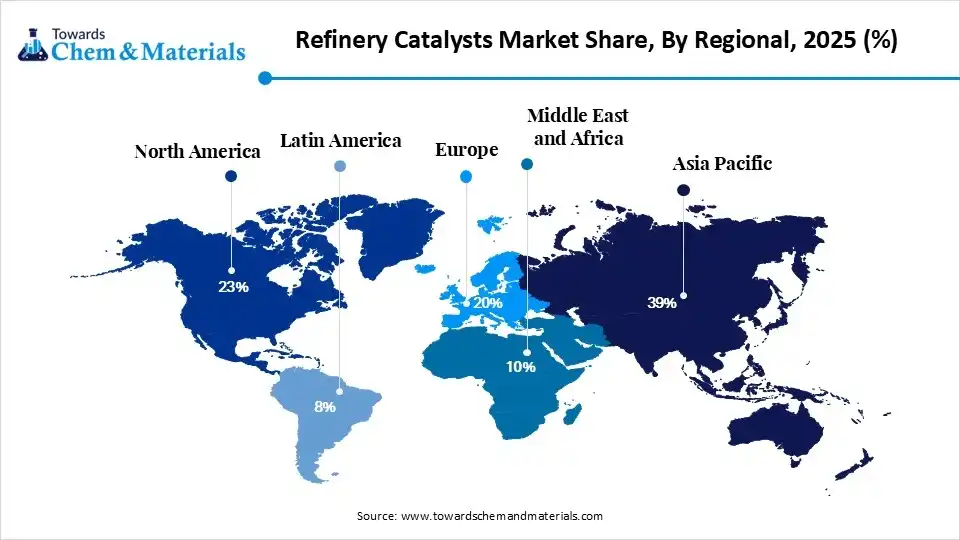
- By region, Asia Pacific dominated the market with a share of 39% in 2025. Expanding refining capacity increases catalyst consumption.
- By region, Europe held 20% market share in 2025 and is expected to experience the fastest growth with a CAGR of 6.90% in the forecast period. Cleaner fuel mandates encourage catalyst innovation.
- By product, the zeolite segment dominated the market with 41% share in 2025. Supports high catalytic activity in FCC units.
- By product, the metallic segment held 28% market share in 2025 and is expected to have the fastest growth with a CAGR of 6.40% in the forecast period. Expands due to ultra-low sulfur fuel requirements.
- By application, the FCC catalysts segment dominated the market with 34% share in 2025. Maximizes gasoline and olefin production.
- By application, the hydrocracking catalysts segment held 17% market share in 2025 and is expected to have the fastest growth with a CAGR of 6.80% in the forecast period. Supports processing of heavier feedstocks.
The refinery catalysts market supplies essential materials that enable efficient conversion of crude oil into high-quality transportation fuels, petrochemical feedstocks, and petroleum derivatives with added value. Catalysts help refineries achieve deeper chemical transformations, enhance process economics, and remove impurities to meet strict global emission standards. Strategic transactions like Honeywell’s acquisition of Catalyst Technologies emphasize a shift toward lower-emission fuels and sustainable aviation fuel production.
This market is mainly driven by stricter environmental regulations, the demand for ultra-low sulfur fuels, increased global refinery throughput, and greater petrochemical integration to maximize high-octane output. Refineries are processing heavier, more sour crudes, relying on advanced fluid catalytic cracking and upgrading catalysts to handle these complex feeds while maintaining throughput and equipment reliability.
- Additionally, catalysts boost economic benefits by increasing fuel yields and maximizing high-value fractions such as gasoline, petrochemical feedstocks, and cyclic aromatics, especially from heavy or tight oils. Cost efficiency and profit margins also drive growth, and modern dual-function catalysts offer operational flexibility, managing diverse feedstocks including renewable and tight oils, while resisting metal contamination and pressure fluctuations.
- For instance, Clariant, a specialty chemical company that focuses on sustainability, announced the launch of CATOFIN 1000, a next-generation propane dehydrogenation catalyst. This helps in improving selectivity and productivity, and improves catalyst lifetime, helping in optimizing plant operations and profitability.(Source: clariant.com)
Global Investment Flow for Refinery Catalysts Market 2026
- The global investment in refinery catalysts has increased due to the presence of major players for strengthening the refining processes, aligning with the sustainability initiatives that drive the growth of the market.
- Government-backed energy transition programs in Asia-Pacific, Europe, and North America continued directing funding toward refinery modernization, renewable diesel, SAF, and hydrogen projects, creating substantial investment opportunities for advanced refinery catalyst suppliers and technology developers.
- Refinery catalyst manufacturers such as Albemarle Corporation, BASF SE, Honeywell UOP, W. R. Grace, Axens, and Shell Catalyst & Technologies continued increasing investments in hydroprocessing, FCC, and clean-fuel catalyst technologies to meet growing demand for ultra-low-sulfur fuels and renewable fuels.
- For instance, HPCL Mittal Energy Limited announced a ₹2,600 crore investment in Guru Gobind Singh Refinery, Punjab, focused on specialty and fine chemicals, strengthening downstream refining and petrochemical value chains that rely on catalyst-intensive refining processes.(Source: hmel.in)
Refinery Catalyst Market Trends:
- Digital & Sustainable Integration:Machine learning and digital optimization, like Honeywell and Topsoe platforms, are extending catalyst lifespans by up to 15%, while R&D pushes toward cobalt-free formulations to bypass critical-metal price volatility.
- Ultra-Low Sulfur Mandates: Tightening environmental regulations like 10 ppm sulfur caps are accelerating demand for advanced hydrotreating and hydrocracking catalysts to produce ultra-low sulfur diesel and low-sulfur gasoline.
- Product & Technological Innovations:The transformation and innovation in product designing by companies is a growing trend as digital performance monitoring tools are extending catalysts, lifespans, and suppliers are shifting towards sustainable products.
Report Scope
| Report Attribute | Details |
| Market Size and Volume in 2026 | USD 9.79 Billion / 2.22 Million Metric Tons |
| Revenue Forecast in 2035 | USD 16.33 Billion / 3.34 Million Metric Tons |
| Growth Rate | CAGR 5.85% |
| Forecast Period | 2026 - 2035 |
| Base Year | 2025 |
| Dominant Region | Asia Pacific |
| Segment Covered | By Product, By Application, By Region |
| Key companies profiled | BASF (Germany), Topsoe (Denmark), Honeywell UOP (US), Clariant (Switzerland), Axens (France), Sinopec (China Petroleum and Chemical Corporation) (China), Exxon Mobil Corporation (US), Chevron Corporation (US), Evonik Industries AG (Germany), Arkema S.A. (France), Zeolyst International, Dow Chemical Company (US), Nippon Ketjen Co., Ltd. (Japan), JGC C&C (Japan), Dorf Ketal, Umicore (Belgium), W. R. Grace & Co., Albemarle Corporation, Johnson Matthey, Shell Catalysts & Technologies, Haldor Topsoe |
Refinery Catalysts Market: Technological Shift Through Innovation and Integration of AI
Refinery catalysts are shifting toward extreme selectivity and sustainability, driven by strict 10 ppm sulfur regulations and the energy transition. Innovations focus on nano-structured designs, machine learning life extension, and crude-to-chemical pivoting to maximize asset profitability. The AI is transforming the refinery catalysts market by enabling real-time recipe adjustments, precise predictive modeling for catalyst deactivation, and closed-loop optimization.
Key Technological Shifts in Refinery Catalyst Market:
The refinery catalyst market is undergoing key technological shifts driven by the demand for sustainability, higher yields, and lower operational costs. The technological innovations like nanotechnology, IoT, smart catalysts, bio-based catalysts, and software platforms integration help in lowering emissions. One of the key shifts is that the incorporation of AI lowers environmental impact and enhances efficiency.
Artificial Intelligence predicts the performance of the catalyst and manufactures a new catalyst in less time. AI maximizes product yield and monitors the real-time quality of products. AI screens materials rapidly and forecasts the deactivation of the catalyst. AI predicts the performance of a catalyst in diverse conditions and minimizes waste. Overall, AI optimizes the manufacturing process of refinery catalysts and increases the profitability of the sector.
Refinery Catalysts Regulatory Landscape
| Country / Region | Regulatory Body | Key Regulations | Focus Areas | Notable Notes |
| United States | Environmental Protection Agency; Department of Energy | Clean Air Act; Renewable Fuel Standard | Cleaner fuels, refinery efficiency, emissions reduction | The U.S. promotes advanced refinery catalysts to improve fuel quality and meet stringent emission standards. |
| European Union | European Commission; European Chemicals Agency | REACH Regulation; European Green Deal; Fuel Quality Directive | Low-sulfur fuels, sustainable refining | Europe emphasizes catalyst technologies that support cleaner fuel production and refinery decarbonization. |
| China | Ministry of Ecology and Environment; National Energy Administration | China VI Fuel Standards; Environmental Protection Law | Fuel quality improvement, refinery modernization | China is investing in advanced hydroprocessing and FCC catalysts to meet stringent fuel specifications. |
| India | Ministry of Petroleum and Natural Gas; Central Pollution Control Board | Bharat Stage VI (BS-VI) Fuel Standards; Environmental Protection Act | Ultra-low sulfur fuels, refinery upgrades | India is expanding refinery catalyst usage to support cleaner transportation fuels and petrochemical production. |
| Japan | Ministry of Economy, Trade and Industry | Energy Conservation Act; Fuel Quality Standards | High-efficiency refining, emissions control | Japan focuses on advanced catalyst technologies for energy-efficient and high-value refining operations. |
| Saudi Arabia | Ministry of Energy; Saudi Standards, Metrology and Quality Organization | National Fuel Specifications; Environmental Regulations | Refinery efficiency, petrochemical integration | Saudi Arabia is increasing the adoption of advanced refinery catalysts to maximize fuel output and downstream petrochemical production. |
Supply Chain Analysis of Refinery Catalysts Market
- Catalyst Production & Processing:Refinery catalysts are heterogeneous materials essential for converting crude oil into clean fuels and petrochemicals via chemical processes like fluid catalytic cracking and hydroprocessing.
- Their synthesis requires precise chemical engineering, involving steps such as sol-gel preparation, spray drying, ion exchange, and high-temperature calcination to achieve high activity and stability.
Refinery catalysts are produced through advanced chemical synthesis and impregnation processes using metals, zeolites, and other catalytic materials to enhance refining operations such as fluid catalytic cracking, hydroprocessing, alkylation, and reforming.
- Key players: W. R. Grace & Co., Albemarle Corporation, Johnson Matthey, Honeywell UOP.
- Quality Testing and Certification:Refinery catalyst quality testing and certification ensure performance, selectivity, and stability in critical conversion units like fluid catalytic cracking (FCC) and hydroprocessing.
- Independent screening benchmarks commercial formulations using advanced pilot plants and analytical instruments to validate operating margins before commercial loading.
- Key Authorities & Standards: American Petroleum Institute, International Organization for Standardization, ASTM International, U.S. Environmental Protection Agency
- Distribution to Industrial Users:Refinery catalysts are supplied to petroleum refineries, petrochemical complexes, fuel processing facilities, and specialty chemical manufacturers to improve conversion efficiency and product quality.Refinery catalyst distribution involves moving specialized zeolite or metallic catalysts from manufacturers like BASF SE and W. R. Grace and Co to industrial users like crude oil refineries.
- Specialized supply chain networks ensure the timely transport of bulk solid-state catalysts and zeolites to major refining regions like the Asia Pacific and North America.
- Key players: W. R. Grace & Co., Albemarle Corporation, Johnson Matthey.
Refinery Catalysts Market Dynamics
| Drivers | Restrains | Opportunities |
| Stricter Global Sulfur Caps:Mandates like Euro 6 limits and the IMO 2020 sulfur cap strictly limit impurities in transportation fuels. This requires intensive hydrotreating and hydrodesulfurization processes, increasing the consumption of specialized metallic catalysts. | Energy Transition & Alternative Fuels:The accelerating shift toward renewable energy sources, widespread Electric Vehicle adoption, and rising biofuel production are systematically reducing the long-term demand for conventional petroleum-based fuels. | Digital Process Optimization & Catalyst Longevity:Industry leaders like Honeywell and Topsoe are leveraging machine-learning platforms to predict deactivation and optimize catalyst regeneration, offering digital monitoring services. |
| Petrochemical Integration:Refineries are pivoting away from pure transport fuels, leaning into dual-function setups to produce petrochemical feedstocks like light olefins and aromatics. This relies heavily on sophisticated FCC additives to maximize yield. | Raw Material Volatility:The production of advanced catalysts is highly dependent on critical and precious metals. Significant price fluctuations in cobalt, platinum group metals, and other critical raw materials create operational uncertainty and limit market expansion. | Ultra-Low-Sulfur Fuel Processing:Stricter global sulfur-cap regulations are driving massive demand for advanced hydrotreating and hydrocracking catalysts. Refiners are heavily investing in processing heavy crude oils into Ultra-Low-Sulfur Diesel and low-sulfur gasoline. |
| Operational Efficiency & Analytics:To maximize margins, refineries use AI-driven machine-learning analytics to predict catalyst deactivation, extending catalyst lifespans. | Crude-to-Chemicals Complexes (COTC):Advanced refineries are increasingly using direct crude-to-chemicals configurations that bypass traditional fluid catalytic cracking and hydroprocessing units, directly reducing catalyst requirements. | Fluid Catalytic Cracking (FCC) & Additives:Opportunities are expanding for specialized zeolite catalysts and ZSM-5 additives that maximize gasoline octane numbers and boost light olefin yields such as propylene to feed petrochemical operations. |
Segmental Insights
Product Insights
The zeolite segment dominated the market with 41% share in 2025. This growth is driven by their high thermal stability, expansive surface area, and microporous structure, which make them highly efficient at converting heavy hydrocarbons into lighter, value-added products like gasoline and light olefins. Collaborations like those between Zeolyst International and Valoregen are boosting zeolite value by applying it to cutting-edge polymer recycling, which fuels the growth of the market.
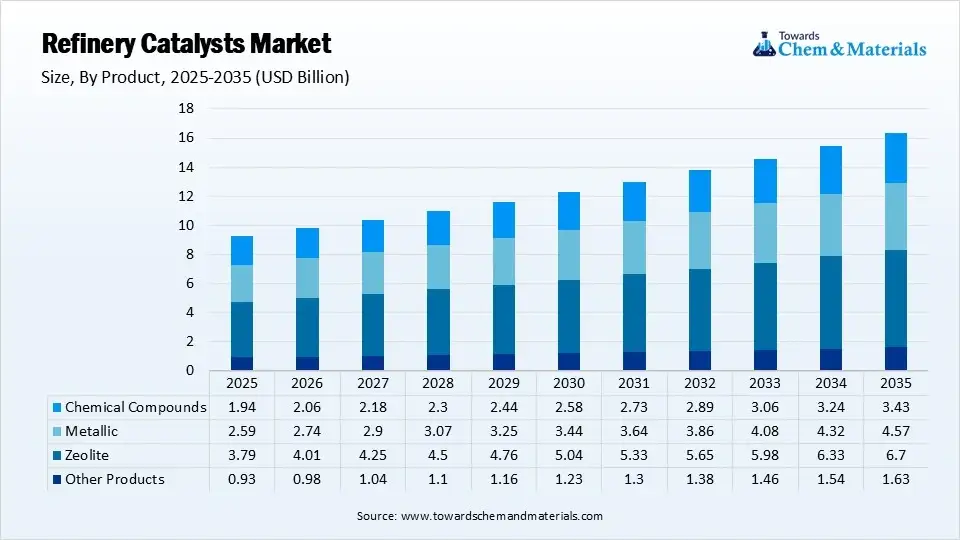 The metallic segment held 28% market share in 2025 and is expected to have the fastest growth with a CAGR of 6.40% in the forecast period. This growth is driven by rising demand for ultra-low sulfur fuels and the need to process heavier, lower-quality crude oils. The emergence of novel bimetallic and trimetallic formulations delivers higher hydrogenation activity and greater tolerance toward feedstock contaminants.
Refinery Catalysts Market Share, By Product, 2025 (%)
| By Product | Revenue Share, 2025 (%) |
| Zeolite | 41% |
| Metallic | 28% |
| Chemical Compounds | 21% |
| Other Products | 10% |
Application Insights
The FCC catalysts segment dominated the market with 34% share in 2025. It experiences significant expansion due to its essential role in converting heavy crude fractions into high-octane gasoline and valuable petrochemical olefins. Refiners invest heavily in upgrading lower-cost, heavier crude oils, which necessitates robust, heat-balanced FCC catalyst technologies. Refiners increasingly use FCC units alongside zeolite ingredients to pivot toward light olefin production for plastics, fueling the growth of the market.
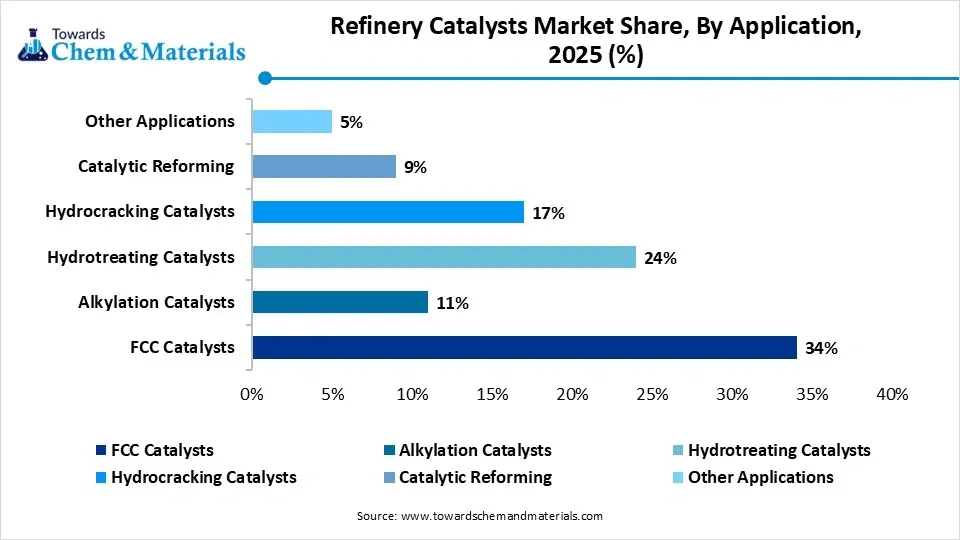
The hydrocracking catalysts segment held 17% market share in 2025 and is expected to have the fastest growth with a CAGR of 6.80% in the forecast period, driven by the global push to upgrade heavy crude fractions into lighter, purer, and cleaner transport fuels. Refineries are processing more complex, heavy crude oil reserves, relying on hydrocracking to break down heavier feedstocks with minimal coke production.
Refinery Catalysts Market Share, By Application, 2025 (%)
| By Application | Revenue Share, 2025 (%) |
| FCC Catalysts | 34% |
| Alkylation Catalysts | 11% |
| Hydrotreating Catalysts | 24% |
| Hydrocracking Catalysts | 17% |
| Catalytic Reforming | 9% |
| Other Applications | 5% |
Regional Analysis
How did Asia Pacific dominate the Refinery Catalysts Market in 2025?
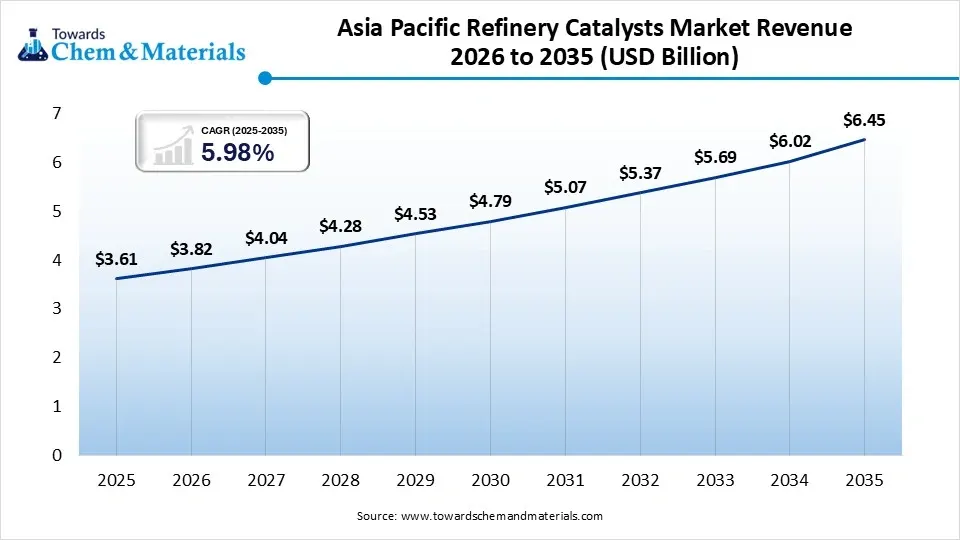
The Asia Pacific refinery catalysts market size was estimated at USD 3.61 billion in 2025 and is projected to reach USD 6.45 billion by 2035, growing at a CAGR of 5.98% from 2026 to 2035.Asia Pacific dominated the market with a share of 39% in 2025. This regional supremacy is driven by rapid industrialization, massive refining capacity expansions, and strict emission regulations across emerging economies. Continuous investments in large-scale manufacturing and refining facilities in economic powerhouses like China and India drove sustained, high-volume demand. Stringent regional environmental regulations are pushing for the production of low-sulfur and high-octane transportation fuels.
India
- Government policies promoting petroleum, chemicals, and petrochemicals investment regions are driving refiners to upgrade equipment to maximize high-value petrochemical feedstocks.
- The rollout of Bharat Stage VI (BS-VI) standards necessitates extensive hydrotreating and hydrocracking to produce ultra-low-sulfur diesel (ULSD) and low-sulfur gasoline. This directly increases catalyst consumption.
China
- China's refinery catalysts market growth is primarily driven by stringent environmental regulations mandating cleaner fuels, rising domestic demand for petrochemical feedstocks, and the continuous optimization of refining infrastructure by state giants like Sinopec and PetroChina.
- Stringent government policies enforcing ultra-low sulfur standards (like China VI) accelerate the consumption of advanced hydrotreating and hydrocracking catalysts to remove impurities from crude oil.
Europe Refinery Catalysts Market Growth Factor
Europe held the market share of 20% in 2025 and is expected to experience the fastest growth with a CAGR of 6.90% in the forecast period. This growth is primarily driven by strict European Union environmental mandates, a regional shift toward ultra-low sulfur fuels, and the necessity to process heavier crude oils efficiently. The European Union's aggressive decarbonization goals and tight limits on sulfur and nitrogen emissions push refineries to heavily invest in advanced hydrotreating and hydrocracking technologies.
Germany
- Existing German plants are continuously upgrading to handle lower-quality crude feedstocks, raising the demand for advanced, impurity-tolerant fluid catalytic cracking and zeolite catalysts.
- The country's aggressive market stance is sustained by robust, localized R&D and the heavy domestic footprint of major global catalyst producers like BASF SE, Evonik Industries AG, Clariant International Ltd., and Johnson Matthey Plc.
Italy
- European mandates limiting sulfur content, like ultra-low-sulfur diesel and gasoline, force Italian refineries to heavily utilize hydrotreating and hydrocracking catalysts.
- Italy heavily imports crude oil to process and re-export as refined petroleum products. Maintaining this competitive export edge relies on maximizing conversion rates and operational efficiency via high-performance catalysts
North America Refinery Catalysts Market Growth Factor
North America held the market share of 23% in 2025. Growth is primarily driven by stringent EPA regulations demanding ultra-low sulfur diesel/gasoline, shale oil processing, and a massive regional base of secondary upgrading units. Strict regulatory frameworks enforced by the U.S. Environmental Protection Agency limit sulfur content in transportation fuels. This drives high demand for hydrotreating, hydrocracking, and fluid catalytic cracking units to produce ultra-low sulfur diesel and gasoline.
United States
- The United States operates a massive footprint with a production rate of 15.3 million barrels per day (bpd) & 61,200 million barrels of oil reserves. This vast volume requires continuous optimization, catalyst replacement, and secondary processing units to handle heavy crude and shale oil.
- The shift toward alternative feedstocks like shale gas and major investments in the eFuels sector, such as Twelve's $645 million funding, stimulate advanced catalyst formulations.
Canada
- Canada's net-zero emissions targets by 2050 are accelerating technological upgrades and the integration of bio-refinery catalysts like biofuel transesterification.
- Canada possesses vast unconventional and heavy oil reservoirs. Specialized catalysts are required to upgrade these heavy crudes and manage residue processing
Latin America Refinery Catalysts Market Growth Factor
Latin America held the market share of 8% in 2025, driven by rising transportation fuel demand, strict environmental regulations enforcing ultra-low sulfur fuels, and the need to process heavier crude oils efficiently. Governments are imposing strict 10 ppm sulfur limits for gasoline and diesel, requiring advanced hydrotreating and hydrocracking catalysts. Increasing urbanization and transportation industries in key economies like Brazil are boosting overall petroleum throughput.
Refinery Catalysts Market Share, By Regional, 2025 (%)
| Regional | Revenue Share, 2025 (%) |
| North America | 23% |
| Europe | 20% |
| Asia-Pacific | 39% |
| Latin America | 8% |
| Middle East & Africa | 10% |
Brazil
- Stricter environmental regulations require refining catalysts like hydrotreating and FCC to remove sulfur, producing ultra-low sulfur diesel and high-octane gasoline for the massive domestic transportation market.
- Brazil's shift toward upgrading and refining local heavy, challenging crude oils demands technologically advanced catalysts to maintain conversion efficiency.
Argentina
- The configuration of regional plants, highlighted by major regional research, includes Argentina's La Plata hydrocracker. This specific unit adds 600 tons of incremental annual catalyst demand.
- The enforcement of strict emission standards and ULSD rules demands specialized hydrocracking and hydrotreating catalysts to remove impurities and lower sulfur content.
Middle East and Africa Refinery Catalysts Market Growth Factor
The Middle East and Africa held the market share of 10% in 2025, driven by large-scale refining capacity additions, liquids-to-chemicals projects, and rising regulatory pressures to produce ultra-low sulfur fuels. Massive downstream investments by industry leaders, such as the expansions by Saudi Aramco and Total SATORP, are shifting focus toward maximizing petrochemical feedstocks like propylene directly from crude. Rapid industrialization and modernization of existing refining infrastructure across GCC countries drive the ongoing need for catalyst handling, screening, and replenishment during scheduled turnarounds.
 Saudi Arabia
- The Kingdom's Downstream Development Strategy under Vision 2030 aims to heavily enhance refining capacity, boosting the need for processes like hydrocracking and desulfurization.
- GCC mandates the reduction of sulfur content in motor gasoline and diesel fuels to below 10 ppm, necessitating advanced hydrotreating and desulfurization catalysts.
UAE
- The UAE is shifting its refining portfolio from just producing transportation fuels to maximizing petrochemical feedstock yields. Catalysts that enable deep catalytic cracking (DCC) and fluid catalytic cracking (FCC) are highly sought after to convert heavy residues into light olefins.
- Backed by state operators like ADNOC, the region relies on heavy investments in advanced processing infrastructure. These mega-facilities require high-performance, stable catalyst technologies to optimize profitability amid crude volatility.
Recent Developments
- In April 2025, Clariant collaborated with Technip Energies to launch a new catalyst, StyroMax UL-100, for unprecedented low steam-to-oil ratios in the production of styrene. The catalyst offers high selectivity, enhanced sustainability performance, badger technology integration, and lower energy consumption.(Source: www.clariant.com)
- In October 2025, Ketjen Corporation is divesting its 50% stake in Eurecat SA and its Isomerization Catalysts business to Axens SA, allowing Axens to assume full ownership of Eurecat pending regulatory approval. While transitioning from a joint venture partner, Ketjen will enhance its partnership with Eurecat for advanced catalyst services, including regeneration and rejuvenation.(Source: businesswire.com)
Competitive Analysis
Companies are investing in high-performance fluid catalytic cracking (FCC), hydroprocessing, and residue upgrading catalysts to improve fuel yields and operational efficiency. Strategic collaborations with refiners and technology licensors are enabling catalyst suppliers to strengthen long-term contracts and expand their global customer base.
Major players in the refinery catalysts market, like W. R. Grace & Co., Albemarle Corporation, BASF SE, Honeywell UOP, and Clariant, which compete through advanced catalyst technologies and refinery process optimization solutions. The company focuses on the production of advanced and sustainable materials, which is a competitive advantage in recent periods.
A prominent joint venture established between W.R. Grace & Co. and Chevron Products Company. The collaboration focuses heavily on manufacturing and marketing advanced hydroprocessing catalysts and advanced refining technologies.
Refinery Catalysts Market: Key Offerings and Strengths
| Company | Company Type/Position | Major Headquarters | Geographic Presence | Refinery Catalyst Offerings | Strengths |
| W. R. Grace & Co. | Leading refinery catalyst manufacturer | Columbia | North America, Europe, Asia Pacific, Middle East | Fluid Catalytic Cracking catalysts, hydroprocessing catalysts, and catalyst additives | Strong FCC catalyst portfolio and extensive refinery process expertise |
| Albemarle Corporation | Global catalyst and specialty chemicals supplier | Charlotte | North America, Europe, Asia Pacific, Latin America | FCC catalysts, hydrocracking catalysts, residue upgrading catalysts | Advanced catalyst technologies focused on fuel yield optimization and cleaner fuels |
| Johnson Matthey | Sustainable technologies and catalyst provider | London | Europe, North America, Asia Pacific, Middle East | Hydrotreating catalysts, hydrocracking catalysts, process technologies | Strong expertise in low-sulfur fuel production and refining efficiency enhancement |
| Shell Catalysts & Technologies | Integrated refining technology and catalyst supplier | The Hague | Global operations across major refining regions | Hydroprocessing catalysts, residue upgrading catalysts, refining process technologies | Integrated catalyst-process solutions and global refinery support network |
| Haldor Topsoe | Leading catalyst and process technology provider | Lyngby | Europe, Asia Pacific, North America, Middle East | Hydrotreating, hydrocracking, sulfur recovery, and renewable fuel catalysts | Strong innovation in clean fuels, renewable refining, and emission reduction technologies |
Other Top Players Are
- BASF (Germany)
- (Denmark)
- Honeywell UOP (US)
- Clariant (Switzerland)
- Axens (France)
- Sinopec (China Petroleum and Chemical Corporation) (China)
- Exxon Mobil Corporation (US)
- Chevron Corporation (US)
- Evonik Industries AG (Germany)
- Arkema S.A. (France)
- Zeolyst International
- Dow Chemical Company (US)
- Nippon Ketjen Co., Ltd. (Japan)
- JGC C&C (Japan)
- Dorf Ketal
- Umicore (Belgium)
Segments Covered
By Product
- Zeolite
- Y-Zeolite
- ZSM-5 Zeolite
- Ultra-Stable Y Zeolite
- Metallic
- Platinum-Based Catalysts
- Palladium-Based Catalysts
- Nickel-Based Catalysts
- Molybdenum-Based Catalysts
- Chemical Compounds
- Alumina-Based Compounds
- Silica-Alumina Compounds
- Tungsten Compounds
- Cobalt Compounds
- Other Products
- Rare Earth Catalysts
- Mixed Oxide Catalysts
- Specialty Catalyst Blends
By Application
- FCC Catalysts
- Resid FCC Catalysts
- Maximum Gasoline Yield FCC Catalysts
- Propylene Maximization FCC Catalysts
- Alkylation Catalysts
- Sulfuric Acid-Based
- Solid Acid Catalysts
- Hydrotreating Catalysts
- Diesel Hydrotreating
- Naphtha Hydrotreating
- Resid Hydrotreating
- Hydrocracking Catalysts
- Single Stage Hydrocracking
- Two Stage Hydrocracking
- Catalytic Reforming
- Continuous Regeneration Reforming
- Semi-Regenerative Reforming
- Other Applications
- Isomerization
- Delayed Coking
- Resid Upgrading
By Region
- North America
- U.S.
- Canada
- Mexico
- Europe
- Germany
- UK
- France
- Italy
- Spain
- Asia Pacific
- China
- India
- Japan
- South Korea
- Latin America
- Brazil
- Argentina
- Middle East & Africa
- Saudi Arabia
- South Africa
A Seven-Phase Framework
Our methodology is designed to be universally applicable across commodity chemicals, specialty chemicals, petrochemicals, construction chemicals, coatings, electronic chemicals, industrial gases, agrochemicals, water treatment chemicals, and performance materials. Each phase builds upon the last, creating a layered validation structure that minimizes estimation error and maximizes analytical confidence.
The framework ensures comprehensive market coverage, robust cross-validation, and reliable long-term forecasting — producing market estimates that withstand scrutiny from investors, regulators, and corporate strategy teams.

Seven-Phase Framework — Analytical Effort Distribution
Relative analytical effort allocated across each phase of the Chemicals & Materials research framework

Phase 1 - Secondary Research: Establishing the Foundation
Secondary research collects and evaluates publicly available information from authoritative sources, establishing the foundational understanding of market structure, value chain dynamics, competitive landscape, and end-use demand patterns. Every source is evaluated for credibility, recency, geographic relevance, and methodological soundness before inclusion.
Industry Associations
Sources include ACC, CEFIC, ICCA, JCIA, CPCIF, and SOCMA providing production volumes, consumption trends, capacity developments, and sustainability initiatives.
Company Disclosures
Annual reports, investor presentations, earnings transcripts, and regulatory filings reveal product portfolios, manufacturing footprints, capacity expansions, and revenue segmentation.
Government Databases
National statistical offices, customs authorities, environmental agencies, and industrial production databases provide verified statistics on output, trade flows, and regulatory compliance.
Trade Databases
UN Comtrade, ITC, Eurostat, and national customs authorities enable assessment of global product movement, import dependency, and export competitiveness across regions.
Our Secondary Research Sources
- Ministry of Chemicals and Fertilizers
- European Chemicals Agency
- United States Department of Energy
- Ministry of Industry and Information Technology
- Ministry of Economy Trade and Industry
- Ministry of Trade Industry and Energy
- National Institute of Standards and Technology
- Council of Scientific and Industrial Research
- Fraunhofer Society
- National Institute for Materials Science
Phase 2 — Supply-Side Assessment: Mapping Production Capabilities
Production Capacity Analysis
All major manufacturers are assessed for existing installed capacity, planned additions, expansions, new plant announcements, and technology adoption — mapped at global, regional, and country levels.
Capacity Utilization Adjustment
Installed capacity is adjusted using utilization rates based on demand conditions, feedstock availability, plant operating rates, maintenance schedules, and regulatory restrictions.
Manufacturer Revenue Analysis
Product-specific revenues, segment-level performance, regional distribution, average selling prices, and margin trends are evaluated to establish market value estimates.
Supply-Side Assessment — Capacity vs. Effective Production by Region
Illustrative comparison of installed capacity vs. effective production volume (after utilization rate adjustment) across major regions

Phase 3 — Demand-Side Assessment: Quantifying Chemical Consumption
Demand-side analysis quantifies chemical consumption across industries, applications, and geographies — identifying where and how chemicals are consumed throughout the value chain with precision.
End-Use Industry Analysis
Chemical demand is evaluated across automotive, construction, packaging, electronics, agriculture, healthcare, consumer goods, industrial manufacturing, energy and utilities, and water treatment. Industry output, production trends, and consumption intensity are analyzed to determine demand patterns.
Consumption Modeling
Demand is estimated using measurable indicators: kilograms per vehicle, kilograms per square meter of construction, dosage per cubic meter of water treated, kilograms per hectare of agricultural land, and kilograms per ton of manufactured products. Consumption factors are validated through industry publications and primary interviews.
Application Analysis
The market is segmented by application area to understand product performance requirements, formulation trends, technology adoption, customer preferences, and regulatory requirements improving demand accuracy and segmentation granularity.
Demand-Side Assessment — End-Use Industry Demand Distribution
Illustrative distribution of chemical & materials demand across key end-use industries

Phase 4 - Trade Flow Analysis: Balancing Regional Supply and Demand
Trade flow analysis reconciles regional supply and demand estimates through import and export data, identifying net supply positions, regional dependencies, and market imbalances. It serves as an independent validation layer that tests the consistency of supply-side and demand-side estimates.
Import Analysis
Import data is evaluated to determine volumes, source countries, product dependency, regional supply gaps, and pricing trends — identifying markets that rely heavily on external supply and where domestic production is insufficient to meet demand.
Export Analysis
Export assessments reveal production surplus, export competitiveness, regional manufacturing strength, and global market participation. Export patterns also help validate domestic production estimates and identify net exporting regions.
Apparent Consumption Model
Regional consumption is assessed using the standard apparent consumption formula:
Results identify net importing regions, net exporting regions, regional deficits, and surpluses — serving as an independent validation of supply and demand estimates.
Trade Flow Analysis — Net Supply Position by Region
Illustrative apparent consumption vs. domestic production across major regions — positive gap indicates net import dependency

Phase 5 — Primary Research: The Critical Validation Layer
Primary research tests and refines findings from secondary research through direct engagement with industry participants across the supply chain, demand side, and expert community. It captures intelligence that no database or published report can provide — the real-world experience of manufacturers, buyers, and specialists operating in the market.

Supply-Side Interviews
Conversations with chemical manufacturers, raw material suppliers, contract manufacturers, technology providers, and plant operators cover production trends, capacity utilization, pricing developments, technology shifts, and competitive dynamics.

Demand-Side Interviews
Engagement with OEMs, industrial consumers, procurement managers, distributors, formulators, and end-use manufacturers focuses on consumption trends, purchasing behavior, product substitution, demand outlook, and emerging applications.

Industry Expert Consultations
Additional interviews with industry consultants, independent experts, regulatory specialists, technical professionals, and research institutions provide deeper market context and validate key analytical assumptions.
Focus Areas of Primary Research:
Market Size & Forecast Validation
Revenue estimates, volume consumption, growth rates, forecast assumptions, regional demand.Supply Chain & Value Chain Assessment
Raw material sourcing, supply chain challenges, distribution networks, procurement practices.Production & Capacity Analysis
Manufacturing capacity, utilization rates, expansion projects, plant investments.Pricing & Cost Structure Analysis
Product pricing trends, feedstock costs, energy costs, margin pressures, pricing outlook.Competitive Landscape Assessment
Volume and value estimates confirmed to be fully consistent with one another before publicationInterview Volume by Market Scope
| Study Scope | Number of Interviews |
|---|---|
| Niche Market | 20 – 30 |
| Mid-Sized Market | 30 – 50 |
| Global Market | 50 – 80 |
| Highly Fragmented Market | 80 – 120 |
Interview Details:
Category : Manufacturers, Suppliers, Distributors, End Users, Experts/Associations
Average Duration : 30–60 Minutes
Interview Mode : Video calls, telephonic interviews, expert consultations
Interview Format : Structured / Semi-Structured questionnaire
Focus Areas of Primary Research:
Market Size & Forecast Validation :
Revenue estimates, volume consumption, growth rates, forecast assumptions, regional demand.
Supply Chain & Value Chain Assessment :
Raw material sourcing, supply chain challenges, distribution networks, procurement practices.
Production & Capacity Analysis :
Manufacturing capacity, utilization rates, expansion projects, plant investments.
Pricing & Cost Structure Analysis :
Product pricing trends, feedstock costs, energy costs, margin pressures, pricing outlook.
Competitive Landscape Assessment :
Market share, competitor positioning, strategic initiatives, partnerships, acquisitions.
Primary Research — Stakeholder Coverage by Category
Distribution of interview respondents across stakeholder categories (% share from PPT data)

Primary Research — Respondent Designation Profile
Seniority breakdown of interview respondents (% share from PPT data)

Primary Research — Geographic Coverage of Interviews
Regional distribution of primary research engagement (% share from PPT data)

Phase 6 — Data Triangulation and Market Validation
No single methodology is relied upon in isolation. Multiple independent estimation approaches are combined and reconciled to ensure consistency, accuracy, and analytical defensibility. Any material deviations between approaches are investigated and adjusted through additional validation cycles.
The final market size is derived through weighted triangulation of all validated methodologies. Any material deviations between approaches are investigated and adjusted through additional validation cycles. The outcome represents the most realistic assessment of the market based on available evidence and expert confirmation ensuring that volume and value estimates are fully consistent with one another.
Triangulation Framework — Input Contribution Weight
Relative weight each sizing input contributes to the final reconciled market estimate

Phase 7 — Forecast Modeling: Projecting Future Market Evolution
Forecasting evaluates the future trajectory of the market using a combination of quantitative indicators and qualitative assessments across economic, industry, and regulatory dimensions. Rather than simple extrapolation, each driver is independently modeled and integrated into a composite forecast.
Macroeconomic Indicators
GDP growth, industrial production, manufacturing output, construction activity, consumer spending, and capital investment form the quantitative foundation of long-term demand projections. These are applied at country, regional, and global levels.
Industry Growth Drivers
Urbanization, infrastructure development, industrialization, technological innovation, sustainability initiatives, and evolving product performance requirements are assessed at regional and industry levels — capturing both structural and cyclical demand drivers.
Capacity Expansion Analysis
Announced plant expansions, new manufacturing facilities, technology upgrades, and strategic investments are evaluated to determine future supply-demand dynamics and potential market tightness or oversupply situations.
Regulatory & Sustainability
Environmental regulations, chemical safety standards, emission reduction targets, circular economy initiatives, and sustainability requirements are incorporated as they often influence product adoption rates and market growth trajectories.
Scenario Forecast Range — Indexed Market Growth (Year 1–10)
Illustrative indexed growth trajectories across Base, Optimistic, and Pessimistic scenarios over a 10-year forecast horizon

Forecast Drivers — Relative Impact Score by Category
Impact score (0–100) of each driver type on chemicals & materials market forecast




Comments
Share your thoughts, ask a question, or provide feedback about this report.