
North America Adhesives And Sealants Market Size and Forecast 2026 to 2035
The north america adhesives and sealants market size is calculated at USD 16.02 billion in 2025 and is predicted to increase from USD 16.91 billion in 2026 and is projected to reach around USD 27.50 billion by 2035, The market is expanding at a CAGR of 5.55% between 2026 and 2035. The growing demand for fuel-efficient and lightweight vehicles is the key factor driving market growth. Also, a surge in activity in the automotive and construction industries, coupled with the growth of the medical industry, can fuel market growth further.
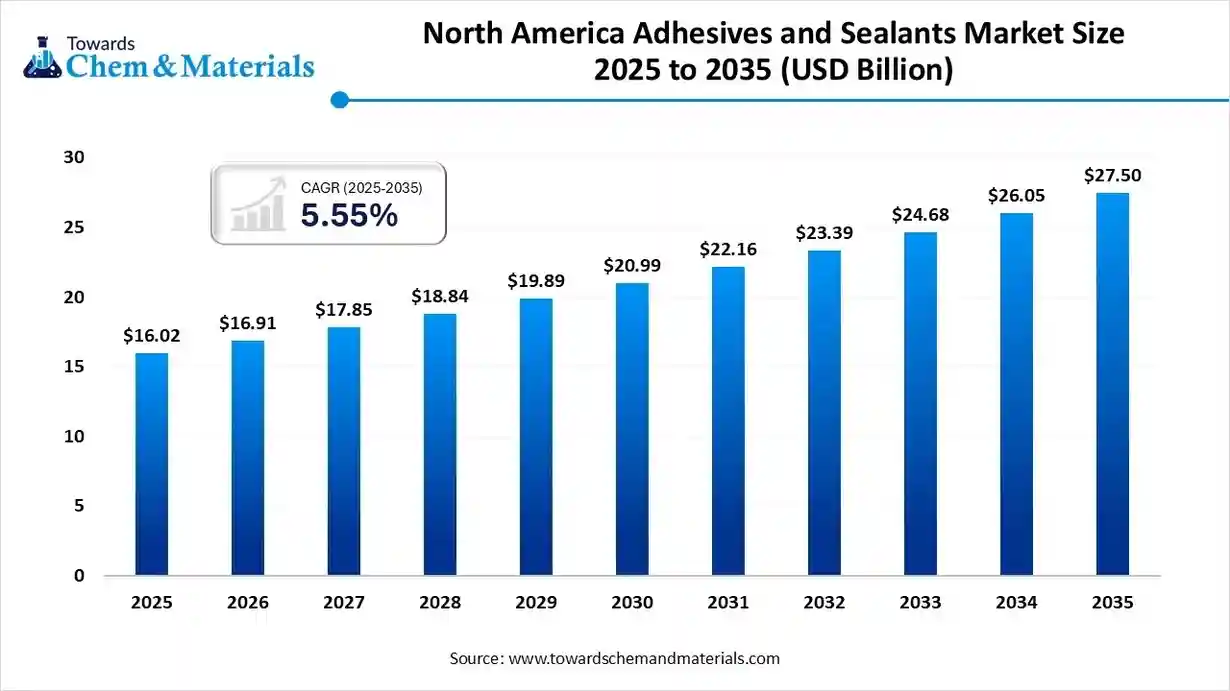
Key Takeaways
- By adhesive technology, the water-based segment accounted for the largest revenue share of 33.51% in 2025.
- By adhesive product, the acrylic adhesives segment dominated with the largest revenue share of 41.72% in 2025.
- By adhesive application, the paper and packaging segment dominated with the largest revenue share of 35.41% in 2025.
- By sealant product, the Silicones segment accounted for the largest revenue share of 39.19% in 2025.
- By sealant application, the construction segment dominated with the largest revenue share of 43.22% in 2025.
What are Adhesives And Sealants?
It is the global industry for chemical products that either bond materials together (adhesives) or fill gaps and create a protective barrier (sealants). Adhesives offer a strength to join surfaces, while sealants fill gaps to prevent the passage of gases and liquids and offer protection against elements such as moisture and chemicals. The market encompasses an extensive range of products used across various sectors.
North America Adhesives And Sealants Market Trends
- The ongoing shift towards sustainable products is the major trend in the market, shaping positive market growth. This shift is due to increasing consumer demand for greener products, which generally come with a lower environmental and health impact.
- The surging construction sector in the region, such as residential and non-residential projects and heavy government investments in newer infrastructure projects, is another major trend driving positive market expansion.
- The automotive industry's emphasis on enhancing fuel efficiency and minimizing emissions is driving the use of high-performance adhesives to replace conventional and heavier fasteners. These adhesives offer a strong bond with lighter materials, which is crucial for manufacturing electric vehicles (EVs).
- The rapid expansion of e-commerce is increasing the demand for durable, secure, and cost-effective packaging solutions. Adhesives are widely used in labelling, carton sealing, and flexible packaging, which leads to advancements in recyclable adhesives.
- The growing adoption of adhesives in medical devices showcases a significant market trend. This trend is fuelled by the benefits offered by adhesives, such as improved device functionality and enhanced patient outcomes. The medical adhesives sector includes various types, such as silicone, epoxy, and polyurethanes.
Report Scope
| Report Attribute | Details |
| Market Size Value in 2026 | USD 16.91 Billion |
| Revenue Forecast in 2035 | USD 27.50 Billion |
| Growth Rate | CAGR 5.55% |
| Forecast Period | 2026 - 2035 |
| Base Year | 2025 |
| Segments covered | By Adhesives Technology, By Adhesives Product, By Adhesives Application, By Sealants Product, By Sealants Application |
| Key companies profiled | Henkel Corporation , Sika AG, 3M, H.B. Fuller Company, Evonik Industries, RPM International Inc., Dow, Wacker Chemie AG, Arkema, Arkema Group |
How Cutting Edge Technologies are revolutionizing the North America Adhesives And Sealants Market?
Advance technologies are transforming the market through innovations such as nanotechnology, AI-powered formulation, analytics, and sensor-embedded adhesives. These advancements boost performance with improved durability and strength by increasing production efficiency through automation and AI. Furthermore, these adhesives can sense and react to environmental changes, allowing self-control and failure detection.
Trade Analysis of North America Adhesives And Sealants Market: Import & Export Statistics:
- Between June 2024 to May 2025, the United States imported 1,427 shipments of sealants, with the growth rate of 29% compared to the previous year. These imports involved 548 foreign exporters and were delivered to 559 U.S. buyers.
- In 2024, Canada exported C$128M of Glues, being the 378th most exported product in Canada.
- In 2024, the main destinations of Canada's glue exports were: the United States (C$115M), the United Kingdom (C$4.71M), Mexico (C$719k), South Africa (C$715k), and Jamaica (C$668k).
- Canada's imports from India of "Prepared glues and other prepared adhesives, products suitable for use as glues" reached US$109.42 thousand in 2024, according to the United Nations COMTRADE database on international trade.
North America Adhesives And Sealants Market Value Chain Analysis
- Feedstock Procurement : It involves the sourcing of key raw materials such as polyurethanes, silicones, epoxy resins, and various other polymers, many of which are petrochemical derived.
- Major Players: Dow Inc., Huntsman Corporation
- Chemical Synthesis and Processing : It refers to the industrial process of artificially executing chemical reactions to manufacture specific adhesive and sealant products. This stage also involves the manufacturing of raw materials and the development of advanced chemical formulations.
- Major Players: The Dow Chemical Company, Avery Dennison Corporation.
- Packaging and Labelling : It refers to a major stage where adhesives are used to bond and seal various packaging materials. The adhesives used in flexible packaging, carton sealing, and labeling across various industries.
- Major Players: Henkel AG & Co. KGaA, H.B. Fuller Company.
- Regulatory Compliance and Safety Monitoring: This stage emphasizes reducing volatile organic compounds (VOCs) and toxic substances through regulations from bodies such as the EPA. It also involves proper handling, labeling, and tackling workplace exposure risks.
- Major Players: RPM International Inc., Huntsman Corporation.
North America Adhesives And Sealants Market 's Regulatory Landscape: Global Regulations
| Country/Region | Key Regulations |
| United States | The U.S. Environmental Protection Agency (EPA) enforces national VOC regulations, while states like California and those in the Ozone Transport Commission (OTC) have their own stricter rules. |
| Canada | The Canadian federal government introduced the Volatile Organic Compound Concentration Limits for Certain Products Regulations under the Canadian Environmental Protection Act, which came into effect on January 1, 2024. |
| Mexico | The Mexican government has imposed temporary import restrictions on certain chemicals, including some that might be used in the production of adhesives. |
Segmental Insights
Adhesives Technology Insights
How Much Share Did the Water-Based Segment Held in 2025?
The water-based segment dominated the market with the largest share of 33.51% in 2025. The dominance of the segment can be attributed to its wide applications in the construction, automotive, leather, and furniture industries. These adhesives are favoured due to their non-flammable nature.
The solvent-based segment is expected to grow at the fastest CAGR over the forecast period. The growth of the segment can be credited to its unique performance and characteristics, which lead to its wide application across different sectors.
The growth of the hot melt segment can be driven by growing product demand from key industries such as automotive and construction. There is an increasing demand for hot melt adhesives in the medical devices and personal hygiene products.
The other technology segment held a significant market share in 2025. The growth of the segment can be fuelled by the growing use of UV-cured adhesives for more efficient and faster processes, coupled with the growing demand for low-VOC and sustainable formulations.
Adhesives Product Insights
Which Adhesives Product Type Segment Dominated the North America Adhesives And Sealants Market in 2025?
The acrylic adhesives segment held the largest market share of 41.72% in 2025. The dominance of the segment can be linked to the growing number of construction projects and the growth of the packaging industry. These adhesives are known for their fast-setting times and excellent environmental resistance.
The ethylene vinyl acetate (EVA) adhesives segment is expected to grow at the fastest CAGR over the forecast period. The growth of the segment can be driven by a surge in solar energy adoption and growing demand for flexible packaging across various manufacturing sectors.
The epoxy segment held a major market share in 2025. The growth of the segment can be boosted by increasing emphasis on lightweight materials in vehicles and rising infrastructure development. Epoxy adhesives are crucial for construction projects because of their high durability and flexibility.
The growth of the polyurethanes segment can be driven by the growing demand for sustainable building practices and low-VOC products. Polyurethanes offer durability, strength, and resistance to weather, which makes them ideal for various applications.
Adhesives Application Insights
Which Adhesives Application Type Segment Dominated the North America Adhesives And Sealants Market in 2025?
The paper and packaging segment dominated the market share of 35.41% in 2025. The dominance of the segment is owing to the surge in use of adhesives in different packaging applications, such as labelling, carton sealing, and flexible packaging. The rapid shift towards eco-friendly packaging solutions is further driving segment growth.
The furniture and woodworking segment is expected to grow at the fastest CAGR over the forecast period. The growth of the segment is due to ongoing urbanization and the surge in commercial and residential construction activities across the globe.
The automotive & transportation segment held a significant market share in 2024. The growth of the segment can be fuelled by the growing demand for innovative bonding solutions for components and batteries. Adhesives are used on materials such as composites and plastics.
The growth of the building & construction segment can be boosted by growing emphasis on green building practices, along with the increasing adoption of prefabricated construction methods. A surge in remodelling and renovation activities across the region is further contributing to segment growth.
Sealants Product Insights
How Much Share Did the Silicones Segment Held in 2025?
The silicones segment held the largest market share of 39.19% in 2025. The dominance of the segment can be attributed to the growing use of silicone sealants in several applications due to their excellent properties, such as chemical stability, high flexibility, and weather resistance.
The acrylic sealants segment is expected to grow at the fastest CAGR over the forecast period. The growth of the segment can be credited to its easy printability and compatibility with most materials. They are extensively used in sealing and bonding applications in the building sector.
The polyurethanes segment held a major market share in 2025. The growth of the segment is due to the ongoing pursuit of sustainable and high-performance materials coupled with the favourable government regulations that support eco-friendly and low-VOC products.
The growth of the polyvinyl acetate segment can be driven by the expanding e-commerce sector in the U.S. and Canada, along with the growing need for PVA adhesives for paper-based packaging, bags, and labels. PVA's versatility makes it a preferred choice for a wide range of applications.
Sealants Application Insights
Which Sealants Application Type Segment Dominated the North America Adhesives And Sealants Market in 2025?
The construction segment dominated the market with the largest share of 43.22% in 2025. The dominance of the segment can be linked to the growing use of sealant in different construction applications such as waterproofing, glazing, and insulation. Also, the increasing need for energy-efficient buildings can fuel segment growth soon.
The packaging segment is expected to grow at the fastest CAGR during the projected period. The growth of the segment can be driven by its growing demand for packaged food and beverages and the rise in the e-commerce industry. Sealants play an important role in the packaging industry.
The automotive segment held a significant market share in 2025. The growth of the segment can be boosted by the growing production of lightweight and electric vehicles, which necessitates specialized bonding solutions for structural and assembly components.
The growth of the consumer segment can be propelled by the growth of the packaging and e-commerce industry, fuelled by changing consumer habits. Increases consumer spending on home renovation projects, boosts demand for DIY adhesives and sealants.
Country Insights
How did the U.S. Thrive in the North America Adhesives And Sealants Market in 2025?
The U.S. dominated the market with the largest share in 2025. The dominance of the region can be attributed to the expanding automotive sector that focuses on manufacturing lightweight and electric vehicles. Also, the growth of the e-commerce industry and the miniaturization of electronic devices are fuelling demand for adhesives and sealants in the packaging and electronics industry.
Which is the Fastest Growing Country in the Region?
Mexico is expected to grow at the fastest CAGR over the forecast period. The growth of the region can be credited to the ongoing growth of the e-commerce industry, which leads to higher packaging demands. In addition, the rapid shift towards energy-efficient buildings and sustainable building practices is propelling the market for sealants that fulfil these requirements.
Canada is expected to grow at a notable CAGR over the forecast period. The growth of the region can be driven by its growing consumption in packaging and electronics, coupled with an increasing preference for sustainable and bio-based alternatives. Moreover, a rise in home renovation projects also drives demand for adhesives and sealants for projects such as cabinetry and tiling.
Recent Developments
- In July 2025, Sonoco Products Company, a leader in sustainable packaging, announced a $30 million capital investment to grow its manufacturing capacity in the expanding adhesives and sealants (A&S) market. This investment will improve the existing production lines of the company.(Source: www.globenewswire.com)
- In September 2025, Henkel, a major leader in adhesives, sealants, and functional coatings, celebrated the expansion of its production facility in Brandon, South Dakota. This expansion plays a crucial role in delivering high-performance materials, produced under LOCTITE® and BERGQUIST® brands.(Source: www.prnewswire.com)
Top North America Adhesives And Sealants Market Companies
3M
Corporate Information
- Name: 3M Company (originally Minnesota Mining and Manufacturing Company)
- Headquarters: Maplewood, Minnesota, USA
- CEO (as of 2024): William M. Brown
- Core Sectors / Business Groups: According to historical sources, it operates through several business groups: industrial, safety & graphics, electronics & energy, health care, and consumer.
History and Background
- Founding (1902): Founded in Two Harbors, Minnesota by five businessmen. Originally aimed to mine corundum (for abrasive materials), but this didn’t work out as planned.
- Early Pivot: After the mining plan didn’t pan out, 3M shifted to sandpaper (abrasives) manufacturing.
Key Developments and Strategic Initiatives
- Innovation Culture: R&D has been a core part of 3M’s DNA. The company emphasizes innovation heavily (many internal technology platforms).
- Sustainability: 3M has committed to sustainability initiatives. For example, they run a long standing “Pollution Prevention Pays” program.
- PFAS Exit Strategy: One of the biggest strategic shifts: 3M has announced it will exit manufacturing all PFAS (per- and polyfluoroalkyl substances) by end of 2025.
Mergers & Acquisitions
- Cogent Systems (2010): 3M acquired biometric ID solutions firm Cogent to expand into security / identification technologies.
- Acelity / KCI (2019): Acquired for advanced wound-care and surgical applications.
- Scott Safety (2017): Acquisition of respiratory and safety equipment business.
Partnerships & Collaborations
- Sustainability Programs: Collaboration on environmental goals like reducing PFAS, circular economy initiatives, and pollution prevention.
- Technology & Innovation Partnerships: Leveraging its 51+ technology platforms (e.g., adhesives, nanotech, microreplication) to co-develop customers.
Product Launches / Innovations
- Adhesives & Tapes: 3M is very strong in curable adhesives (epoxies, structural), pressure-sensitive adhesives, and specialty tapes.
- Microreplication & Optical Materials: 3M uses microreplication technology (very small, structured surfaces) for optical films, reflective sheeting, and adhesives.
- Advanced Materials: Their R&D includes molding, biomaterials, analytical science, and vapor processing.
Key Technology Focus Areas
- Material Science & Surface Engineering: Adhesives, abrasives, ceramics, coatings.
- Microreplication: As noted, for optical, display, and surface-structure applications.
- Analytical Science: High capability in characterization, measurement, and process understanding.
R&D Organisation & Investment
- R&D Intensity: According to one profile, 3M invests a significant percentage (~5–6%) of its sales back into R&D.
- Technology Platforms: 3M has a “platform” model – around 51 technology platforms (e.g., adhesives, nanotech, ceramics) are shared across its businesses.
SWOT Analysis
Strengths:
- Very diversified product portfolio (adhesives, consumer, industrial, safety, electronics)
- Strong R&D capability and innovation engine (many patents, platform-based tech)
- Global reach and manufacturing scale
- Trusted brand (Scotch, Post-it, etc.)
- Ability to cross-leverage technologies (e.g., microreplication + adhesives)
Weaknesses:
- Significant legacy liabilities (especially PFAS litigation)
- The complexity of a conglomerate: managing very diverse businesses is operationally challenging
- Potential risk in R&D scale: maintaining many platforms is resource-intensive
- Transition risk: Exiting PFAS production could impact certain product lines and margins
Opportunities:
- Growing demand for “green” adhesives / materials (PFAS-free)
- Electrification & EVs: adhesives for lightweight vehicles, battery packs, electronics
- Sustainability-driven markets (circular economy, low-impact materials)
- Continued innovation in medical adhesives (though part spun out), electronics, energy
Threats:
- Regulatory pressure: PFAS regulations are tightening globally
- Litigation risk: ongoing lawsuits (PFAS, earplugs) may continue to burden the company
- Competitive pressure: other specialty chemical companies, adhesives firms, tech-based material companies
- Supply chain / cost pressures, especially for raw materials and energy
Recent News & Strategic Updates
- PFAS Exit: 3M has committed to exit PFAS manufacturing by end-2025.
- Health-Care Spin-off (Solventum): On April 1, 2024, 3M completed the spin-off of its healthcare business into Solventum Corporation.
Other Top Companies
- Henkel Corporation: Henkel's North American Adhesive Technologies business is a leader in providing adhesives, sealants, and functional coatings across a wide range of industries, including automotive, electronics, aerospace, and consumer goods.
- Sika AG: Sika AG is a leading global specialty chemicals company with a significant presence in North America, providing adhesives and sealants for the construction and industrial sectors.
- 3M
- H.B. Fuller Company
- Evonik Industries
- RPM International Inc.
- Dow
- Wacker Chemie AG
- Arkema
- Arkema Group
Segments Covered
By Adhesives Technology
- Water based
- Solvent based
- Hot melt
- Other Technology
By Adhesives Product
- Acrylic
- Epoxy
- EVA
- Polyurethanes
- PVA
- Styrenic block
- Other Products
By Adhesives Application
- Automotive & Transportation
- Building & Construction
- Consumer & DIY
- Footwear & Leather
- Furniture & Woodworking
- Medical
- Paper & Packaging
- Other Products
By Sealants Product
- Silicones
- Polyurethanes
- Acrylic
- Polyvinyl acetate
- Other Products
By Sealants Application
- Construction
- Automotive
- Packaging
- Assembly
- Consumers
- Other Products
A Seven-Phase Framework
Our methodology is designed to be universally applicable across commodity chemicals, specialty chemicals, petrochemicals, construction chemicals, coatings, electronic chemicals, industrial gases, agrochemicals, water treatment chemicals, and performance materials. Each phase builds upon the last, creating a layered validation structure that minimizes estimation error and maximizes analytical confidence.
The framework ensures comprehensive market coverage, robust cross-validation, and reliable long-term forecasting — producing market estimates that withstand scrutiny from investors, regulators, and corporate strategy teams.

Seven-Phase Framework — Analytical Effort Distribution
Relative analytical effort allocated across each phase of the Chemicals & Materials research framework

Phase 1 - Secondary Research: Establishing the Foundation
Secondary research collects and evaluates publicly available information from authoritative sources, establishing the foundational understanding of market structure, value chain dynamics, competitive landscape, and end-use demand patterns. Every source is evaluated for credibility, recency, geographic relevance, and methodological soundness before inclusion.
Industry Associations
Sources include ACC, CEFIC, ICCA, JCIA, CPCIF, and SOCMA providing production volumes, consumption trends, capacity developments, and sustainability initiatives.
Company Disclosures
Annual reports, investor presentations, earnings transcripts, and regulatory filings reveal product portfolios, manufacturing footprints, capacity expansions, and revenue segmentation.
Government Databases
National statistical offices, customs authorities, environmental agencies, and industrial production databases provide verified statistics on output, trade flows, and regulatory compliance.
Trade Databases
UN Comtrade, ITC, Eurostat, and national customs authorities enable assessment of global product movement, import dependency, and export competitiveness across regions.
Our Secondary Research Sources
- Ministry of Chemicals and Fertilizers
- European Chemicals Agency
- United States Department of Energy
- Ministry of Industry and Information Technology
- Ministry of Economy Trade and Industry
- Ministry of Trade Industry and Energy
- National Institute of Standards and Technology
- Council of Scientific and Industrial Research
- Fraunhofer Society
- National Institute for Materials Science
Phase 2 — Supply-Side Assessment: Mapping Production Capabilities
Production Capacity Analysis
All major manufacturers are assessed for existing installed capacity, planned additions, expansions, new plant announcements, and technology adoption — mapped at global, regional, and country levels.
Capacity Utilization Adjustment
Installed capacity is adjusted using utilization rates based on demand conditions, feedstock availability, plant operating rates, maintenance schedules, and regulatory restrictions.
Manufacturer Revenue Analysis
Product-specific revenues, segment-level performance, regional distribution, average selling prices, and margin trends are evaluated to establish market value estimates.
Supply-Side Assessment — Capacity vs. Effective Production by Region
Illustrative comparison of installed capacity vs. effective production volume (after utilization rate adjustment) across major regions

Phase 3 — Demand-Side Assessment: Quantifying Chemical Consumption
Demand-side analysis quantifies chemical consumption across industries, applications, and geographies — identifying where and how chemicals are consumed throughout the value chain with precision.
End-Use Industry Analysis
Chemical demand is evaluated across automotive, construction, packaging, electronics, agriculture, healthcare, consumer goods, industrial manufacturing, energy and utilities, and water treatment. Industry output, production trends, and consumption intensity are analyzed to determine demand patterns.
Consumption Modeling
Demand is estimated using measurable indicators: kilograms per vehicle, kilograms per square meter of construction, dosage per cubic meter of water treated, kilograms per hectare of agricultural land, and kilograms per ton of manufactured products. Consumption factors are validated through industry publications and primary interviews.
Application Analysis
The market is segmented by application area to understand product performance requirements, formulation trends, technology adoption, customer preferences, and regulatory requirements improving demand accuracy and segmentation granularity.
Demand-Side Assessment — End-Use Industry Demand Distribution
Illustrative distribution of chemical & materials demand across key end-use industries

Phase 4 - Trade Flow Analysis: Balancing Regional Supply and Demand
Trade flow analysis reconciles regional supply and demand estimates through import and export data, identifying net supply positions, regional dependencies, and market imbalances. It serves as an independent validation layer that tests the consistency of supply-side and demand-side estimates.
Import Analysis
Import data is evaluated to determine volumes, source countries, product dependency, regional supply gaps, and pricing trends — identifying markets that rely heavily on external supply and where domestic production is insufficient to meet demand.
Export Analysis
Export assessments reveal production surplus, export competitiveness, regional manufacturing strength, and global market participation. Export patterns also help validate domestic production estimates and identify net exporting regions.
Apparent Consumption Model
Regional consumption is assessed using the standard apparent consumption formula:
Results identify net importing regions, net exporting regions, regional deficits, and surpluses — serving as an independent validation of supply and demand estimates.
Trade Flow Analysis — Net Supply Position by Region
Illustrative apparent consumption vs. domestic production across major regions — positive gap indicates net import dependency

Phase 5 — Primary Research: The Critical Validation Layer
Primary research tests and refines findings from secondary research through direct engagement with industry participants across the supply chain, demand side, and expert community. It captures intelligence that no database or published report can provide — the real-world experience of manufacturers, buyers, and specialists operating in the market.

Supply-Side Interviews
Conversations with chemical manufacturers, raw material suppliers, contract manufacturers, technology providers, and plant operators cover production trends, capacity utilization, pricing developments, technology shifts, and competitive dynamics.

Demand-Side Interviews
Engagement with OEMs, industrial consumers, procurement managers, distributors, formulators, and end-use manufacturers focuses on consumption trends, purchasing behavior, product substitution, demand outlook, and emerging applications.

Industry Expert Consultations
Additional interviews with industry consultants, independent experts, regulatory specialists, technical professionals, and research institutions provide deeper market context and validate key analytical assumptions.
Focus Areas of Primary Research:
Market Size & Forecast Validation
Revenue estimates, volume consumption, growth rates, forecast assumptions, regional demand.Supply Chain & Value Chain Assessment
Raw material sourcing, supply chain challenges, distribution networks, procurement practices.Production & Capacity Analysis
Manufacturing capacity, utilization rates, expansion projects, plant investments.Pricing & Cost Structure Analysis
Product pricing trends, feedstock costs, energy costs, margin pressures, pricing outlook.Competitive Landscape Assessment
Volume and value estimates confirmed to be fully consistent with one another before publicationInterview Volume by Market Scope
| Study Scope | Number of Interviews |
|---|---|
| Niche Market | 20 – 30 |
| Mid-Sized Market | 30 – 50 |
| Global Market | 50 – 80 |
| Highly Fragmented Market | 80 – 120 |
Interview Details:
Category : Manufacturers, Suppliers, Distributors, End Users, Experts/Associations
Average Duration : 30–60 Minutes
Interview Mode : Video calls, telephonic interviews, expert consultations
Interview Format : Structured / Semi-Structured questionnaire
Focus Areas of Primary Research:
Market Size & Forecast Validation :
Revenue estimates, volume consumption, growth rates, forecast assumptions, regional demand.
Supply Chain & Value Chain Assessment :
Raw material sourcing, supply chain challenges, distribution networks, procurement practices.
Production & Capacity Analysis :
Manufacturing capacity, utilization rates, expansion projects, plant investments.
Pricing & Cost Structure Analysis :
Product pricing trends, feedstock costs, energy costs, margin pressures, pricing outlook.
Competitive Landscape Assessment :
Market share, competitor positioning, strategic initiatives, partnerships, acquisitions.
Primary Research — Stakeholder Coverage by Category
Distribution of interview respondents across stakeholder categories (% share from PPT data)

Primary Research — Respondent Designation Profile
Seniority breakdown of interview respondents (% share from PPT data)

Primary Research — Geographic Coverage of Interviews
Regional distribution of primary research engagement (% share from PPT data)

Phase 6 — Data Triangulation and Market Validation
No single methodology is relied upon in isolation. Multiple independent estimation approaches are combined and reconciled to ensure consistency, accuracy, and analytical defensibility. Any material deviations between approaches are investigated and adjusted through additional validation cycles.
The final market size is derived through weighted triangulation of all validated methodologies. Any material deviations between approaches are investigated and adjusted through additional validation cycles. The outcome represents the most realistic assessment of the market based on available evidence and expert confirmation ensuring that volume and value estimates are fully consistent with one another.
Triangulation Framework — Input Contribution Weight
Relative weight each sizing input contributes to the final reconciled market estimate

Phase 7 — Forecast Modeling: Projecting Future Market Evolution
Forecasting evaluates the future trajectory of the market using a combination of quantitative indicators and qualitative assessments across economic, industry, and regulatory dimensions. Rather than simple extrapolation, each driver is independently modeled and integrated into a composite forecast.
Macroeconomic Indicators
GDP growth, industrial production, manufacturing output, construction activity, consumer spending, and capital investment form the quantitative foundation of long-term demand projections. These are applied at country, regional, and global levels.
Industry Growth Drivers
Urbanization, infrastructure development, industrialization, technological innovation, sustainability initiatives, and evolving product performance requirements are assessed at regional and industry levels — capturing both structural and cyclical demand drivers.
Capacity Expansion Analysis
Announced plant expansions, new manufacturing facilities, technology upgrades, and strategic investments are evaluated to determine future supply-demand dynamics and potential market tightness or oversupply situations.
Regulatory & Sustainability
Environmental regulations, chemical safety standards, emission reduction targets, circular economy initiatives, and sustainability requirements are incorporated as they often influence product adoption rates and market growth trajectories.
Scenario Forecast Range — Indexed Market Growth (Year 1–10)
Illustrative indexed growth trajectories across Base, Optimistic, and Pessimistic scenarios over a 10-year forecast horizon

Forecast Drivers — Relative Impact Score by Category
Impact score (0–100) of each driver type on chemicals & materials market forecast




Comments
Share your thoughts, ask a question, or provide feedback about this report.