
North America Calcium Carbonate Market Size Analysis Report 2035
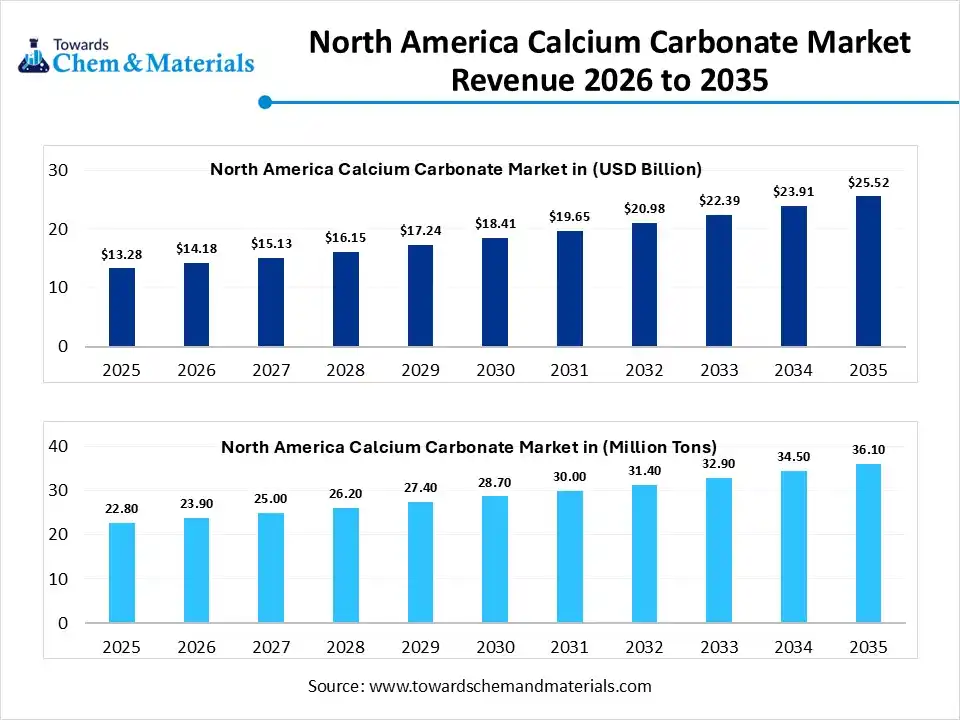
The North America calcium carbonate market size was estimated at USD 13.28 billion in 2025 and is expected to increase from USD 14.18 billion in 2026 to USD 25.52 billion by 2035, growing at a CAGR of 6.75% from 2026 to 2035. In terms of volume, the market is projected to grow from 22.80 million tons in 2025 to 36.10 million tons by 2035. growing at a CAGR of 4.70% from 2026 to 2035. The rising construction projects, demand for high-quality paper/packaging, advanced plastics, pharmaceutical applications, and supportive government initiatives for sustainable manufacturing drive the growth of the market.
Report Highlights
- By type, the ground calcium carbonate segment dominated the market and accounted for the largest volume share of 76.32% in 2025.
- By type, the precipitated calcium carbonate segment is expected to grow at the fastest CAGR of 6.19% from 2026 to 2035 in terms of volume.
- By particle size, the medium (1–10 μm) segment led the market with the largest revenue volume share of 48.00% in 2025.
- By product grade, the industrial grade segment dominated the market and accounted for the largest volume share of 68.00% in 2025.
- By coating treatment, the uncoated segment led the market with the largest revenue volume share of 72% in 2025.
- By application, the paper and pulp segment dominated the market and accounted for the largest volume share of 41% in 2025.
What Is The Significance Of The North America Calcium Carbonate Market?
The North America calcium carbonate market comprises the industrial ecosystem focused on the extraction, processing, and commercialization of calcium carbonate minerals across the continent. the market is significant due to its widespread use as a versatile filler, extender, and additive across crucial sectors like construction, paper, plastics, paints & coatings, and dietary supplements, driving robust growth supported by infrastructure development, demand for high-performance materials, and a shift towards sustainable products, though facing challenges from declining paper use in some areas.
North America Calcium Carbonate Market Growth Trends:
- Sustainability: Calcium carbonate is favored as a natural, cost-effective filler in green products, aligning with the goals of the circular economy.
- Government Support: Initiatives such as the CHIPS Act and green building codes encourage domestic production and the use of critical materials.
- Production Expansion: Companies like Imerys are investing in capacity to meet rising demand.
- Focus on High-Purity & Nano Grades: Shift towards advanced, value-added products (PCC) for specialty polymers, pharma, and electronics.
Report Scope
| Report Attribute | Details |
| Market Size and Volume in 2026 | USD 14.18 Billion / 23.90 Million tons |
| Revenue Forecast in 2035 | USD 25.52 Billion / 36.10 Million tons |
| Growth Rate | CAGR 6.75% |
| Forecast Period | 2026 - 2035 |
| Base Year | 2025 |
| Units Considered | Value (Billion / Million), Volume (MillionTons) |
| Segment Covered | By Type, By Particle Size, By Product Grade, By Coating Treatment, By Application, By Region |
| Key companies profiled | J.M. Huber Corporation, Imerys S.A., Omya AG, Minerals Technologies Inc, Mississippi Lime Company, GLC Minerals , Carmeuse , Lhoist North America , Sibelco , United States Lime & Minerals, Inc. , Graymont Limited , Columbia River Carbonates , Blue Mountain Minerals , ILC Resources , Austin White Lime Company , Greer Limestone Company , National Lime & Stone Company , Pete Lien & Sons, Inc. , CalPortland , Chemstone Corporation |
Key Technological Shifts In The North America Calcium Carbonate Market:
The North America calcium carbonate market is undergoing a notable technological shift driven by innovation in production processes, product development, and sustainability initiatives. Key trends include the increasing adoption of advanced forms such as nano-precipitated calcium carbonate (NPCC), where finer particle sizes and surface modifications improve dispersion, compatibility, and performance in high-tech applications like plastics, coatings, and specialty materials.
Trade Analysis Of the North America Calcium Carbonate Market: Import & Export Statistics
- Based on United States Export data, the U.S. shipped 828 shipments of Calcium Carbonate from May 2024 to April 2025 (TTM). These shipments were sent by 221 U.S. exporters to 175 buyers, showing a 28% increase compared to the previous year.
- Most U.S. Calcium Carbonate exports head to Mexico, China, and Brazil.
- Globally, Vietnam, China, and Malaysia are the leading exporters, with Vietnam leading at 16,925 shipments, followed by China with 10,984, and Malaysia with 9,633 shipments.
- According to Global Export data, the world exported 1,045 shipments of Calcium Carbonate to the U.S. from June 2024 to May 2025 (TTM). These exports involved 211 exporters and 212 U.S. buyers.
Most Calcium Carbonate exports from the world are destined for India, Vietnam, and the U.S.
North America Calcium Carbonate Market -- Value Chain Analysis
- Extraction and Processing: Calcium carbonate in North America is produced through processes such as limestone and marble quarrying, crushing, grinding, precipitation (PCC production), surface treatment, and particle size classification for industrial and specialty applications.
- Key players: Omya AG, Imerys, Minerals Technologies Inc., Mississippi Lime Company
- Quality Testing and Certification: Calcium carbonate requires certifications related to chemical purity, particle size consistency, environmental compliance, and application-specific performance. Key certifications include ISO quality standards, ASTM material specifications, FDA approval for food and pharmaceutical grades, and REACH compliance for exports.
- Key players: ISO (International Organization for Standardization), ASTM International, FDA (U.S. Food and Drug Administration), UL Solutions
- Distribution to Industrial Users: Calcium carbonate is distributed to paper and pulp, plastics, paints and coatings, construction materials, pharmaceuticals, food and beverages, and rubber manufacturing industries across North America.
- Key players: Omya AG, Imerys, Huber Engineered Materials.
North America Calcium Carbonate Regulatory Landscape
| Country / Region | Regulatory Body | Key Regulations | Focus Areas | Notable Notes |
| United States | U.S. Environmental Protection Agency (EPA) | Clean Air Act (CAA) Clean Water Act (CWA) Resource Conservation and Recovery Act (RCRA) |
Air emissions from processing/grinding Stormwater and wastewater discharge Waste classification & disposal |
Calcium carbonate (ground/powder) is generally non-hazardous, but dust management and particulate emissions from milling/handling must meet CAA standards; RCRA tracks waste from processing sites |
| Occupational Safety and Health Administration (OSHA) | OSHA standards (29 CFR 1910) Hazard Communication Standard (HCS) |
Worker exposure limits (silica/dust) Labeling and hazard communication for powders |
OSHA regulates respirable crystalline silica (often present in calcium carbonate mining) rather than the carbonate itself; facilities must monitor dust and protect worker health. | |
| Department of Transportation (DOT) | Hazardous Materials Regulations (49 CFR) | Classification of transport shipments Packaging and labeling of bulk powders |
Calcium carbonate is typically non-hazardous for transport, but mixed loads with additives or hazardous binders may require HM classification. | |
| U.S. Food and Drug Administration (FDA) | CFR Title 21 (Food Additives/GRAS) | Food-contact approval for calcium carbonate (food/pharma grade) | High-purity calcium carbonate used in food/medicine must meet FDA GRAS criteria and applicable CFR specs. | |
| Canada | Environment and Climate Change Canada (ECCC) | Canadian Environmental Protection Act (CEPA) National Pollutant Release Inventory (NPRI) |
Chemical substance assessment Emission and discharge reporting |
Calcium carbonate is typically considered low-risk, but facilities may need to report emissions to the NPRI if thresholds are exceeded. |
| Canadian Centre for Occupational Health and Safety (CCOHS) | Workplace Hazardous Materials Information System (WHMIS) | SDS, labeling, worker training | WHMIS requires Safety Data Sheets and hazard communication for chemical handling in manufacturing and processing. |
Segmental Insights
Type Insights
Which Type Segment Dominated The North America Calcium Carbonate Market In 2025?
The ground calcium carbonate segment dominated the market with a share of 76.32% in 2025. Ground calcium carbonate dominates volume consumption in North America due to its cost efficiency and wide availability. GCC is extensively used in paper, plastics, rubber, and construction applications where particle size control and brightness are important, but ultra-high purity is not critical. Strong demand from the packaging and infrastructure sectors continues to support steady growth.
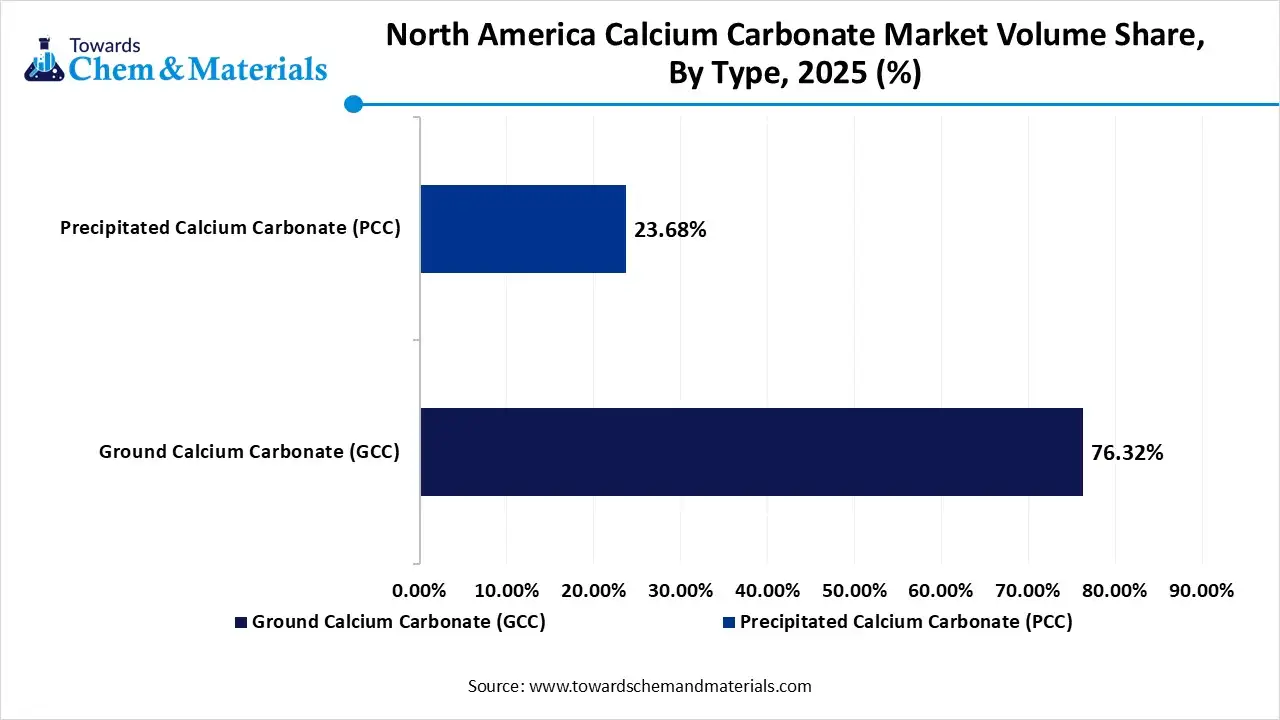
The precipitated calcium carbonate segment is projected to grow at fastest CAGR between 2026 and 2035 in the market. Precipitated calcium carbonate holds a significant share in value terms owing to its controlled particle morphology and higher purity. PCC is preferred in specialty paper coatings, pharmaceuticals, food additives, and high-performance plastics. Growth is driven by rising demand for lightweight paper, enhanced surface properties, and pharmaceutical excipients across the U.S. and Canada.
North America Calcium Carbonate Market Volume and Share, By Type, 2025-2035
| By Type | Market Volume Share (%), 2025 | Market Volume (Million Tons)2025 | Market Volume (Million Tons)2035 | CAGR(%) 2026-2035 | Market Volume Share (%), 2035 |
| Ground Calcium Carbonate (GCC) | 76.32% | 17.4 | 26.8 | 4.93% | 74.32% |
| Precipitated Calcium Carbonate (PCC) | 23.68% | 5.4 | 9.3 | 6.19% | 25.68% |
Particle Size Insights
How Did the Medium Segment Dominated The North America Calcium Carbonate Market In 2025?
The medium (1–10 μm) segment dominated the market with a share of 48% in 2025. Medium particle size calcium carbonate is highly used in plastics compounding, paper filling, and paints and coatings. This segment benefits from balanced mechanical reinforcement, opacity, and dispersion properties. Stable demand from packaging, consumer goods, and building materials supports consistent market expansion in North America.
The nano-scale segment is projected to grow at fastest CAGR between 2026 and 2035 in the market. Nano-scale calcium carbonate is gaining traction in advanced polymers, specialty coatings, biomedical formulations, and high-performance composites. Its superior surface area, reinforcement capabilities, and functional performance drive adoption in premium applications. Increasing R&D investment and innovation in nanomaterials are key growth drivers in this emerging segment.
Product Grade Insights
Which Product Grade Segment Dominated The North America Calcium Carbonate Market In 2025?
The industrial grade segment dominated the market with a share of 68% in 2025. Industrial-grade calcium carbonate accounts for the largest market share due to its extensive use in paper, plastics, rubber, paints, adhesives, and construction materials. Its cost-effectiveness and adaptability make it ideal for high-volume applications. Growth is supported by manufacturing recovery and infrastructure development across North America.
The pharmaceutical grade segment is projected to grow at fastest CAGR between 2026 and 2035 in the market. Pharmaceutical-grade calcium carbonate is characterized by high purity and strict regulatory compliance. It is widely used as an excipient, dietary supplement, antacid, and calcium fortification agent. Rising healthcare expenditure, aging populations, and growing nutraceutical consumption are driving demand for this premium segment.
Coating Treatment Insights
How Did the Uncoated Segment Dominated The North America Calcium Carbonate Market In 2025?
The uncoated segment dominated the market with a share of 72% in 2025. Uncoated calcium carbonate is primarily used in paper, paints, and construction applications where surface compatibility requirements are minimal. Its lower cost and ease of processing make it suitable for bulk industrial uses. Stable consumption from traditional industries continues to sustain this segment.
The stearic acid-coated segment is projected to grow at fastest CAGR between 2026 and 2035 in the market. Stearic acid-coated calcium carbonate is extensively used in plastics and polymer applications due to improved dispersion, hydrophobicity, and mechanical performance. The coating enhances compatibility with polymer matrices, supporting growth in automotive, packaging, and consumer goods manufacturing across North America.
Application Insights
Which Application Segment Dominated The North America Calcium Carbonate Market In 2025?
The paper and pulp segment dominated the market with a share of 41% in 2025. The paper and pulp industry represents a key application segment, utilizing calcium carbonate as a filler and coating pigment to improve brightness, opacity, and printability. Although digitalization has moderated demand for printing paper, packaging paper, and specialty paper grades continue to drive steady consumption.
The plastics and polymers segment is projected to grow at fastest CAGR between 2026 and 2035 in the market. Plastics and polymers are a major growth application for calcium carbonate, particularly in packaging, automotive components, and consumer products. Calcium carbonate enhances stiffness, dimensional stability, and cost efficiency. Increasing demand for lightweight and recyclable plastic materials supports long-term growth in this segment.
Country Insights
United States Calcium Carbonate Market Trends
The United States calcium carbonate market is a mature and steadily growing industry driven by demand from construction, paper, plastics, paints and coatings, and pharmaceuticals. Calcium carbonate is widely used as a filler and extender because it improves strength, brightness, and durability while keeping costs low. Growth in residential and commercial construction supports demand through its use in cement, concrete, and asphalt, while the plastics and rubber industries rely on it to enhance product performance and processing efficiency.
North America Calcium Carbonate Market Volume and Share, By Country, 2025-2035
| By Country | Market Volume Share (%), 2025 | Market Volume (Million Tons)2025 | Market Volume (Million Tons)2035 | CAGR(%) 2026-2035 | Market Volume Share (%), 2035 |
| U.S. | 78.00% | 17.8 | 27.5 | 4.94% | 76.07% |
| Canada | 10.12% | 2.3 | 4.0 | 6.34% | 11.12% |
| Mexico | 8.23% | 1.9 | 3.4 | 6.81% | 9.41% |
| Rest of NA | 3.65% | 0.8 | 1.2 | 4.41% | 3.40% |
Canada Calcium Carbonate Market Trends
The Canada calcium carbonate market is a growing industrial minerals industry serving a range of end-use sectors such as paper, plastics, construction, and specialty applications. Market expansion is also supported by technological improvements in processing and a shift toward eco-friendly and high-purity products, though the industry faces challenges from raw material price fluctuations and environmental regulations on mining and processing.
Recent Developments
- In October 2025, CarbonFree and Univar Solutions USA signed a Letter of Intent to distribute Endurocal, a carbon-neutral, mine-free calcium carbonate. Produced using "SkyCycle" technology that captures CO2 and calcium from industrial waste gases, this high-purity mineral offers a sustainable alternative to imported calcium carbonate. The partnership aims to supply North American markets with this domestically produced material.(Source : carbonherald.com)
- In September 2025, the Indian government imposed a five-year anti-dumping duty on calcium carbonate filler masterbatch imported from Vietnam. The measure follows a Directorate General of Trade Remedies (DGTR) investigation, which found Vietnamese exporters were dumping the material into the Indian market, causing injury to domestic manufacturers.(Source: scanx.trade)
- In May 2025, MIDROC Investment Group launched Ethiopia's first coated calcium carbonate plant in May 2025, located in the Afar Region. The facility has an 18,000-ton annual capacity and aims to replace significant imports for various industries, using 97% local raw materials.(Source: www.fanamc.com)
Top Players in the North America Calcium Carbonate Market & Their Offerings:
- J.M. Huber Corporation: J.M. Huber is a major supplier of calcium carbonate products used in plastics, coatings, adhesives, and paper applications. The company offers ground calcium carbonate (GCC) and precipitated calcium carbonate (PCC) grades tailored for industrial fillers and performance enhancement.
- Imerys S.A.: Imerys operates extensive calcium carbonate production and processing facilities in North America, providing high-quality GCC and specialty PCC for paper, paint, plastics, and construction materials. Its materials are valued for brightness, particle size control, and consistency.
- Omya AG: Omya is a key global producer of industrial minerals, including calcium carbonate. In North America, it supplies a broad range of GCC and PCC products for applications such as coatings, sealants, plastics, and paper, with a focus on sustainable sourcing.
- Minerals Technologies Inc: Minerals Technologies offers calcium carbonate products under its specialty additives and performance materials portfolio. The company’s PCC grades are widely used in paper coatings, polymers, and advanced industrial applications that require high brightness and controlled particle morphology.
- Mississippi Lime Company: Mississippi Lime is a prominent manufacturer of precipitated and ground calcium carbonate used in construction, agriculture, plastics, and industrial applications. Its products are known for purity and versatility across multiple end-use sectors.
- GLC Minerals
- Carmeuse
- Lhoist North America
- Sibelco
- United States Lime & Minerals, Inc.
- Graymont Limited
- Columbia River Carbonates
- Blue Mountain Minerals
- ILC Resources
- Austin White Lime Company
- Greer Limestone Company
- National Lime & Stone Company
- Pete Lien & Sons, Inc.
- CalPortland
- Chemstone Corporation
Segments Covered
By Type
- Ground Calcium Carbonate (GCC)
- Precipitated Calcium Carbonate (PCC)
By Particle Size
- Coarse (>10 μm)
- Medium (1–10 μm)
- Fine (0.1–1 μm)
- Ultrafine (<0.1 μm)
- Nanoscale
By Product Grade
- Industrial Grade
- Food Grade
- Pharmaceutical Grade
- Technical/Laboratory Grade
By Coating Treatment
- Uncoated Calcium Carbonate
- Stearic Acid Coated
- Silane/Organic Coated
By Application
- Paper and Pulp
- Filling
- Coating
- Plastics and Polymers
- Polyvinyl Chloride (PVC)
- Polyethylene (PE)
- Polypropylene (PP)
- Polystyrene (PS)
- Paints and Coatings
- Architectural Coatings
- Industrial Coatings
- Marine Coatings
- Building and Construction
- Cement and Concrete
- Drywall and Joint Compounds
- Roofing Materials
- Adhesives and Sealants
- Pharmaceuticals and Healthcare
- Antacids
- Calcium Supplements
- Drug Carrier Systems
- Food and Beverage
- Food Fortification
- Anti-caking Agents
- Agriculture and Forestry
- Soil Liming
- Fertilizer Additives
- Animal Feed
- Rubber and Elastomers
- Glass and Ceramics
- Environmental Applications (Water/Flue Gas Treatment)
By Region
- U.S.
- Canada
- Mexico
- Rest of NA
A Seven-Phase Framework
Our methodology is designed to be universally applicable across commodity chemicals, specialty chemicals, petrochemicals, construction chemicals, coatings, electronic chemicals, industrial gases, agrochemicals, water treatment chemicals, and performance materials. Each phase builds upon the last, creating a layered validation structure that minimizes estimation error and maximizes analytical confidence.
The framework ensures comprehensive market coverage, robust cross-validation, and reliable long-term forecasting — producing market estimates that withstand scrutiny from investors, regulators, and corporate strategy teams.

Seven-Phase Framework — Analytical Effort Distribution
Relative analytical effort allocated across each phase of the Chemicals & Materials research framework

Phase 1 - Secondary Research: Establishing the Foundation
Secondary research collects and evaluates publicly available information from authoritative sources, establishing the foundational understanding of market structure, value chain dynamics, competitive landscape, and end-use demand patterns. Every source is evaluated for credibility, recency, geographic relevance, and methodological soundness before inclusion.
Industry Associations
Sources include ACC, CEFIC, ICCA, JCIA, CPCIF, and SOCMA providing production volumes, consumption trends, capacity developments, and sustainability initiatives.
Company Disclosures
Annual reports, investor presentations, earnings transcripts, and regulatory filings reveal product portfolios, manufacturing footprints, capacity expansions, and revenue segmentation.
Government Databases
National statistical offices, customs authorities, environmental agencies, and industrial production databases provide verified statistics on output, trade flows, and regulatory compliance.
Trade Databases
UN Comtrade, ITC, Eurostat, and national customs authorities enable assessment of global product movement, import dependency, and export competitiveness across regions.
Our Secondary Research Sources
- Ministry of Chemicals and Fertilizers
- European Chemicals Agency
- United States Department of Energy
- Ministry of Industry and Information Technology
- Ministry of Economy Trade and Industry
- Ministry of Trade Industry and Energy
- National Institute of Standards and Technology
- Council of Scientific and Industrial Research
- Fraunhofer Society
- National Institute for Materials Science
Phase 2 — Supply-Side Assessment: Mapping Production Capabilities
Production Capacity Analysis
All major manufacturers are assessed for existing installed capacity, planned additions, expansions, new plant announcements, and technology adoption — mapped at global, regional, and country levels.
Capacity Utilization Adjustment
Installed capacity is adjusted using utilization rates based on demand conditions, feedstock availability, plant operating rates, maintenance schedules, and regulatory restrictions.
Manufacturer Revenue Analysis
Product-specific revenues, segment-level performance, regional distribution, average selling prices, and margin trends are evaluated to establish market value estimates.
Supply-Side Assessment — Capacity vs. Effective Production by Region
Illustrative comparison of installed capacity vs. effective production volume (after utilization rate adjustment) across major regions

Phase 3 — Demand-Side Assessment: Quantifying Chemical Consumption
Demand-side analysis quantifies chemical consumption across industries, applications, and geographies — identifying where and how chemicals are consumed throughout the value chain with precision.
End-Use Industry Analysis
Chemical demand is evaluated across automotive, construction, packaging, electronics, agriculture, healthcare, consumer goods, industrial manufacturing, energy and utilities, and water treatment. Industry output, production trends, and consumption intensity are analyzed to determine demand patterns.
Consumption Modeling
Demand is estimated using measurable indicators: kilograms per vehicle, kilograms per square meter of construction, dosage per cubic meter of water treated, kilograms per hectare of agricultural land, and kilograms per ton of manufactured products. Consumption factors are validated through industry publications and primary interviews.
Application Analysis
The market is segmented by application area to understand product performance requirements, formulation trends, technology adoption, customer preferences, and regulatory requirements improving demand accuracy and segmentation granularity.
Demand-Side Assessment — End-Use Industry Demand Distribution
Illustrative distribution of chemical & materials demand across key end-use industries

Phase 4 - Trade Flow Analysis: Balancing Regional Supply and Demand
Trade flow analysis reconciles regional supply and demand estimates through import and export data, identifying net supply positions, regional dependencies, and market imbalances. It serves as an independent validation layer that tests the consistency of supply-side and demand-side estimates.
Import Analysis
Import data is evaluated to determine volumes, source countries, product dependency, regional supply gaps, and pricing trends — identifying markets that rely heavily on external supply and where domestic production is insufficient to meet demand.
Export Analysis
Export assessments reveal production surplus, export competitiveness, regional manufacturing strength, and global market participation. Export patterns also help validate domestic production estimates and identify net exporting regions.
Apparent Consumption Model
Regional consumption is assessed using the standard apparent consumption formula:
Results identify net importing regions, net exporting regions, regional deficits, and surpluses — serving as an independent validation of supply and demand estimates.
Trade Flow Analysis — Net Supply Position by Region
Illustrative apparent consumption vs. domestic production across major regions — positive gap indicates net import dependency

Phase 5 — Primary Research: The Critical Validation Layer
Primary research tests and refines findings from secondary research through direct engagement with industry participants across the supply chain, demand side, and expert community. It captures intelligence that no database or published report can provide — the real-world experience of manufacturers, buyers, and specialists operating in the market.

Supply-Side Interviews
Conversations with chemical manufacturers, raw material suppliers, contract manufacturers, technology providers, and plant operators cover production trends, capacity utilization, pricing developments, technology shifts, and competitive dynamics.

Demand-Side Interviews
Engagement with OEMs, industrial consumers, procurement managers, distributors, formulators, and end-use manufacturers focuses on consumption trends, purchasing behavior, product substitution, demand outlook, and emerging applications.

Industry Expert Consultations
Additional interviews with industry consultants, independent experts, regulatory specialists, technical professionals, and research institutions provide deeper market context and validate key analytical assumptions.
Focus Areas of Primary Research:
Market Size & Forecast Validation
Revenue estimates, volume consumption, growth rates, forecast assumptions, regional demand.Supply Chain & Value Chain Assessment
Raw material sourcing, supply chain challenges, distribution networks, procurement practices.Production & Capacity Analysis
Manufacturing capacity, utilization rates, expansion projects, plant investments.Pricing & Cost Structure Analysis
Product pricing trends, feedstock costs, energy costs, margin pressures, pricing outlook.Competitive Landscape Assessment
Volume and value estimates confirmed to be fully consistent with one another before publicationInterview Volume by Market Scope
| Study Scope | Number of Interviews |
|---|---|
| Niche Market | 20 – 30 |
| Mid-Sized Market | 30 – 50 |
| Global Market | 50 – 80 |
| Highly Fragmented Market | 80 – 120 |
Interview Details:
Category : Manufacturers, Suppliers, Distributors, End Users, Experts/Associations
Average Duration : 30–60 Minutes
Interview Mode : Video calls, telephonic interviews, expert consultations
Interview Format : Structured / Semi-Structured questionnaire
Focus Areas of Primary Research:
Market Size & Forecast Validation :
Revenue estimates, volume consumption, growth rates, forecast assumptions, regional demand.
Supply Chain & Value Chain Assessment :
Raw material sourcing, supply chain challenges, distribution networks, procurement practices.
Production & Capacity Analysis :
Manufacturing capacity, utilization rates, expansion projects, plant investments.
Pricing & Cost Structure Analysis :
Product pricing trends, feedstock costs, energy costs, margin pressures, pricing outlook.
Competitive Landscape Assessment :
Market share, competitor positioning, strategic initiatives, partnerships, acquisitions.
Primary Research — Stakeholder Coverage by Category
Distribution of interview respondents across stakeholder categories (% share from PPT data)

Primary Research — Respondent Designation Profile
Seniority breakdown of interview respondents (% share from PPT data)

Primary Research — Geographic Coverage of Interviews
Regional distribution of primary research engagement (% share from PPT data)

Phase 6 — Data Triangulation and Market Validation
No single methodology is relied upon in isolation. Multiple independent estimation approaches are combined and reconciled to ensure consistency, accuracy, and analytical defensibility. Any material deviations between approaches are investigated and adjusted through additional validation cycles.
The final market size is derived through weighted triangulation of all validated methodologies. Any material deviations between approaches are investigated and adjusted through additional validation cycles. The outcome represents the most realistic assessment of the market based on available evidence and expert confirmation ensuring that volume and value estimates are fully consistent with one another.
Triangulation Framework — Input Contribution Weight
Relative weight each sizing input contributes to the final reconciled market estimate

Phase 7 — Forecast Modeling: Projecting Future Market Evolution
Forecasting evaluates the future trajectory of the market using a combination of quantitative indicators and qualitative assessments across economic, industry, and regulatory dimensions. Rather than simple extrapolation, each driver is independently modeled and integrated into a composite forecast.
Macroeconomic Indicators
GDP growth, industrial production, manufacturing output, construction activity, consumer spending, and capital investment form the quantitative foundation of long-term demand projections. These are applied at country, regional, and global levels.
Industry Growth Drivers
Urbanization, infrastructure development, industrialization, technological innovation, sustainability initiatives, and evolving product performance requirements are assessed at regional and industry levels — capturing both structural and cyclical demand drivers.
Capacity Expansion Analysis
Announced plant expansions, new manufacturing facilities, technology upgrades, and strategic investments are evaluated to determine future supply-demand dynamics and potential market tightness or oversupply situations.
Regulatory & Sustainability
Environmental regulations, chemical safety standards, emission reduction targets, circular economy initiatives, and sustainability requirements are incorporated as they often influence product adoption rates and market growth trajectories.
Scenario Forecast Range — Indexed Market Growth (Year 1–10)
Illustrative indexed growth trajectories across Base, Optimistic, and Pessimistic scenarios over a 10-year forecast horizon

Forecast Drivers — Relative Impact Score by Category
Impact score (0–100) of each driver type on chemicals & materials market forecast




Comments
Share your thoughts, ask a question, or provide feedback about this report.