
LNG And FSRU Market Size and Forecast 2026 to 2035
The global LNG And FSRU market size is calculated at USD 145.81 billion in 2025 and is predicted to increase from USD 162.80 billion in 2026 and is projected to reach around USD 438.92 billion by 2035, The market is expanding at a CAGR of 11.65% between 2025 and 2035. Asia Pacific dominated the LNG And FSRU market with a market share of 65.11% the global market in 2024. The growing demand for energy and the rise in industrial processes drive the market growth.

Key Takeaways
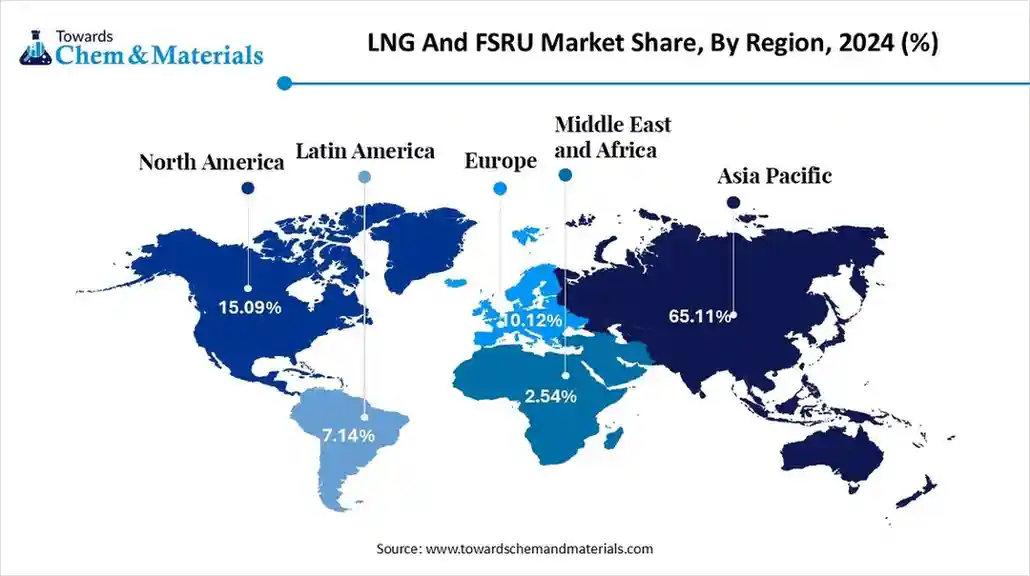
- By region, Asia Pacific held a 65.11% share of the market in 2024.
- By region, Europe is growing at a 7.8% CAGR in the market during the forecast period.
- By type, the LNG infrastructure segment held a 70.3% share in the market in 2024.
- By type, the FSRU segment is expected to grow at a 6.6% CAGR in the market during the forecast period.
- By component, the liquefaction terminals segment held a 46.4% share in the LNG and FSRU market in 2024.
- By component, the regasification terminals segment is expected to grow at a 6.8% CAGR in the market during the forecast period.
- By LNG Infrastructure Type, the onshore terminals segment held a 72.4% share in the market in 2024.
- By LNG Infrastructure Type, the offshore terminals segment is expected to grow at a 6.9% CAGR in the market during the forecast period.
- By capacity, the small-scale segment held a 68.8% share in the market in 2024.
- By capacity, the large-scale segment is expected to grow at a 7.0% CAGR in the market during the forecast period.
- By application, the power generation segment held a 48.5% share in the market in 2024.
- By application, the industrial segment is expected to grow at a 7.2% CAGR in the market during the forecast period.
Growth Engines: Key Forces Powering Expansion of LNG and FSRU Market
The LNG and FSRU market growth is driven by growing power generation, focus on cleaner energy transition, need for diversification of energy, increasing investment in FSRUs, and advancements in FSRU designs.
What is LNG and FSRU?
Liquefied natural gas (LNG) is a type of natural gas that is cooled to a liquid state and transported via ships. LNG is non-toxic, colorless, and odorless. FSRU is an acronym for Floating Storage and Regasification Unit, and is a ship-based terminal that collects LNG shipments. FSRU offers benefits like lower capital expenditure, minimal land requirements, faster implementation, lowers environmental impact, facilitates energy transition, and faster implementation.
LNG and FSRU Market Outlook:
- Industry Growth Overview: Between 2025 and 2034, the industry is expected to see accelerated growth in high-margin niches like energy security, infrastructure investment, and energy diversification. Growth is being reinforced by growing energy demand and focus on cleaner energy alternatives, particularly in Europe and Asia.
- Sustainability Trends: Sustainability is reshaping the LNG and FSRU industry, with a strong focus on methane emission reduction, adoption of dual-fuel engines, and using LNG as a transition fuel. For instance, Mitsui O.S.K. Lines integrated clean energy into Japan’s first LNG-fueled ferries to lower environmental impact.
- Global Expansion: Key players and specialized FSRU providers are expanding geographically to align with energy demand and energy transition, particularly into Asia, Europe, and South America. Companies like Shell, TotalEnergies, QatarEnergy, ExxonMobil, Excelerate Energy, and Golar LNG are expanding globally for extensive infrastructure development and development of import solutions.
Report Scope
| Report Attributes | Details |
| Market Size in 2026 | USD 162.80 Billion |
| Expected Size by 2035 | USD 438.92 Billion |
| Growth Rate from 2025 to 2035 | CAGR 11.65% |
| Base Year of Estimation | 2024 |
| Forecast Period | 2025 - 2035 |
| Leading Region | Asia Pacific |
| Fastest Growing Region | Europe |
| Segment Covered | By Type, By Component, By LNG Infrastructure Type, By Capacity, By Application, By Region |
| Key Companies Profiled | Royal Dutch Shell plc , ExxonMobil Corporation, Chevron Corporation , BP plc , Mitsui O.S.K. Lines, Ltd. (MOL), Excelerate Energy, Inc., Golar LNG Limited, BW LNG, Hyundai Heavy Industries Co., Ltd., Samsung Heavy Industries Co., Ltd., Karpowership, Petronas, GasLog Ltd. |
Key Technological Shifts in LNG and FSRU Market:
The LNG and FSRU market is undergoing key technological shifts driven by the demand for operational efficiency, safety, performance efficiency, and sustainability. One of the most significant transformations is the integration of Artificial Intelligence (AI), enabling safety, flexibility, and improving efficiency. AI offers real-time process optimization in FSRU regasification processes and liquefaction plants. AI recommends adjustments and detects inefficiencies in liquefaction processes. AI extends the lifespans of critical assets and streamlines LNG supply chains.
- For instance, Shell collaborated with Baker Hughes and C3.ai to create an AI-enabled predictive maintenance system for its Prelude FLNG facility.
Trade Analysis of LNG and FSRU Market: Import & Export Statistics
- Australia exported $46.2B of liquified natural gas in 2023.
- Qatar exported $37.3B of liquified natural gas in 2023.
- Japan imported $46.1B of liquified natural gas in 2023.
- China imported $44.4B of liquefied natural gas in 2023.
LNG and FSRU Market Value Chain Analysis
- Feedstock Procurement : Feedstock procurement for LNG is natural gas, and FSRU is liquefied natural gas.
- Quality Testing and Certifications : The quality testing involves analysis of energy content, impurity, chemical composition, & contamination, and certifications include ISO Certifications, IRClass, & FSRU Operations License.
- Regulatory Compliance and Safety Monitoring : The regulatory compliance covers operational safety, registration, technical & safety standards, and environmental protection & safety monitoring involves hazard detection, process monitoring, structural monitoring, and emergency response.
Overview of the Regional Distribution of FSRUs and LNG
| Region | Number of FSRUs | LNG Import Terminals | New Projects |
| Asia Pacific | More than 20 | Over 100 |
|
| Europe | More than 15 | 41 |
|
| South America | 10 | 9 |
|
| Middle East & Africa | 5 | 10 |
|
Segmental Insights
Type Insights
Why the LNG Infrastructure Segment Dominates the LNG and FSRU Market?
The LNG infrastructure segment dominated the LNG and FSRU market with a 70.3% share in 2024. The strong focus on clean energy sources and increasing transition of energy across various countries increases demand for LNG infrastructure. The increasing need for energy security and the growing generation of power require LNG infrastructure. The expansion of transportation, like ships and heavy-duty vehicles, requires LNG. The strong government support for LNG infrastructure development and integration of domestic LNG pipelines with traditional onshore terminals drives the overall market growth.
The FSRU segment is the fastest-growing at a CAGR of 6.6% in the market during the forecast period. The growing demand for LNG and a strong focus on energy security increase the demand for FSRU. The faster deployment process and lower upfront investment of FSRU help market growth. The ongoing advancements in FSRU, like digital automation, better regasification, and storage, support the overall market growth.
Component Insights
How did the Liquefaction Terminals Segment Hold the Largest Share in the LNF and FSRU Market?
The liquefaction terminals segment held the largest revenue share of 46.4% in the LNG and FSRU market in 2024. The growing need for cleaner fuel alternatives and the growing demand for energy increase the adoption of liquefaction terminals. The increasing diversification of energy sources and growing investment in liquefaction terminals increase the development of liquefaction terminals. The growing expansion of liquefaction terminals in countries like Qatar and the United States drives the market growth.
The regasification terminals segment is growing at a 6.8% CAGR in the market during the forecast period. The increasing need for energy security and focus on lowering environmental impact increases demand for regasification terminals. The growing demand for energy and the shift towards cleaner fuels require regasification terminals. The lower initial investment and faster deployment of regasification terminals support the overall market growth.
The storage facilities segment is growing at a significant rate in the market. The strong focus on energy security and growing power generation increases demand for storage facilities. The development of LNG import infrastructure and a focus on lowering reliance on pipelines increase the adoption of storage facilities. The growing expansion of the transportation sector requires storage facilities, supporting the overall market growth.
LNG Infrastructure Type Insights
Why Onshore Terminals Segment Dominating the LNG and FSRU Market?
The onshore terminals segment dominated the LNG and FSRU market with a 72.4% in 2024. The strong focus on significant LNG regasification & storage, and well-established LNG infrastructure increases demand for onshore terminals. The growing generation of power and the rise of industrial activities require onshore terminals. The cost-effectiveness, large-scale capacity, and operational reliability of onshore terminals drive the overall market growth.
The offshore terminals segment is the fastest-growing at a CAGR of 6.9% in the market during the forecast period. The growing industrialization and focus on energy transition increase demand for offshore terminals. The lower capital cost and operational flexibility of offshore terminals help market growth. The minimal land acquisition and faster deployment of offshore terminals support the overall market growth.
Capacity Insights
Why Small-Scale Segment Held the Largest Share in the LNG and FSRU Market?
The small-scale segment held the largest revenue share of 68.8% in the LNG and FSRU market in 2024. The lower capital expenditure and faster deployment of small-scale plants help the market growth. The growing heavy-duty transportation, like ships, trucks, and buses, increases demand for small-scale plants. The strong focus on energy security and diversification of energy sources requires small-scale plants, driving the overall market growth.
The large-scale segment is growing at a 7.0% CAGR in the market during the forecast period. The rapid industrialization and strong focus on energy transition increase the adoption of large-scale plants. The growing demand for energy and a strong focus on energy security require large-scale plants. The growing government investment in large-scale plants and energy diversification supports the overall market growth.
Application Insights
Which Application Dominated the LNG and FSRU Market?
The power generation segment dominated the LNG and FSRU market with a 48.5% in 2024. The growing demand for electricity and the transition to cleaner energy increase demand for LNG and FSRU. The rapid urbanization and strong focus on energy security require LNG and FSRU. The growing diversification of energy sources and the adoption of renewable energy sources require LNG and FSRU, driving the overall market growth.
The industrial segment is the fastest-growing at a CAGR of 7.2% in the market during the forecast period. The expansion of the shipping industry and growing power generation increases demand for LNG and FSRU. The growing manufacturing activities and increasing industrial processes require LNG and FSRU. The rapid growth in industrial activities and the expansion of the oil & gas sector require LNG and FSRU, supporting the overall market growth.
The transportation segment is significantly growing in the market. The growing utilization of commercial vehicles and heavy transport vehicles requires LNG and FSRU. The focus on a cleaner energy transition in transportation and the use of long-haul vehicles like buses & trucks requires LNG and FSRU. The growing expansion of transportation drives the overall market growth.
Regional Insights
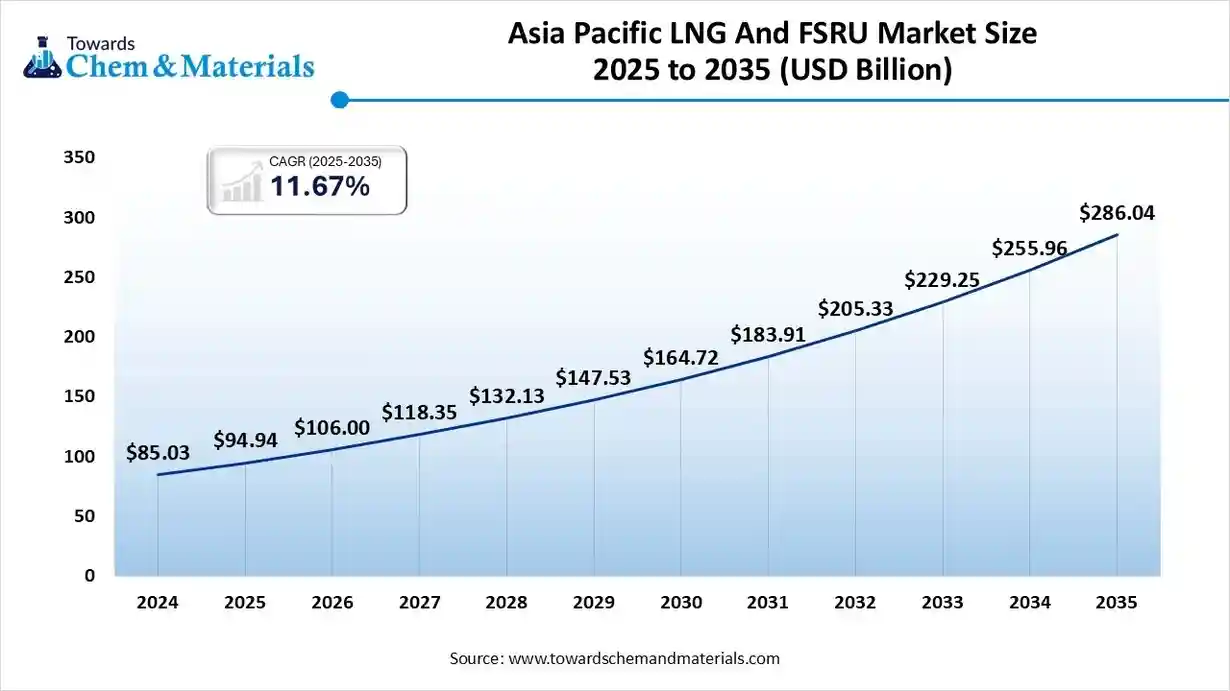
The LNG And FSRU market size was valued at USD 94.94 billion in 2025 and is expected to surpass around USD 286.04 billion by 2035, expanding at a compound annual growth rate (CAGR) of 11.67% over the forecast period from 2025 to 2035. Asia Pacific dominated the market with a 65.11% share in 2024. The rapid growth in population and the higher need for electricity increase the adoption of LNG and FSRU.
The strong focus on transition away from coal and adoption of low-emission alternatives requires LNG and FSRU. The high consumption of energy and strong focus on energy security require LNG and FSRU. The growing investment in the development of LNG infrastructure and strong LNG imports in countries like China, India, Bangladesh, South Korea, & others drives the overall market growth.
From Shore to Ship: How China Shapes LNG and FSRU Revolution
China is a key contributor to the LNG and FSRU market. The stricter environmental policies, like blue sky defense and high demand for energy, increase the adoption of LNG and FSRU. The heavy investment in natural gas infrastructure, like LNG receiving terminals and pipelines, helps market growth. The strong focus on diversifying energy sources and the development of vast LNG infrastructure support the overall market growth.
China exported $491M of liquified natural gas in 2024.
Europe LNG and FSRU Market Trends
Europe is growing at the fastest CAGR of 7.8% in the market during the forecast period. The focus on enhancing energy security and the need for diversification of energy sources increases demand for LNG and FSRU. The rapid deployment of FSRU and reduced Russian gas supply help the market growth. The growing work for the improvement of internal gas pipelines and the presence of large natural gas import terminals in countries like Belgium, Spain, &
France support the overall market growth.
Floating Forward: Germany Anchors LNG and FSRU Future in Europe
Germany is a major contributor to the market. The growing demand for energy security and strong government support for the development of LNG import infrastructure increase the adoption of LNG and FSRU. The growing diversification of energy sources and focus on long-term energy transition require LNG and FSRU. The presence of large gas storage capacities and well-established LNG pipeline networks drives the overall market growth.
North America LNG and FSRU Market Trends
North America expects notable growth in the market. The presence of abundant reserves of natural gas and the transition to cleaner energy increase demand for LNG and FSRU. The growing diversification of energy sources and focus on enhancing energy security require LNG and FSRU. The growing investment in projects like the Cedar LNG project in Canada and the expansion of LNG infrastructure support the overall market growth.
United States Catalyst in the Expansion of LNG and FSRU in the Next Phase
The United States is growing in the market. The growing production of domestic natural gas and the increasing need for energy diversification increase demand for LNG and FSRU. The development of existing LNG import facilities into export facilities and the presence of FSRU construction expertise drive the overall market growth.
The United States exported $41.8B of liquified natural gas in 2023.
Middle East & Africa LNG and FSRU Market Trends
The Middle East & Africa are growing in the market. The growing industrial activities and increasing demand for power require LNG and FSRU. The strong focus on energy security and the need to lower reliance on single energy sources require LNG and FSRU. The presence of companies like QatarEnergy, Saudi Aramco, and ADNOC supports the overall market growth.
Saudi Arabia LNG and FSRU Market Trends
Saudi Arabia contributes to the growth of the market. The focus on strengthening energy security and securing the energy portfolio requires LNG and FSRU. The growing domestic power generation and development of industrial activities increase demand for LNG and FSRU. The development of projects like the Jafurah gas project and the expansion of LNG liquefaction drives the overall market growth. Saudi Arabia exported $108M of liquefied natural gas in 2023
South America LNG and FSRU Market Trends
South America is growing in the market. The strong focus on energy security and expansion of the transportation sector increases demand for LNG & FSRU. The focus on decarbonization efforts and the presence of significant natural gas reserves increase demand for LNG & FSRU. The growing expansion of industrial sectors in countries like Argentina and Brazil supports the overall market growth.
Brazil LNG and FSRU Market Trends
Brazil is significantly growing in the market. The focus on lowering reliance on hydropower and diversification in energy sources requires LNG and FSRU. The strong focus on energy security and growing industrial activities requires LNG and FSRU. The growing expansion of LNG regasification infrastructure and development of integrated LNG to power projects drives the overall market growth.
Recent Developments
- In July 2025, Excelerate Energy launched an FSRU, Hull 3407, in South Korea. The FSRU has a capacity of delivering natural gas is 1 billion ft3/d and consists of advanced emissions-reduction systems.(Source:www.lngindustry.com)
- In September 2025, Deutsche Energy Terminal launched its second floating LNG terminal in Germany. The facility increases the capacity of natural gas by 1.9 billion cubic meters.(Source:www.intellinews.com)
- In April 2024, Mol started commercial operation of FSRU named Jawa Satu for the Jawa 1 LNG-fired power plant in Indonesia. The capacity of the plant is 1760MW, and the plant ensures a stable supply of electricity.
(Source: www.mol.co.jp)
Top LNG and FSRU Market Companies List
Hoegh LNG Holdings Ltd.
Corporate Information
- Name: Höegh LNG Holdings Ltd., formally changed to Höegh Evi Ltd. on 18 September 2024 (ticker remains HLNG).
- Headquarters: Bermuda (legal domicile) with operational presence in Norway and globally.
- Industry: Marine energy infrastructure owner/operator of Floating Storage & Regasification Units (FSRUs), LNG carriers, and increasingly floating terminals for clean energy vectors (hydrogen, ammonia) and carbon transport & storage.
History and Background
- The roots of the company trace back to Leif Høegh & Co. founded in 1927, originally in shipping and oilâ€related transport.
- In 1973 the predecessor company ordered the world’s first LNG carrier with a Mossâ€type containment system ("Norman Lady").
- In 2006 the business segments were restructured: Höegh LNG (floating LNG infrastructure) and Höegh Autoliners became separate with a common holding company.
Key Developments and Strategic Initiatives
- The company is arguably one of the global leaders in the FSRU market converting LNG carriers or building new floating import terminals to serve gas importing countries.
Strong performance in 2023: In its 2023 Annual Report, Höegh LNG reported the highest net result in its history, driven by FSRU deliveries to Europe. - In September 2024 the company changed its name to Höegh Evi to reflect broadened focus on “energy vector infrastructure” beyond just LNG (i.e., hydrogen, ammonia, CCS).
Mergers & Acquisitions
- In September 2022 the company completed the acquisition of all outstanding common units of Höegh LNG Partners LP (NYSE: HMLP).
- In March 2023 the company announced a completed acquisition of LNG carrier “Golar Seal” (renamed Höegh Gandria) to add to its fleet.
Partnerships & Collaborations
- On 28 June 2024, the company signed an agreement with Deutsche ReGas (Germany) to develop a floating hydrogen import terminal (Lubmin) with ammonia cracker technology producing hydrogen from imported ammonia via a floating barge solution.
- On 20 January 2025, the company (Höegh Evi) entered a Memorandum of Understanding (MoU) with SEFE (Securing Energy for Europe) to develop international clean-hydrogen supply chains using floating import infrastructure.
Product Launches / Innovations
- The company is pioneering a floating ammonia-to-hydrogen cracker concept embedded into a floating barge solution part of its hydrogen import terminal developments in Germany.
- Hybrid FSRU concept (patent-pending) announced: On the history page (2023 timeline) it mentions a “hybrid FSRU concept utilizing an industrialâ€scale ammonia cracker onboard the vessel.”
Key Technology Focus Areas
- Floating Storage & Regasification Units (FSRUs): core business, providing flexible LNG import solutions.
- Hybrid/dual-vector marine terminals: extending from LNG to ammonia/hydrogen import infrastructure.
- Ammonia as hydrogen carrier + onboard ammonia cracking: technology to convert ammonia into hydrogen for downstream supply chains.
- Carbon transport & storage (CCS): development of floating COâ‚‚ storage (FCSO), shuttle tankers, subsea injection.
R&D Organisation & Investment
- In April 2023, the company (with Wärtsilä, IFE, BASF SE, etc) received EUR 5.9 million in funding from the
- Norwegian Government’s “Green Platform” programme to develop a solution using ammonia as hydrogen carrier in floating terminals.
- The 2023 Annual Report notes the launch of a comprehensive clean energy strategy reflecting investment in new infrastructure and clean molecule import solutions.
SWOT Analysis
Strengths
- Leading position in the FSRU market with substantial fleet experience; the company is recognized as a pioneer.
- Flexible marine infrastructure business model (floating terminals) gives speed, mobility and lower landâ€footprint compared to onshore terminals.
- Strong strategic partnerships and evolving portfolio into clean energy vectors (hydrogen, ammonia, CCS) which aligns with global energy transition trends.
- High recent financial performance (2023 record net result) indicating operational strength.
Weaknesses
- Heavy reliance historically on LNG import infrastructure (a fossil fuel), which may face headwinds as decarbonisation accelerates.
- Large capital expenditure requirements for fleet, conversions, and new floating infrastructure exposure to cost overruns, delays or unchartered assets.
- Regulatory, technological and market risk in hydrogen/ammonia and CCS segments newer business areas with less proven track records.
Opportunities
- Growing global demand for LNG import terminals (especially in regions shifting away from pipeline gas supply).
- Expansion into clean energy import infrastructure: green hydrogen, ammonia, and CCS offer new revenue streams and long-term relevance.
- Partnering with utilities and national governments seeking flexible, fast-deploy solutions to energy security and transition.
- Ability to repurpose or convert existing vessels into new infrastructure (hybrid terminals) offering assetâ€utilization benefits.
Threats
- Energy transition risk: if LNG demand declines faster than infrastructure lifetimes, there is risk of under-utilized FSRUs.
- Competition: other major players in LNG/FSRU market may drive down pricing or capture key contracts.
- Technology and regulatory risk in clean energy segments: e.g., hydrogen cost competitiveness, ammonia supply chains, CCS acceptance.
- Geopolitical and supply chain risks: floating infrastructure often deployed in regions with regulatory/political complexity, exposure to marine incident risk.
Recent News & Strategic Updates
- Name change: On 16 September 2024 (formally registered 18 September) the company announced its rename from Höegh LNG to Höegh Evi, emphasising “energy vector infrastructure”.
- Hydrogen/Ammonia Terminal: In June 2024, the deal with Deutsche ReGas to build the “H2-Importâ€Terminal Lubmin” (floating ammonia cracker for hydrogen production) was announced.
Other Top Companies List
- Royal Dutch Shell plc: The London-based company performs operations like oil & gas production, distribution, exploration, marketing, and refining.
- ExxonMobil Corporation: The largest oil & gas company consists of business divisions like upstream services, product solutions, and low carbon solutions.
- Chevron Corporation: The multinational energy company performs upstream and downstream operations for various oil & gas products.
- BP plc: The UK-based company performs downstream, upstream, and midstream operations for the oil & gas industry.
- Mitsui O.S.K. Lines, Ltd. (MOL)
- Excelerate Energy, Inc.
- Golar LNG Limited
- BW LNG
- Hyundai Heavy Industries Co., Ltd.
- Samsung Heavy Industries Co., Ltd.
- Karpowership
- Petronas
- GasLog Ltd.
Segments Covered
By Type
- LNG Infrastructure
FSRU
By Component
- Liquefaction Terminals
- Regasification Terminals
- Storage Facilities
- Transportation
By LNG Infrastructure Type
- Onshore Terminals
- Offshore Terminals
By Capacity
- Small-Scale
- Large-Scale
By Application
- Power Generation
- Industrial
- Transportation
- Residential & Commercial
By Region
- North America
- U.S.
- Canada
- Mexico
- Europe
- Germany
- UK
- France
- Italy
- Spain
- Asia Pacific
- China
- India
- Japan
- South Korea
- Latin America
- Brazil
- Argentina
- Middle East & Africa
- Saudi Arabia
- South Africa
A Seven-Phase Framework
Our methodology is designed to be universally applicable across commodity chemicals, specialty chemicals, petrochemicals, construction chemicals, coatings, electronic chemicals, industrial gases, agrochemicals, water treatment chemicals, and performance materials. Each phase builds upon the last, creating a layered validation structure that minimizes estimation error and maximizes analytical confidence.
The framework ensures comprehensive market coverage, robust cross-validation, and reliable long-term forecasting — producing market estimates that withstand scrutiny from investors, regulators, and corporate strategy teams.

Seven-Phase Framework — Analytical Effort Distribution
Relative analytical effort allocated across each phase of the Chemicals & Materials research framework

Phase 1 - Secondary Research: Establishing the Foundation
Secondary research collects and evaluates publicly available information from authoritative sources, establishing the foundational understanding of market structure, value chain dynamics, competitive landscape, and end-use demand patterns. Every source is evaluated for credibility, recency, geographic relevance, and methodological soundness before inclusion.
Industry Associations
Sources include ACC, CEFIC, ICCA, JCIA, CPCIF, and SOCMA providing production volumes, consumption trends, capacity developments, and sustainability initiatives.
Company Disclosures
Annual reports, investor presentations, earnings transcripts, and regulatory filings reveal product portfolios, manufacturing footprints, capacity expansions, and revenue segmentation.
Government Databases
National statistical offices, customs authorities, environmental agencies, and industrial production databases provide verified statistics on output, trade flows, and regulatory compliance.
Trade Databases
UN Comtrade, ITC, Eurostat, and national customs authorities enable assessment of global product movement, import dependency, and export competitiveness across regions.
Our Secondary Research Sources
- Ministry of Chemicals and Fertilizers
- European Chemicals Agency
- United States Department of Energy
- Ministry of Industry and Information Technology
- Ministry of Economy Trade and Industry
- Ministry of Trade Industry and Energy
- National Institute of Standards and Technology
- Council of Scientific and Industrial Research
- Fraunhofer Society
- National Institute for Materials Science
Phase 2 — Supply-Side Assessment: Mapping Production Capabilities
Production Capacity Analysis
All major manufacturers are assessed for existing installed capacity, planned additions, expansions, new plant announcements, and technology adoption — mapped at global, regional, and country levels.
Capacity Utilization Adjustment
Installed capacity is adjusted using utilization rates based on demand conditions, feedstock availability, plant operating rates, maintenance schedules, and regulatory restrictions.
Manufacturer Revenue Analysis
Product-specific revenues, segment-level performance, regional distribution, average selling prices, and margin trends are evaluated to establish market value estimates.
Supply-Side Assessment — Capacity vs. Effective Production by Region
Illustrative comparison of installed capacity vs. effective production volume (after utilization rate adjustment) across major regions

Phase 3 — Demand-Side Assessment: Quantifying Chemical Consumption
Demand-side analysis quantifies chemical consumption across industries, applications, and geographies — identifying where and how chemicals are consumed throughout the value chain with precision.
End-Use Industry Analysis
Chemical demand is evaluated across automotive, construction, packaging, electronics, agriculture, healthcare, consumer goods, industrial manufacturing, energy and utilities, and water treatment. Industry output, production trends, and consumption intensity are analyzed to determine demand patterns.
Consumption Modeling
Demand is estimated using measurable indicators: kilograms per vehicle, kilograms per square meter of construction, dosage per cubic meter of water treated, kilograms per hectare of agricultural land, and kilograms per ton of manufactured products. Consumption factors are validated through industry publications and primary interviews.
Application Analysis
The market is segmented by application area to understand product performance requirements, formulation trends, technology adoption, customer preferences, and regulatory requirements improving demand accuracy and segmentation granularity.
Demand-Side Assessment — End-Use Industry Demand Distribution
Illustrative distribution of chemical & materials demand across key end-use industries

Phase 4 - Trade Flow Analysis: Balancing Regional Supply and Demand
Trade flow analysis reconciles regional supply and demand estimates through import and export data, identifying net supply positions, regional dependencies, and market imbalances. It serves as an independent validation layer that tests the consistency of supply-side and demand-side estimates.
Import Analysis
Import data is evaluated to determine volumes, source countries, product dependency, regional supply gaps, and pricing trends — identifying markets that rely heavily on external supply and where domestic production is insufficient to meet demand.
Export Analysis
Export assessments reveal production surplus, export competitiveness, regional manufacturing strength, and global market participation. Export patterns also help validate domestic production estimates and identify net exporting regions.
Apparent Consumption Model
Regional consumption is assessed using the standard apparent consumption formula:
Results identify net importing regions, net exporting regions, regional deficits, and surpluses — serving as an independent validation of supply and demand estimates.
Trade Flow Analysis — Net Supply Position by Region
Illustrative apparent consumption vs. domestic production across major regions — positive gap indicates net import dependency

Phase 5 — Primary Research: The Critical Validation Layer
Primary research tests and refines findings from secondary research through direct engagement with industry participants across the supply chain, demand side, and expert community. It captures intelligence that no database or published report can provide — the real-world experience of manufacturers, buyers, and specialists operating in the market.

Supply-Side Interviews
Conversations with chemical manufacturers, raw material suppliers, contract manufacturers, technology providers, and plant operators cover production trends, capacity utilization, pricing developments, technology shifts, and competitive dynamics.

Demand-Side Interviews
Engagement with OEMs, industrial consumers, procurement managers, distributors, formulators, and end-use manufacturers focuses on consumption trends, purchasing behavior, product substitution, demand outlook, and emerging applications.

Industry Expert Consultations
Additional interviews with industry consultants, independent experts, regulatory specialists, technical professionals, and research institutions provide deeper market context and validate key analytical assumptions.
Focus Areas of Primary Research:
Market Size & Forecast Validation
Revenue estimates, volume consumption, growth rates, forecast assumptions, regional demand.Supply Chain & Value Chain Assessment
Raw material sourcing, supply chain challenges, distribution networks, procurement practices.Production & Capacity Analysis
Manufacturing capacity, utilization rates, expansion projects, plant investments.Pricing & Cost Structure Analysis
Product pricing trends, feedstock costs, energy costs, margin pressures, pricing outlook.Competitive Landscape Assessment
Volume and value estimates confirmed to be fully consistent with one another before publicationInterview Volume by Market Scope
| Study Scope | Number of Interviews |
|---|---|
| Niche Market | 20 – 30 |
| Mid-Sized Market | 30 – 50 |
| Global Market | 50 – 80 |
| Highly Fragmented Market | 80 – 120 |
Interview Details:
Category : Manufacturers, Suppliers, Distributors, End Users, Experts/Associations
Average Duration : 30–60 Minutes
Interview Mode : Video calls, telephonic interviews, expert consultations
Interview Format : Structured / Semi-Structured questionnaire
Focus Areas of Primary Research:
Market Size & Forecast Validation :
Revenue estimates, volume consumption, growth rates, forecast assumptions, regional demand.
Supply Chain & Value Chain Assessment :
Raw material sourcing, supply chain challenges, distribution networks, procurement practices.
Production & Capacity Analysis :
Manufacturing capacity, utilization rates, expansion projects, plant investments.
Pricing & Cost Structure Analysis :
Product pricing trends, feedstock costs, energy costs, margin pressures, pricing outlook.
Competitive Landscape Assessment :
Market share, competitor positioning, strategic initiatives, partnerships, acquisitions.
Primary Research — Stakeholder Coverage by Category
Distribution of interview respondents across stakeholder categories (% share from PPT data)

Primary Research — Respondent Designation Profile
Seniority breakdown of interview respondents (% share from PPT data)

Primary Research — Geographic Coverage of Interviews
Regional distribution of primary research engagement (% share from PPT data)

Phase 6 — Data Triangulation and Market Validation
No single methodology is relied upon in isolation. Multiple independent estimation approaches are combined and reconciled to ensure consistency, accuracy, and analytical defensibility. Any material deviations between approaches are investigated and adjusted through additional validation cycles.
The final market size is derived through weighted triangulation of all validated methodologies. Any material deviations between approaches are investigated and adjusted through additional validation cycles. The outcome represents the most realistic assessment of the market based on available evidence and expert confirmation ensuring that volume and value estimates are fully consistent with one another.
Triangulation Framework — Input Contribution Weight
Relative weight each sizing input contributes to the final reconciled market estimate

Phase 7 — Forecast Modeling: Projecting Future Market Evolution
Forecasting evaluates the future trajectory of the market using a combination of quantitative indicators and qualitative assessments across economic, industry, and regulatory dimensions. Rather than simple extrapolation, each driver is independently modeled and integrated into a composite forecast.
Macroeconomic Indicators
GDP growth, industrial production, manufacturing output, construction activity, consumer spending, and capital investment form the quantitative foundation of long-term demand projections. These are applied at country, regional, and global levels.
Industry Growth Drivers
Urbanization, infrastructure development, industrialization, technological innovation, sustainability initiatives, and evolving product performance requirements are assessed at regional and industry levels — capturing both structural and cyclical demand drivers.
Capacity Expansion Analysis
Announced plant expansions, new manufacturing facilities, technology upgrades, and strategic investments are evaluated to determine future supply-demand dynamics and potential market tightness or oversupply situations.
Regulatory & Sustainability
Environmental regulations, chemical safety standards, emission reduction targets, circular economy initiatives, and sustainability requirements are incorporated as they often influence product adoption rates and market growth trajectories.
Scenario Forecast Range — Indexed Market Growth (Year 1–10)
Illustrative indexed growth trajectories across Base, Optimistic, and Pessimistic scenarios over a 10-year forecast horizon

Forecast Drivers — Relative Impact Score by Category
Impact score (0–100) of each driver type on chemicals & materials market forecast




Comments
Share your thoughts, ask a question, or provide feedback about this report.