
Bio-based Surfactants Market Size Analysis Report 2035
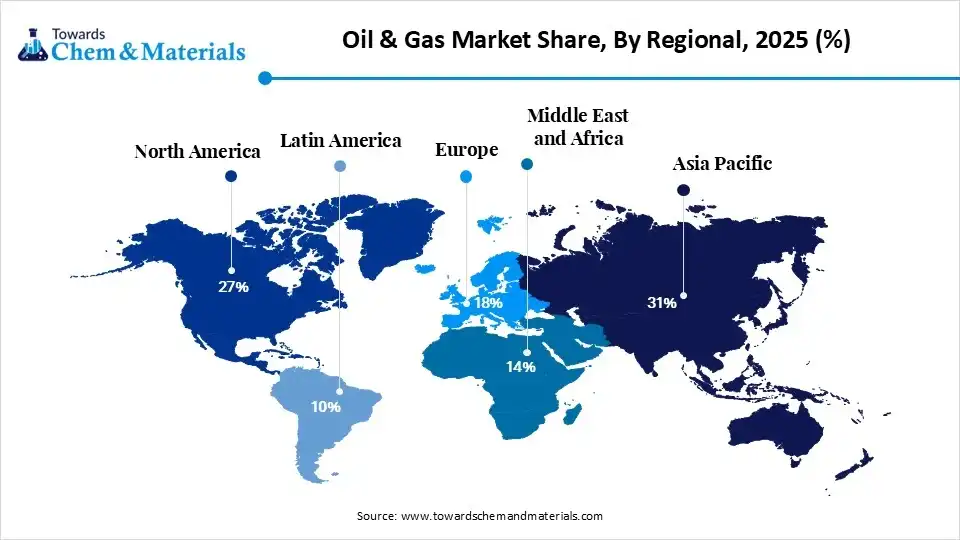
The global oil & gas market size was valued at USD 7.19 trillion in 2025, is estimated to reach USD 7.47 trillion in 2026, and is projected to reach USD 10.59 trillion by 2035, exhibiting a compound annual growth rate (CAGR) of 3.95% over the forecast period from 2026 to 2035. Asia Pacific dominated the oil & gas market with the largest revenue share of 31% in 2025 and is expected to grow at the fastest CAGR of 4.59% during the forecast period. In terms of volume, the oil & gas industry is projected to grow from 285.11 billion barrels of oil equivalent in 2025 to 342.47 billion barrels of oil equivalent by 2035. growing at a CAGR of 1.85% from 2026 to 2035. The market expansion is propelled by decarbonization goals, a focus on supply chain resilience, mega-mergers & corporate alliances, industrial automation, and renewable energy expansion.
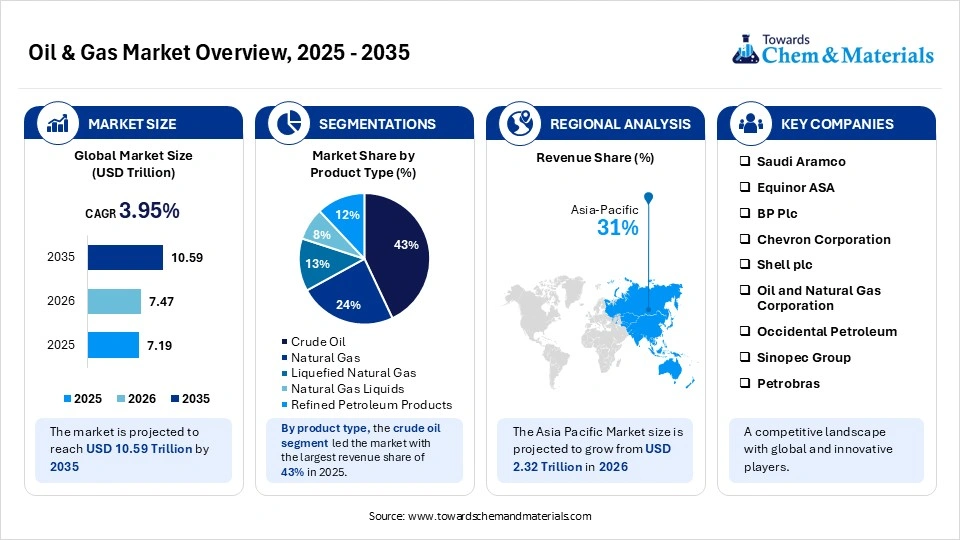
The oil & gas market is defined by its complex industrial ecosystem, balancing economic productivity and geopolitical framework. The market is characterized by three major stages includes upstream exploration and manufacturing, midstream transportation infrastructure, and downstream processing operations, that driving the demand for oil & gas in petrochemical and transit fuels. The rising focus on clean technology is boosting the scaling of blue hydrogen manufacturing as an alternative fuel, which is driving the market expansion. The global suppliers transition towards localized sourcing and strategic oilfield contracts for a stable supply chain.
The regulatory compliance for decarbonization and energy transition enables the carbon capture and utilization installations and renewable energy as a green alternative. The strategic collaboration and agreement governed by commodity benchmarking indexes boost the trade dynamics and supply chain resilience. The market focus expansion of liquefaction facilities that enhance the scaling of maritime LNG transit infrastructure to meet social, environmental, and governance standards. The operators preferred institutional financial exclusion through specialized cryogenic transport containers for clean-burning and electricity generation.
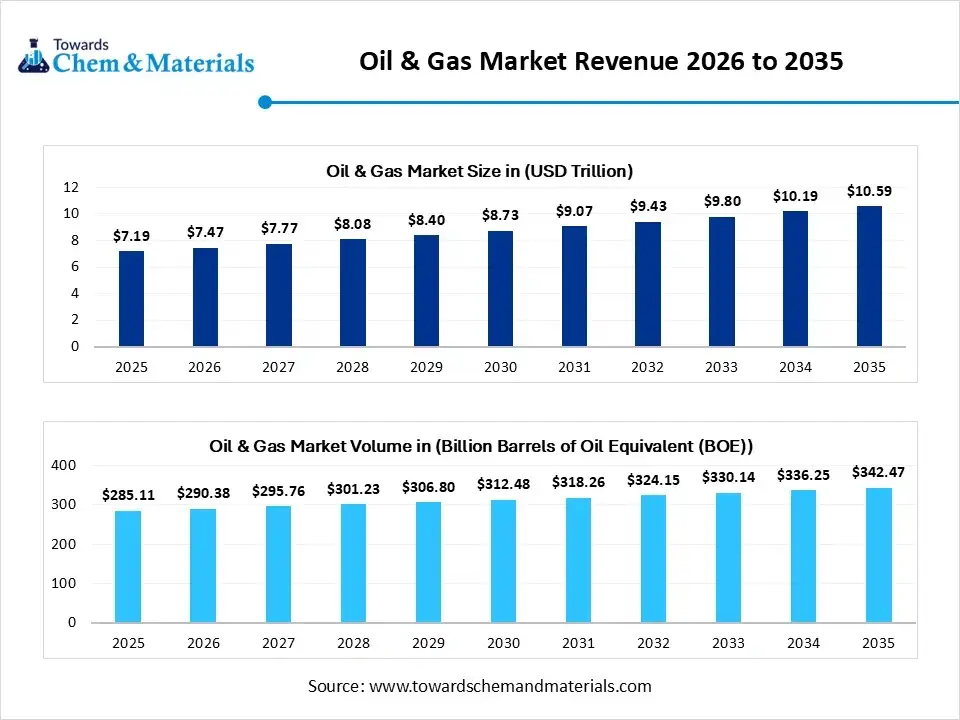
The oil & gas sector is deploying field automation and digital operations that offer protection against natural field degradation and diminishing reservoir yields. The commercial integration of subsurface machine learning and a cloud-driven virtualization platform that eliminates unnecessary field downtime. The implementation of autonomous drilling and robotic extraction drives down the extraction cost and improves operational field safety. Additionally, technological innovation is boosting the continuous methane emission monitoring by ensuring legal precision and corporate financial reporting.
Market Highlights
- By region, Asia Pacific dominated the oil & gas market by holding 31% share in 2025 and is expected to grow at the fastest with a CAGR of 5.10% during the forecast period, driven by industrialization and urban consumer demand for hydrocarbon and domestic energy security.
- By region, North America held the 27% market share in 2025 and expects notable growth in the market with 3.70% CAGR during the forecast period due to its shale production and expanding LNG export capacity.
- By value chain, the upstream segment dominated the market with the largest share of 41% in 2025, driven by exploration and production activities.
- By value chain, the midstream segment held 27% market share in 2025 and is expected to grow at the fastest CAGR of 4.3% over the forecast period due to pipeline and storage infrastructure investment with expanding LNG trade.
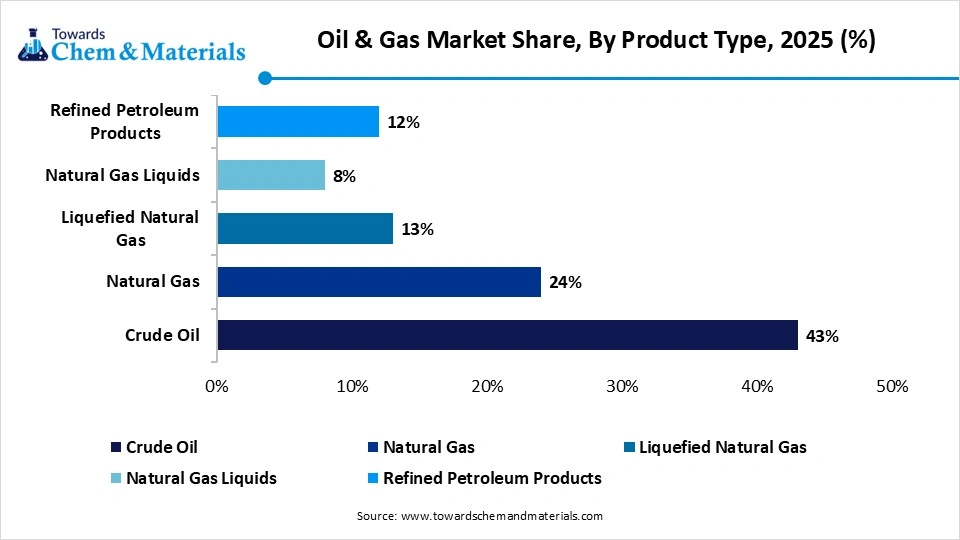
- By product type, the crude oil segment dominated the market with the largest share of 43% in 2025, driven by OPEC production strategies and refining expansion in logistics and petrochemical sectors.
- By product type, the liquefied natural gas segment held 13% market share in 2025 and is expected to grow at the fastest CAGR of 6.7% over the forecast period, driven by the marine fuel transition and energy diversification approach.
- By application, the transportation fuels segment dominated the market with the largest share of 46% in 2025 due to expanding vehicle fleets' demand for gasoline, liquid fuel, and diesel.
- By application, the petrochemicals and specialty products segment held 8% market share in 2025 and is expected to grow at the fastest CAGR of 5.3% over the forecast period due to investment in hydrocarbon feedstock and demand for plastic and synthetic materials.
From Exploration to Distribution: Inside the Oil & Gas Value Chain
At its core, the oil and gas sector is about getting hydrocarbons crude oil and natural gas out of the ground and delivering them to the global market. Because it powers everything from manufacturing to daily transportation, this industry acts as a major anchor for global economies and geopolitics. The entire process is traditionally split into three distinct phases: upstream (finding and extracting the resource), midstream (moving and storing it), and downstream (refining and selling the final products).
Today, the industry is balancing traditional demands with new pressures. While global energy needs and breakthroughs in drilling tech like deepwater exploration and advanced fracturing continue to push production forward, the focus is visibly shifting. Companies are navigating a tight rope between meeting current fuel needs and adapting to strict environmental regulations. This has sparked a massive wave of digital automation on the ground, alongside major investments in LNG, hydrogen, and carbon reduction strategies as the sector maps out its long-term future.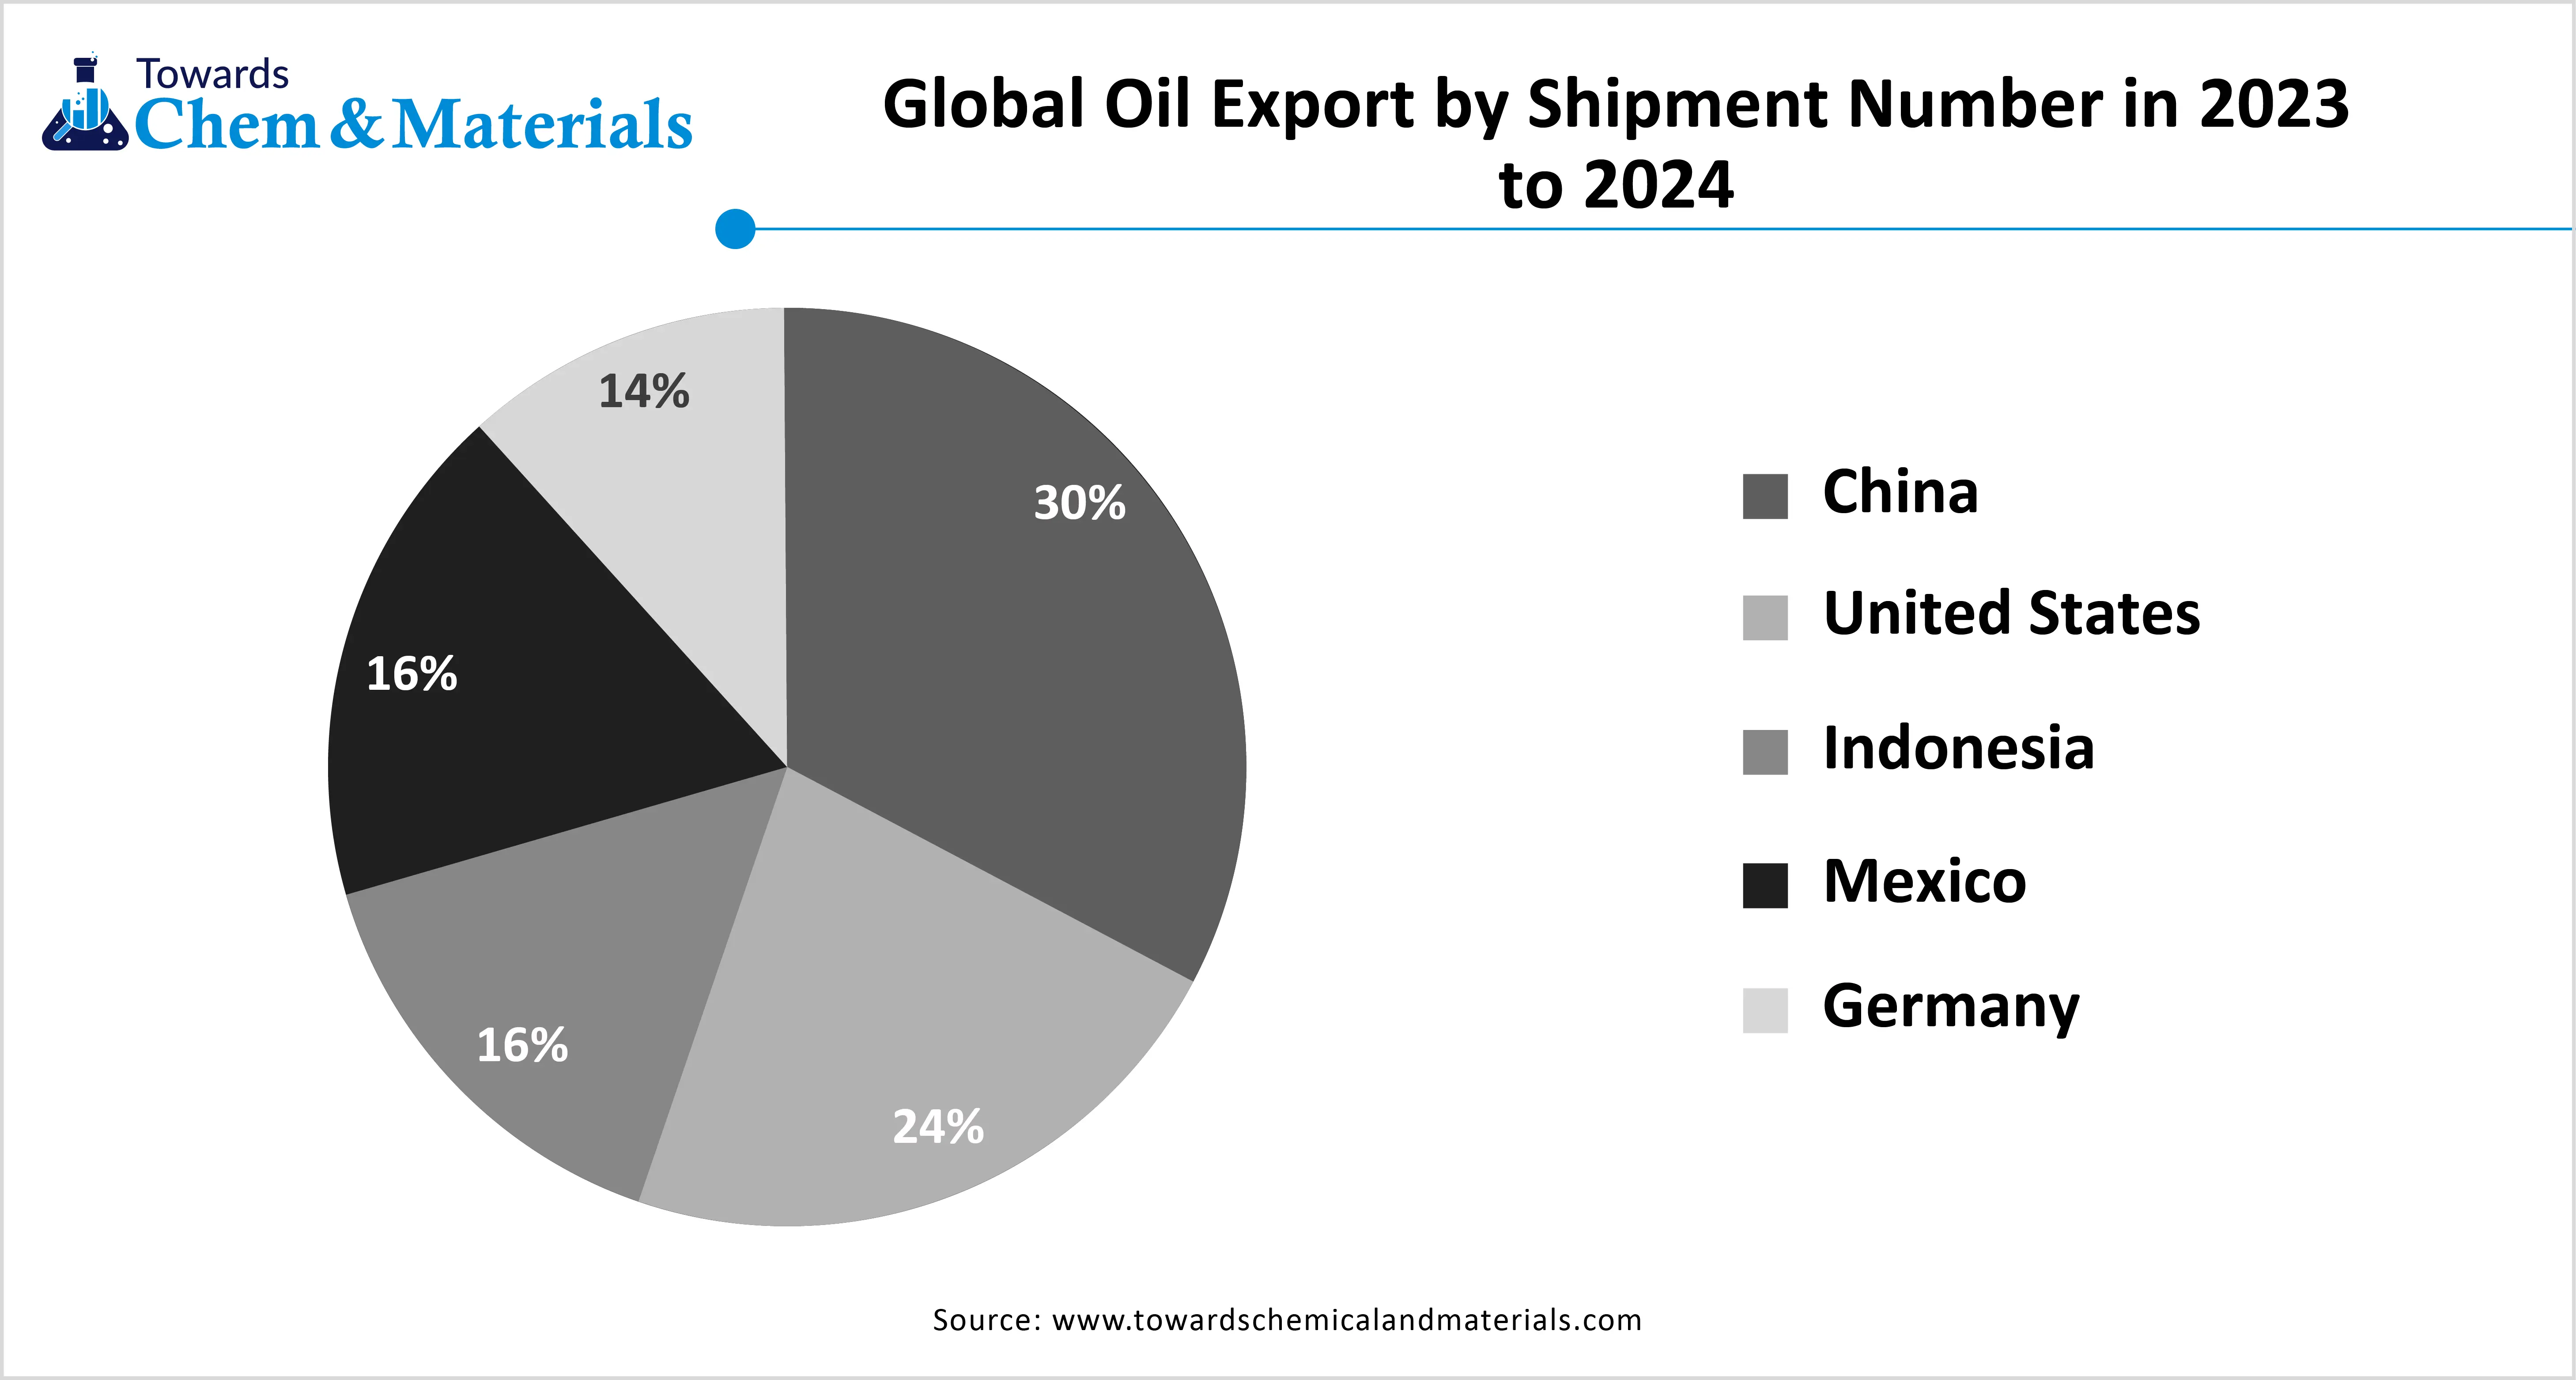
Which Factor Is Driving the Oil & Gas Market?
The global need for energy is spearheading the industry growth in the current period. Moreover, oil & gas are considered the major fuel option in the heavy manufacturing industries or their machinery. Furthermore, even with the release of renewable energy, oil and gas remain crucial due to factors such as reliability and easy transportation in recent years, as per the latest market survey.
Market Trends
- Industrial Shift Towards Decarbonization: The upstream and downstream industry focuses on a carbon capture, utilization, and storage ecosystem through substantial corporate investment to meet low-carbon hydrogen and net-zero commitments.
- Automation in Methane Emission Monitoring: The operators focus on orbital satellite imaging and sensor-driven airborne drones by offering instantaneous detection of greenhouse gas leaks in active pipelines.
Market Report Scope
| Report Attribute | Details |
| Market Size and Volume in 2026 | USD 7.47 Trillion/ 290.38 Billion Barrels of Oil Equivalent |
| Revenue Forecast in 2035 | USD 10.59 Trillion/ 342.47 Billion Barrels of Oil Equivalent |
| Growth Rate | CAGR 3.95% |
| Base Year of Estimation | 2025 |
| Forecast Period | 2025 - 2035 |
| Dominant Region | Asia Pacific |
| Segment Covered | By Value Chain, By Product Type, By Application, By Regions |
| Key Companies Profiled | Saudi Aramco, Equinor ASA, BP Plc, Chevron Corporation, Shell plc, Oil and Natural Gas Corporation, Occidental Petroleum, Sinopec Group, Petrobras, Eni S.p.A, Gazprom, Repsol S.A., Woodside Energy, Rosneft Oil Company, TotalEnergies SE |
Key Technological Shifts and AI in the Oil & Gas Market
Technological integration is revolutionizing oil & gas field engineering into data-driven infrastructure via digital asset optimization & subsurface robotic learning. The cloud-driven network runs real-time monitoring. The predictive digital twin enables geological precision and high-yield hydrocarbon synthesis in well-established basins.
The autonomous drilling rigs align with robotic pipe-handling arrays lowers per-barrel operational cost.
Manufacturers are increasingly integrating orbital satellite imaging with computer intelligence for methane emission monitoring. Artificial Intelligence optimizes the maritime pathway of the specialized LNG ecosystem by enabling refinery yield and quality of oil.
Supply Chain Analysis of the Oil & Gas Market
- Exploration and Manufacturing: The upstream sector utilizes high-resolution three-dimensional seismic surveying, gravity modeling, and magnetics focus on hydrocarbon and fluid extraction from subsurface geological identification, reservoir quality, and supply chain interdependence.
- Key Players: ExxonMobil Corporation, Chevron Corporation, Shell plc., SLB (Schlumberger), and Baker Hughes
- Logistics and Storage: The stage focuses on logistical vascular network, long-distance transit, and high-volume storage of unrefined resources. The LNG transport vessels are monitored by a supervisory control and data acquisition infrastructure.
- Key Players: Kinder Morgan, Inc., Enbridge Inc., Cheniere Energy, Inc., Mitsui O.S.K. Lines, and Enterprise Products Partners L.P.
- Refinery Processing and Marketing: The stage of refining yields through fluid catalytic crackers and chemical reactors. The diversified chemical manufacturing and retail marketing infrastructure to meet strict carbon emission taxes.
- Key Players: TotalEnergies SE, Reliance Industries Limited, Marathon Petroleum Corporation, BASF SE, and Valero Energy Corporation
Regulatory Framework: Oil & Gas Market
| Region | Key Regulations | Regulatory Focus |
| European Union | EU REACH Standards, EU Methane Emissions Regulation, and Carbon Border Adjustment Mechanism | Strict import standards and decarbonization mandates for carbon tracking, detection, and repair of the oil & gas network. The standards focus on legal binding nature of net-zero alignment. |
| North America | Environmental Protection Agency, BLM, Bureau of Safety and Environmental Enforcement, Federal Energy Regulatory Commission. | Focus on safety and regulation for interstate pipeline and LNG export terminal approvals. Strict methane fee penalties and financial-grade ESG disclosure tracking. |
| Middle East and Africa | Organization of the Petroleum Exporting Countries orders, Saudi Ministry of Energy, ADNOC in Aramco | Regulation for preservation of domestic hydrocarbon and state-driven flaring bans of industrial carbon capture and utilization system, and local fuel pricing controls |
| Asia Pacific | Ministry of Petroleum and Natural Gas, Natural Gas Regulatory Board, and Directorate General of Hydrocarbons | Standards of open acreage licensing policies for domestic filling and deepwater gas pricing. The strict safety audits for complex deepwater offshore infrastructure. |
| Latin America | National Agency of Petroleum, ANP in Brazil, National Hydrocarbons Commission | Management for deepwater pre-salt blocks and structuring offshore production contracts surrounding resource nationalism. |
Market Dynamics
Driver
Expanded LNG Infrastructure and Supply Chain Resilience
The global energy transition is driving the oil & gas market growth. The rising focus on implementing the liquefied natural gas value chain. Liquefaction hubs and export facilities are increasingly investing in gas export infrastructure for superior logistics and transit. The surge for supply chain resilience enables the reengineering and fabrication of advanced and high-capacity specialized LNG transport vessels integrated with modern cryogenic containment systems. To replace emission-heavy coal and eliminate single-source supply lines fueling the rapid scaling of flexible transit fuel infrastructure by offering a reliable, stable solution for a modern energy shift to meet carbon-neutrality targets.
Restraints
Falling Reservoir Quality and Asset Geology
The oil & gas market key refiners and manufacturers are focusing on geological limitation which enable the production decline curves. The oilfield requires water-separation technologies and an ultra-deepwater environment for drilling and hydrocarbon products, which drives the technical complexity and operational risks that restrain the market expansion.
Opportunity
Scaling of CCU and Blue Hydrogen
The market demand for decarbonization in logistics and the maritime sector is driving the diversified opportunity for an industrial-scale carbon capture & utilization ecosystem. The cement manufacturing, chemical refining, and steel fabrication sector shift towards new establishments of infrastructure-driven low-carbon revenue streams to create high-margin carbon credits and separate greenhouse gases. Additionally, manufacturers are rapidly scaling blue hydrogen production by integrating advanced carbon capture technologies for heavy industries. The domestic hydrogen hubs utilize blue hydrogen as a clean energy asset to end-user industries.
Segmental Insights
Value Chain Insights
The upstream segment dominated the market with the largest share of 41% in 2025, driven by exploration and production activities that make the upstream key for supply chain resilience and baseline ecosystem. The rising implementation of advanced seismic imaging and geophysical surveys in modern energy security, data centers, and power grids. The offshore and onshore exploration shift towards natural gas extraction by integrating digital oilfield technologies, boosting the production of shale oil, conventional products, and tight gas.
The midstream segment held the 27% market share in 2025 and is expected to grow at the fastest CAGR of 4.3% over the forecast period. It represents a key segment of transportation, storage, and processing of raw petroleum and natural gas by implementing smart manufacturing. The transportation includes the pipeline and LNG carriers, and rail transport. The midstream sector comprises initial processing include gas fractionation facilities and dehydration. The oil & gas operators focus on the expansion of LNG liquefaction and high-value NGL through tank farms, storage terminal and underground storage.
The downstream segment held the 32% market share in 2025, serving as a key stage for raw hydrocarbon transformation into high-value industrial and commercial sectors. The downstream segment involves crude oil refining, retail fuel, and bulk distribution and marketing by using advanced petrochemical plants. The modern downstream operators are investing in refinery configuration modernization to manufacture cleaners and low-emission fuels. Wholesale marketing and distribution allow fuel terminals and gas stations to integrate digital optimization by ensuring superior operational efficiency.
Oil & Gas Market Share, By Value Chain, 2025 (%)
| By Value Chain | Revenue Share, 2025 (%) |
| Upstream | 41% |
| Midstream | 27% |
| Downstream | 32% |
Product Type Insights
The crude oil segment dominated the market with the largest share of 43% in 2025, serving as a key liquidity catalyst and petrochemical feedstock for manufacturing and logistic framework. The crude oil offers superior density and ideal chemical compositions like light sweet crude, heavy crude, and sour crude that enhance refining profitability and oil & gas product yield. The shift towards superior maritime logistics efficiency and optimizing feedstock blending makes crude oil key for modern downstream petrochemical manufacturing.
The natural gas segment held the 24% market share in 2025. The rising focus on modern energy transition fuel and low-carbon alternative make natural gas key for petrochemical, fertilizers ad plastics manufacturing. The natural gas offers higher operation resilience and versatility that is processed to remove impurities and isolate valuable natural gas liquids and liquified natural gas. This product acts as a chemical feedstock that is utilized in residential heating, power grids, industrial manufacturing, and to stabilize renewable energy intermittency.
The liquefied natural gas segment held the 13% market share in 2025 and is expected to grow at the fastest CAGR of 6.7% over the forecast period. It is a high-liquidity seaborne commodity asset that transforms super-cooling natural gas into a liquid state to compress its volume by 600 times. The substantial investment in liquefaction facilities for export and domestic regasification terminals for import makes LNG a key for high-growth maritime and baseload energy transition.
The refined petroleum products segment held 12% market share in 2025, driven by its versatility as a chemical feedstock utilized in the transportation sector and industrial manufacturing. The refined petroleum products are produced using the processing of crude oil in refineries through catalytic cracking and fractional distillation. The segment is divided into light distillate, heavy residue, and middle distillate, like diesel, jet fuels, which are accelerating the demand in the petroleum and industrial sectors.
The natural gas liquids segment held 8% market share in 2025, defined by low-cost chemical feedstock required for the manufacturing of plastics, household resins, and synthetic rubbers. The NGL is non-methane hydrocarbons that contain ethane, propane, and butane, which are co-extracted during gas production as a liquidity driver separated at specialized fractionation hubs, which is crucial for upstream extraction and consumer goods production.
Oil & Gas Market Share, By Product Type, 2025 (%)
| By Product Type | Revenue Share, 2025 (%) |
| Crude Oil | 43% |
| Natural Gas | 24% |
| Liquefied Natural Gas | 13% |
| Natural Gas Liquids | 8% |
| Refined Petroleum Products | 12% |
Application Insights
The transportation fuels segment dominated the market with the largest share of 46% in 2025. The oil & gas industry is a mobility driver and key to stable supply chain logistics. The operators focus on advancing refinery configuration to create ultra-low sulfur diesel and sustainable aviation fuel to meet stringent emissions targets, driving the market growth. The transportation application utilized LPG, gasoline, jet fuel, and diesel by integrating with advanced crude oil refineries.
The petrochemicals and specialty products segment held the 8% market share in 2025 and is expected to grow at the fastest CAGR of 5.3% over the forecast period. The rising downstream sector focuses on converting refined chemical feedstock into key industrial components by utilizing chemical crackers in olefins and aromatics production. The shift towards the adoption of specialty products involves industrial solvents, advanced lubricants, asphalt ad specialized waxes for chemical manufacturing, boosting the market expansion. The integration of the refinery-to-chemical process to maximize operational efficiency.
The industrial energy segment held the 21% market share in 2025, acting as a heavy-duty operational catalyst that supplies stable thermal power and reliable baseload electricity, key for mining operations, modern manufacturing, and heavy chemical processing. The industrial energy sector demands petroleum coke, natural gas, and fuel oil for industrial operations to meet carbon-neutral commitments. The industry is implementing combined heat and power systems and automated energy management to maximize industrial productivity.
The power generation segment held 18% market share in 2025, because it converts raw hydrocarbons into flexible electricity that is key for gas-fired power and diesel-based backup infrastructure. The power generation sector is installing advanced combined-cycle gas turbine systems and artificial intelligence data centers. The oil & gas market is key for a higher grid-stabilisation mechanism by balancing renewable energy intermittency & carbon-neutral goals.
Oil & Gas Market Share, By Application, 2025 (%)
| By Application | Revenue Share, 2025 (%) |
| Transportation Fuels | 46% |
| Power Generation | 18% |
| Industrial Energy | 21% |
| Residential and Commercial Heating | 7% |
| Petrochemicals and Specialty Products | 8% |
Regional Insights
How Did the Asia Pacific Dominated the Oil & Gas Market in 2025?
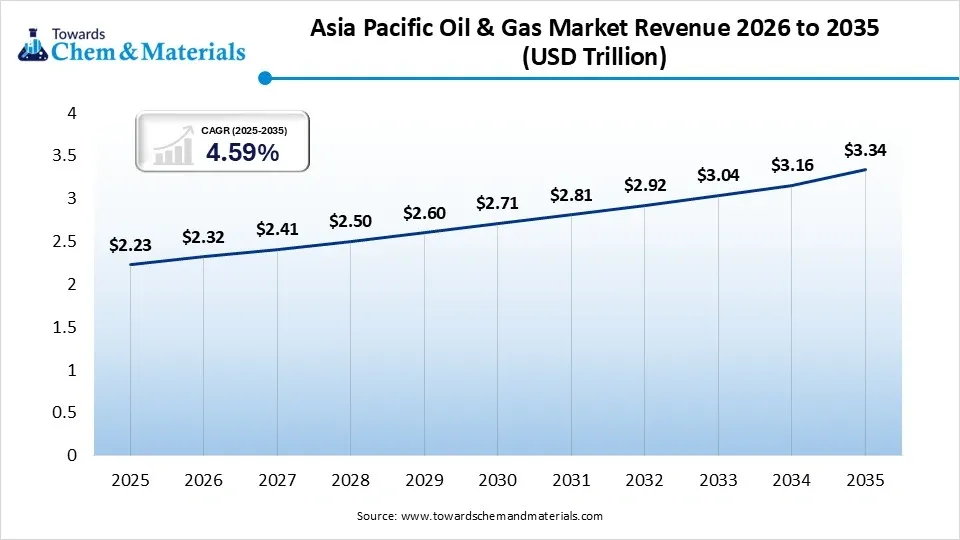
The Asia Pacific oil & gas market size was estimated at USD 2.23 trillion in 2025 and is projected to reach USD 3.34 trillion by 2035, growing at a CAGR of 4.59% from 2026 to 2035.Asia Pacific dominated the market by holding 31% share in 2025 and is expected to grow at the fastest with a CAGR of 5.10% during the forecast period. The regional transformation is driven by industrial oil capacity development and a rising urban population. The domestic focus on deepwater drilling and LNG infrastructure to support the energy transition is accelerating market growth. The Asia Pacific carbon-reduction initiative and clean transition mandates enable rapid scaling of oil production. Additionally, the region integrating digital oilfield technologies strengthen their dominance.
China
- Driven by their transition towards unconventional tight gas and deep shale exploitation to meet stringent industrial emission caps and green hydrogen blending compliance.
- China is focused on expanding underground gas storage capacity in the domestic landscape and industrial power consumption.
India
- Supported by their diversified downstream refining expansion infrastructure and city gas distribution ecosystem, construct domestic export hubs.
- The government support for revenue-sharing contracts and strict biofuel blending mandates is boosting their natural gas demand in the middle-class consumer base.
The North America oil & gas market size was estimated at USD 1.94 trillion in 2025 and is projected to reach USD 2.91 trillion by 2035, growing at a CAGR of 4.14% from 2026 to 2035. North America held the 27% market share in 2025 and is expected to experience notable growth in the market with a 3.70% CAGR during the forecast period, supported by its export-driven hubs that align with domestic fuel requirements. The regional operators utilize automated drilling rigs and advanced hydraulic fracturing infrastructure in the oil & gas sectors. The shift of the Permian basin and gulf coast driving the growth of liquefaction facilities. North America focuses on corporate consolidation, its mega-corporation and increasingly invests in methane emissions monitoring and carbon capture systems.
United States
- Represented by their stringent capital discipline and corporate consolidation that accelerating the development of LNG liquefaction facilities to meet strict pipeline safety
- The global demand for US light sweet crude is driving the integration of highly efficient horizontal drilling techniques to meet methane emission standards and economic public-interest audits.
Canada
- Due to its large-scale LNG export hubs and expanding heavy crude export capacity, supported by stringent carbon pricing mechanisms and real-time tailing pond emission real-time monitoring.
- Canada selects crude by opening a direct pathway to Asia refining infrastructure and the expansion of trans-continental pipelines.
The Europe oil & gas market size was estimated at USD 1.29 trillion in 2025 and is projected to reach USD 1.96 trillion by 2035, growing at a CAGR of 4.27% from 2026 to 2035. Europe held 18% market share in 2025, driven by its stable supply chain and shift towards liquefied natural gas imports in the maritime ecosystem. The regional players are investing in floating regasification terminals and building interconnected hydrogen-ready pipeline networks. Europe's climate-neutral mandates are reinforcing oil operators to implement advanced CCU and real-time methane monitoring. The regulatory compliance focuses on industrial energy security that driving Europe's leadership in green transition.
Norway
- Due to its zero-tolerance regulation on routine flaring and the highest carbon taxes enable corporate investment in field-electrification projects.
- Norway maintains its leadership in the transformation of depleted offshore reservoirs into a commercial carbon capture and storage hub promoted by its strong continental export pricing.
United Kingdom
- The UK is shifting towards decommissioning services and offshore wind integration to meet net-zero compliance pathways.
- The demand for domestic heating & industrial electricity assists the phase-out of fossil fuel infrastructure by imposing volatile energy profits taxes.
The Latin America oil & gas market size was estimated at USD 0.72 trillion in 2025 and is projected to reach USD 1.11 trillion by 2035, growing at a CAGR of 4.42% from 2026 to 2035. Latin America held 10% market share in 2025, accelerated by its economic realignment and geological activities driving the innovation in deepwater extraction. Domestic operators employ automated subsea robotics and real-time reservoir through foreign direct investment. Latin America adopts FPSO vessels and ultra-deep pre-salt oil in regional facilities by integrating with low-carbon extraction technologies.
Brazil
- Driven by their surge in ultra-deepwater crude manufacturing and non-OPEC global oil supply by monitoring associated gas flaring limits and strict deepwater environmental licensing protocols.
- Brazil dominated in its profitable reserves within sub-salt layers and the implementation of standardized high-volume FPSO vessels.
The Middle East and Africa oil & gas market size was estimated at USD 1.01 trillion in 2025 and is projected to reach USD 1.54 trillion by 2035, growing at a CAGR of 4.31% from 2026 to 2035. The Middle East & Africa held 14% market share in 2025. The domestic development is fostered by their cost-effective upstream production.MEA is maintaining its leadership in monumental natural gas innovation and deploying remote subsea robotics. The regional zero-routine flaring initiatives and carbon-mitigation mandates are driving the rapid expansion of spare production capacity and AI-driven reservoir management.
Oil & Gas Market Share, By Regional, 2025 (%)
| Regional | Revenue Share, 2025 (%) |
| North America | 27% |
| Europe | 18% |
| Asia-Pacific | 31% |
| Latin America | 10% |
| Middle East & Africa | 14% |
Saudi Arabia
- The domestic advancement is boosted by their integrated petrochemical mega-complexes and expansion in sustainable crude capacity by maintaining cost-effectiveness in upstream extraction.
- Saudi Arabia's substantial investment in large-scale circular carbon economy technologies and the Vision 2030 framework to meet domestic clean hydrogen compliance.
Recent Developments
- In March 2026, ST LNG selected Baker Hughes as the technology provider for its offshore LNG export terminal project in Texas. The agreement focuses on supplying gas compression and power generation technology near Matagorda.(Source: www.marinelink.com)
- In December 2025, ExxonMobil, Aramco, and Samref signed a Venture Framework Agreement to evaluate a significant upgradation of the Samref refinery and the construction of a new petrochemical complex. The key focus is to reduce emissions and improve the refinery's energy efficiency.(Source: www.aramco.com)
- In October 2025, Honeywell, Aramco, and KAUST signed a joint agreement to develop technology for the advancement of crude-to-chemicals (CTC) technology. This partnership focuses on scaling up the CTC process and reducing operational cost that helping to advance economic diversification.(Source: www.honeywell.com)
Top Companies in the Oil & Gas Market
- Saudi Aramco
- Equinor ASA
- BP Plc
- Chevron Corporation
- Shell plc
- Oil and Natural Gas Corporation
- Occidental Petroleum
- Sinopec Group
- Petrobras
- Eni S.p.A
- Gazprom
- Repsol S.A.
- Woodside Energy
- Rosneft Oil Company
- TotalEnergies SE
Segment Covered
By Value Chain
- Upstream
- Exploration
- Seismic Surveys
- Offshore Exploration
- Onshore Exploration
- Exploration
- Production
- Conventional Production
- Unconventional Production
- Shale Oil
- Tight Gas
- Midstream
- Transportation
- Pipelines
- LNG Carriers
- Rail Transport
- Storage
- Tank Farms
- Underground Storage
- Processing
- Gas Processing Plants
- Fractionation Facilities
- Transportation
- Downstream
- Refining
- Fuels Refining
- Petrochemical Refining
- Distribution
- Retail Fuel Stations
- Bulk Distribution
- Marketing
- Industrial Sales
- Commercial Sales
- Refining
By Product Type
- Crude Oil
- Light Crude
- Heavy Crude
- Sour Crude
- Natural Gas
- Conventional Gas
- Shale Gas
- Coal Bed Methane
- Liquefied Natural Gas
- Export LNG
- Bunkering LNG
- Small-scale LNG
- Natural Gas Liquids
- Ethane
- Propane
- Butane
- Refined Petroleum Products
- Gasoline
- Diesel
- Jet Fuel
- Lubricants
By Application
- Transportation Fuels
- Road Transportation
- Aviation
- Marine Transport
- Power Generation
- Gas-fired Power Plants
- Diesel-based Backup Systems
- Industrial Energy
- Manufacturing
- Mining
- Heavy Industries
- Residential and Commercial Heating
- Space Heating
- Water Heating
- Petrochemicals and Specialty Products
- Olefins Production
- Aromatics Production
- Specialty Chemicals
By Region
- North America
- U.S.
- Mexico
- Canada
- Europe
- Germany
- UK
- France
- Italy
- Asia Pacific
- China
- India
- Japan
- South Korea
- Central & South America
- Brazil
- Argentina
- Middle East & Africa
- Saudi Arabia
- UAE
A Seven-Phase Framework
Our methodology is designed to be universally applicable across commodity chemicals, specialty chemicals, petrochemicals, construction chemicals, coatings, electronic chemicals, industrial gases, agrochemicals, water treatment chemicals, and performance materials. Each phase builds upon the last, creating a layered validation structure that minimizes estimation error and maximizes analytical confidence.
The framework ensures comprehensive market coverage, robust cross-validation, and reliable long-term forecasting — producing market estimates that withstand scrutiny from investors, regulators, and corporate strategy teams.

Seven-Phase Framework — Analytical Effort Distribution
Relative analytical effort allocated across each phase of the Chemicals & Materials research framework

Phase 1 - Secondary Research: Establishing the Foundation
Secondary research collects and evaluates publicly available information from authoritative sources, establishing the foundational understanding of market structure, value chain dynamics, competitive landscape, and end-use demand patterns. Every source is evaluated for credibility, recency, geographic relevance, and methodological soundness before inclusion.
Industry Associations
Sources include ACC, CEFIC, ICCA, JCIA, CPCIF, and SOCMA providing production volumes, consumption trends, capacity developments, and sustainability initiatives.
Company Disclosures
Annual reports, investor presentations, earnings transcripts, and regulatory filings reveal product portfolios, manufacturing footprints, capacity expansions, and revenue segmentation.
Government Databases
National statistical offices, customs authorities, environmental agencies, and industrial production databases provide verified statistics on output, trade flows, and regulatory compliance.
Trade Databases
UN Comtrade, ITC, Eurostat, and national customs authorities enable assessment of global product movement, import dependency, and export competitiveness across regions.
Our Secondary Research Sources
- Ministry of Chemicals and Fertilizers
- European Chemicals Agency
- United States Department of Energy
- Ministry of Industry and Information Technology
- Ministry of Economy Trade and Industry
- Ministry of Trade Industry and Energy
- National Institute of Standards and Technology
- Council of Scientific and Industrial Research
- Fraunhofer Society
- National Institute for Materials Science
Phase 2 — Supply-Side Assessment: Mapping Production Capabilities
Production Capacity Analysis
All major manufacturers are assessed for existing installed capacity, planned additions, expansions, new plant announcements, and technology adoption — mapped at global, regional, and country levels.
Capacity Utilization Adjustment
Installed capacity is adjusted using utilization rates based on demand conditions, feedstock availability, plant operating rates, maintenance schedules, and regulatory restrictions.
Manufacturer Revenue Analysis
Product-specific revenues, segment-level performance, regional distribution, average selling prices, and margin trends are evaluated to establish market value estimates.
Supply-Side Assessment — Capacity vs. Effective Production by Region
Illustrative comparison of installed capacity vs. effective production volume (after utilization rate adjustment) across major regions

Phase 3 — Demand-Side Assessment: Quantifying Chemical Consumption
Demand-side analysis quantifies chemical consumption across industries, applications, and geographies — identifying where and how chemicals are consumed throughout the value chain with precision.
End-Use Industry Analysis
Chemical demand is evaluated across automotive, construction, packaging, electronics, agriculture, healthcare, consumer goods, industrial manufacturing, energy and utilities, and water treatment. Industry output, production trends, and consumption intensity are analyzed to determine demand patterns.
Consumption Modeling
Demand is estimated using measurable indicators: kilograms per vehicle, kilograms per square meter of construction, dosage per cubic meter of water treated, kilograms per hectare of agricultural land, and kilograms per ton of manufactured products. Consumption factors are validated through industry publications and primary interviews.
Application Analysis
The market is segmented by application area to understand product performance requirements, formulation trends, technology adoption, customer preferences, and regulatory requirements improving demand accuracy and segmentation granularity.
Demand-Side Assessment — End-Use Industry Demand Distribution
Illustrative distribution of chemical & materials demand across key end-use industries

Phase 4 - Trade Flow Analysis: Balancing Regional Supply and Demand
Trade flow analysis reconciles regional supply and demand estimates through import and export data, identifying net supply positions, regional dependencies, and market imbalances. It serves as an independent validation layer that tests the consistency of supply-side and demand-side estimates.
Import Analysis
Import data is evaluated to determine volumes, source countries, product dependency, regional supply gaps, and pricing trends — identifying markets that rely heavily on external supply and where domestic production is insufficient to meet demand.
Export Analysis
Export assessments reveal production surplus, export competitiveness, regional manufacturing strength, and global market participation. Export patterns also help validate domestic production estimates and identify net exporting regions.
Apparent Consumption Model
Regional consumption is assessed using the standard apparent consumption formula:
Results identify net importing regions, net exporting regions, regional deficits, and surpluses — serving as an independent validation of supply and demand estimates.
Trade Flow Analysis — Net Supply Position by Region
Illustrative apparent consumption vs. domestic production across major regions — positive gap indicates net import dependency

Phase 5 — Primary Research: The Critical Validation Layer
Primary research tests and refines findings from secondary research through direct engagement with industry participants across the supply chain, demand side, and expert community. It captures intelligence that no database or published report can provide — the real-world experience of manufacturers, buyers, and specialists operating in the market.

Supply-Side Interviews
Conversations with chemical manufacturers, raw material suppliers, contract manufacturers, technology providers, and plant operators cover production trends, capacity utilization, pricing developments, technology shifts, and competitive dynamics.

Demand-Side Interviews
Engagement with OEMs, industrial consumers, procurement managers, distributors, formulators, and end-use manufacturers focuses on consumption trends, purchasing behavior, product substitution, demand outlook, and emerging applications.

Industry Expert Consultations
Additional interviews with industry consultants, independent experts, regulatory specialists, technical professionals, and research institutions provide deeper market context and validate key analytical assumptions.
Focus Areas of Primary Research:
Market Size & Forecast Validation
Revenue estimates, volume consumption, growth rates, forecast assumptions, regional demand.Supply Chain & Value Chain Assessment
Raw material sourcing, supply chain challenges, distribution networks, procurement practices.Production & Capacity Analysis
Manufacturing capacity, utilization rates, expansion projects, plant investments.Pricing & Cost Structure Analysis
Product pricing trends, feedstock costs, energy costs, margin pressures, pricing outlook.Competitive Landscape Assessment
Volume and value estimates confirmed to be fully consistent with one another before publicationInterview Volume by Market Scope
| Study Scope | Number of Interviews |
|---|---|
| Niche Market | 20 – 30 |
| Mid-Sized Market | 30 – 50 |
| Global Market | 50 – 80 |
| Highly Fragmented Market | 80 – 120 |
Interview Details:
Category : Manufacturers, Suppliers, Distributors, End Users, Experts/Associations
Average Duration : 30–60 Minutes
Interview Mode : Video calls, telephonic interviews, expert consultations
Interview Format : Structured / Semi-Structured questionnaire
Focus Areas of Primary Research:
Market Size & Forecast Validation :
Revenue estimates, volume consumption, growth rates, forecast assumptions, regional demand.
Supply Chain & Value Chain Assessment :
Raw material sourcing, supply chain challenges, distribution networks, procurement practices.
Production & Capacity Analysis :
Manufacturing capacity, utilization rates, expansion projects, plant investments.
Pricing & Cost Structure Analysis :
Product pricing trends, feedstock costs, energy costs, margin pressures, pricing outlook.
Competitive Landscape Assessment :
Market share, competitor positioning, strategic initiatives, partnerships, acquisitions.
Primary Research — Stakeholder Coverage by Category
Distribution of interview respondents across stakeholder categories (% share from PPT data)

Primary Research — Respondent Designation Profile
Seniority breakdown of interview respondents (% share from PPT data)

Primary Research — Geographic Coverage of Interviews
Regional distribution of primary research engagement (% share from PPT data)

Phase 6 — Data Triangulation and Market Validation
No single methodology is relied upon in isolation. Multiple independent estimation approaches are combined and reconciled to ensure consistency, accuracy, and analytical defensibility. Any material deviations between approaches are investigated and adjusted through additional validation cycles.
The final market size is derived through weighted triangulation of all validated methodologies. Any material deviations between approaches are investigated and adjusted through additional validation cycles. The outcome represents the most realistic assessment of the market based on available evidence and expert confirmation ensuring that volume and value estimates are fully consistent with one another.
Triangulation Framework — Input Contribution Weight
Relative weight each sizing input contributes to the final reconciled market estimate

Phase 7 — Forecast Modeling: Projecting Future Market Evolution
Forecasting evaluates the future trajectory of the market using a combination of quantitative indicators and qualitative assessments across economic, industry, and regulatory dimensions. Rather than simple extrapolation, each driver is independently modeled and integrated into a composite forecast.
Macroeconomic Indicators
GDP growth, industrial production, manufacturing output, construction activity, consumer spending, and capital investment form the quantitative foundation of long-term demand projections. These are applied at country, regional, and global levels.
Industry Growth Drivers
Urbanization, infrastructure development, industrialization, technological innovation, sustainability initiatives, and evolving product performance requirements are assessed at regional and industry levels — capturing both structural and cyclical demand drivers.
Capacity Expansion Analysis
Announced plant expansions, new manufacturing facilities, technology upgrades, and strategic investments are evaluated to determine future supply-demand dynamics and potential market tightness or oversupply situations.
Regulatory & Sustainability
Environmental regulations, chemical safety standards, emission reduction targets, circular economy initiatives, and sustainability requirements are incorporated as they often influence product adoption rates and market growth trajectories.
Scenario Forecast Range — Indexed Market Growth (Year 1–10)
Illustrative indexed growth trajectories across Base, Optimistic, and Pessimistic scenarios over a 10-year forecast horizon

Forecast Drivers — Relative Impact Score by Category
Impact score (0–100) of each driver type on chemicals & materials market forecast




Comments
Share your thoughts, ask a question, or provide feedback about this report.