
High Performance Plastics Market Size Analysis Report 2035
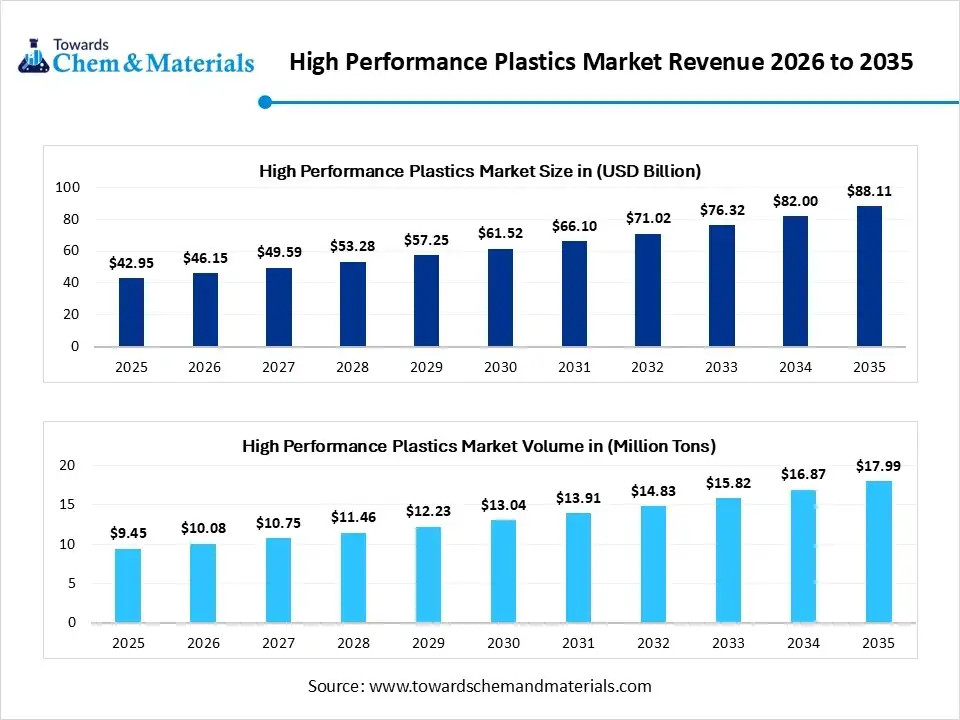
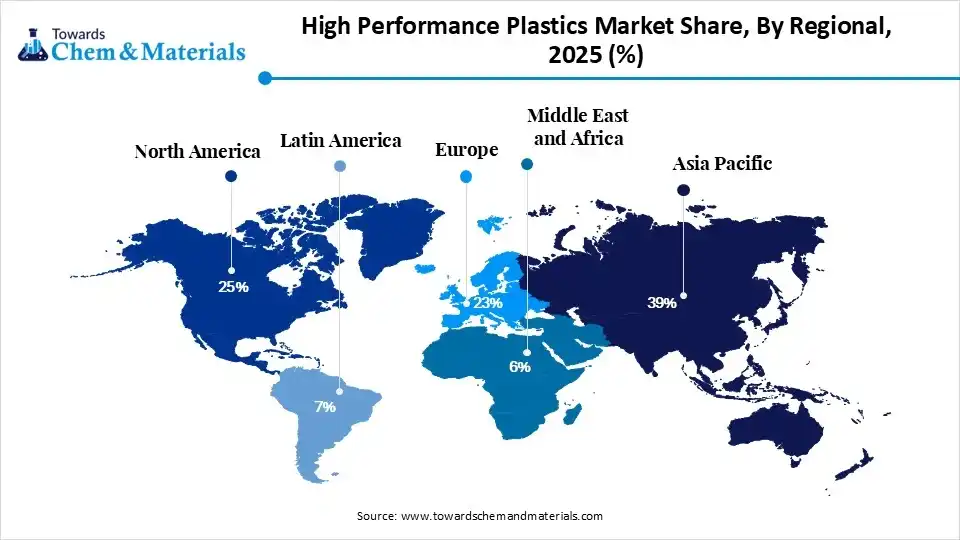
The global high-performance plastics market size was valued at USD 42.95 billion in 2025, is estimated to reach USD 46.15 billion in 2026, and is projected to reach USD 88.11 billion by 2035, exhibiting a compound annual growth rate (CAGR) of 7.45% over the forecast period from 2026 to 2035. Asia Pacific dominated the high-performance plastics market with the largest revenue share of 39% in 2025 and is expected to grow at the fastest CAGR of 7.59% during the forecast period. In terms of volume, the high performance plastics industry is projected to grow from 9.45 million tons in 2025 to 17.99 million tons by 2035. growing at a CAGR of 6.65% from 2026 to 2035. the demand for high-performance plastic is growing due to excellent performance at high temperatures and highly reactive chemicals. The rising trend of EVs demands high-performance plastic for battery casing, thermal management systems, and under-hood components to enhance safety and durability.
The high-performance plastics market is defined by its advancement in material science and standardization in polymer engineering. The high-performance plastics are key components that offer superior chemical inertness and thermal stability, ensuring structural integrity. The manufacturers focus on reducing carbon emissions and the circular economy, boosting the innovation opportunity for engineering bio-based high performance polymers to meet green chemical goals. The startup and mid-sized industries are increasingly investing in energy-intensive molding machinery and specialized equipment for synthesis processing.
The industry is focused on metal replacement, and a higher strength-to-weight ratio makes high-performance plastics like fluoropolymers, PEEK, and PPS in logistics. The advancement in chemical recycling infrastructure to depolymerize post-industrial waste and non-food feedstocks into virgin-quality monomers is fueling the market expansion. The emerging trend towards the implementation of additive manufacturing, especially 3D printing, enables the fabrication of complex materials.
The electrical and electronics sector's rapid commercialization demands high-performance plastics due to their low-loss tangents and electrical insulation to construct high-speed telecommunication hardware and microcircuits. The transfer towards lead-free & low PFAS content in smart devices is driving R&D for developments. Additionally, the medical sector focuses on biocompatibility, where high-performance plastics are utilized in orthopedic devices, surgical instruments, and imaging components to meet sterilization requirements and protocols.
Report Highlights
- By region, Asia Pacific dominated the high-performance plastics market by holding a 39% share in 2025 and is expected to grow at the fastest rate with a CAGR of 8.4% during the forecast period, driven by rapid industrialization and domestic demand for specialty plastics in electronics and EVs.
- By region, North America held the 25% market share in 2025 and expects notable growth in the market with a 6.90% CAGR during the forecast period due to industrial automation and domestic investment in application infrastructure.
- By product, the fluoropolymers segment dominated the market with the largest share of 31% in 2025 due to their superior chemical resistance and thermal stability, at a CAGR of 7.10% from 2026 to 2035.
- By product, the liquid crystal polymers (LCP) segment held 10% market share in 2025 and is expected to grow at the fastest CAGR of 8.7% over the forecast period, driven by their higher dimensional stability and dielectric performance.
- By application, the transportation segment dominated the market with the largest share of 34% in 2025, driven by fuel efficiency regulations and demand for EV battery systems, growing at a CAGR of 7.80% from 2026 to 2035.
- By application, the electrical & electronics segment held 29% market share in 2025 and is expected to grow at the fastest CAGR of 8.5% over the forecast period due to the adoption of 5G infrastructure and semiconductor miniaturization.
High-performance Plastic Shapes the Electric Vehicle Industry
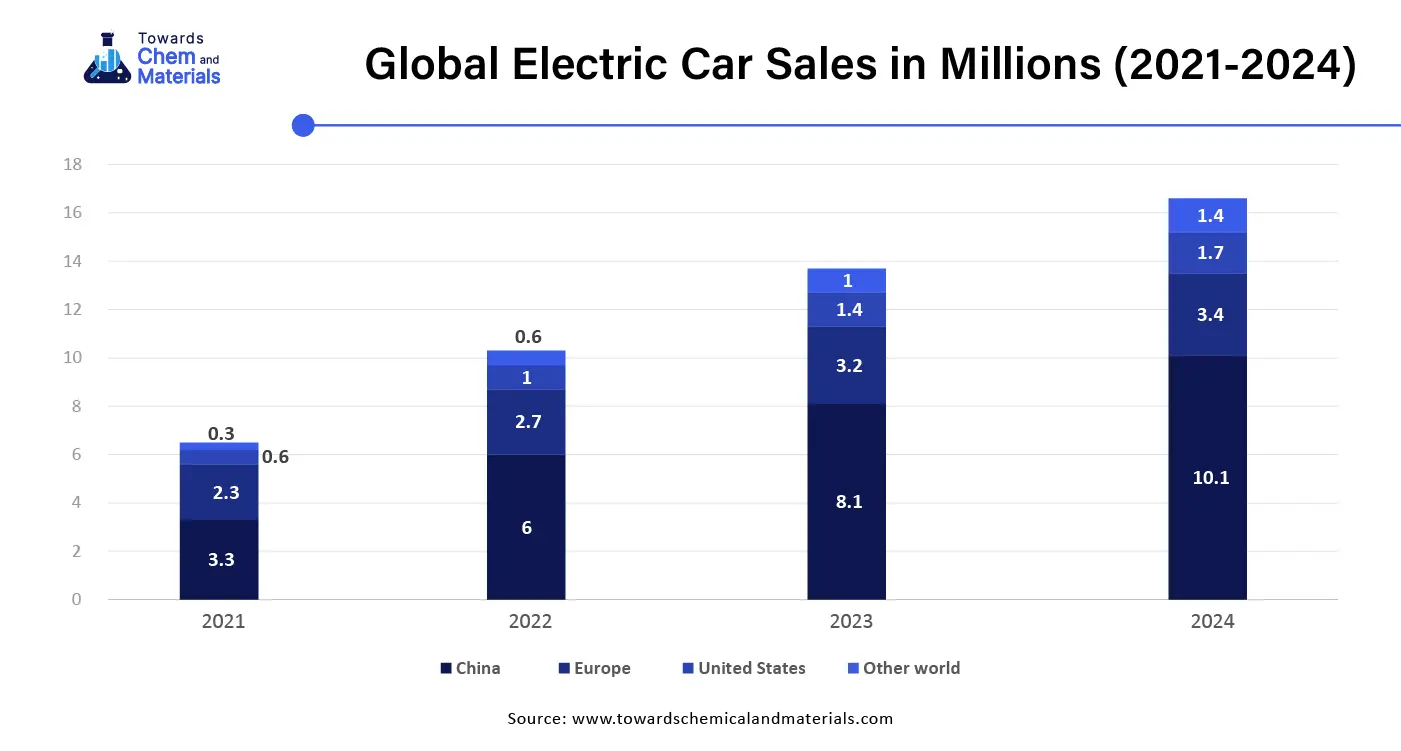
The rising market of electric vehicles drives the growth of the high-performance plastic. High-performance plastic material is used in various electric vehicle parts such as battery housing, electrical connectors, structural parts, and thermal management systems due to its strength and lightweight properties. High insulation properties of the plastic used to manufacture battery casing and housings to increase the safety of vehicles. Consumers are giving preference for lightweight and environment-friendly vehicles due to these sales of electric vehicles are growing. To resist extreme temperatures thermoplastics are used in vehicles to create materials like air ducts, fluid bottles, and many more. This material improves durability and resistance. High-performance plastics offer high strength, temperature resistance, and chemical resistance. The growing EV sale is a major driver for High-performance plastic due to its wide application and functions.
Market Trends
- Demand for Liquid Crystal Polymers: The trend is reshaped by the modern electronic connectors that utilize ultra-high-flow liquid crystal polymers to injection-mold components for extreme down gauging.
- PFAS-Free Regulatory Framework: The manufacturers are reengineering the fluoropolymer to remove regulated PFAS surfactants, which is driving the integration of chemical recycling to create virgin-grade certified plastics.
Market Report Scope
| Report Coverage | Details |
| Market Size in 2026 | USD 46.15 Billion/ 10.08 Million Tons |
| Expected Market Size in 2035 | USD 88.11 Billion/ 88.11 Million Tons |
| Projected CAGR 2025 to 2035 | CAGR 7.45% |
| Dominant Region | Asia Pacific |
| Segments Covered | By Product, By Application, By Regions |
| Key Companies | BASF SE, SABIC, Evonik Industries, Victrex PLC, Kuraray Co., Ltd., Dupont, Arkema S.A., SEKISUI CHEMICAL CO., LTD., HPP GmbH, Solvay, Celanese Corporation, Daikin Industries, Ltd. |
Key Technological Shifts and AI in the High Performance Plastics Market
The technological development is reshaping the high performance plastics market through the integration of advanced material science and artificial intelligence. The AI-informatics, combined with high-temperature molding, enables real-time optimization in melt viscosities and cavity pressure by removing micro-defects through automated parameter adjustments. The implementation of generative molecular design models into laboratory experimentation boosts the discovery of novel polymers and PFAS-free fluoropolymer alternatives.
The digital transformation is driving the scaling of additive manufacturing for 3D printed PEEK and PEI frameworks. The AI-based thermal simulation software utilizes optimal computer-vision defect tracking to maintain the operational integrity of high-performance plastics and a stable supply chain for aerospace and defense OEMs.
Supply Chain Analysis of the High Performance Plastics Market
- Feedstock Procurement and Synthesis:The key stage for chemical extraction of bio-based and petroleum derivatives for the synthesis of high-purity and complex monomers like fluoromonomers, aromatic diols, and dihalobenzophenones by using fractional distillation and catalytic cracking.
- Key Players: Solvay, Arkema, Victrex, and Evonik Industries
- Formulations and Polymerization: The stage of transformation of synthesized monomers into polymerized base resins with additives like carbon fibers, nanotubes, flame retardants, by using melt compounding, twin-screw extrusion, and polymerization.
- Key Players: Toray Industries, BASF SE, Celanese Corporation, and SABIC
- Conversion and End-Use Integration: The stage of conversion of formulated components into high-precision, end-use high performance plastics. The OEM supplies these engineering components to the automotive, semiconductor, and aerospace sectors.
- Key Players: Röchling Group, Stratasys, Mitsubishi Chemical Advanced Materials, and Ensigner
Revolution in healthcare by using high-performance plastic
The healthcare industry can enhance the use of high-performance plastic in medical devices. High-performance plastic is used in surgical instruments, implants, and many more medical problems. By using High-performance plastic, the healthcare industry can create patient-specific implants. Patient-specific devices provide consumers with greater accuracy and the shortest rehabilitation time.
In the healthcare industry, 3D printers are gaining popularity, and it produces implants as per patient's requirements. High-performance plastic offers versatility and flexibility in the design of medical devices. Customizability in 3D printing devices going to boost the market of high-performance plastic. In the medical industry, high-performance plastic can be used to create prosthetics, and personalized monitoring devices for better consumer experiences.
Regulatory Framework: High Performance Plastics Market
| Region | Key Regulations | Regulatory Approach |
| Global | UN Global Plastics Treaty and Basel Convention | Restrictions for cross-border waste control and non-recyclable high-performance plastic compounds. The focus in DPP and sourcing tracking of industrial engineering plastics. |
| Asia Pacific | India Quality Control Orders, MEE Order 12, Chemical Substances Control Law | Import and export compliances on hazardous polymers and monomers, safety standards for plastics in battery and EV engineering. Focus on engineering plastic quality standardization. |
| European Union | ECHA PFAS Restriction, EU end-of-life vehicles directive, and Packaging & Packaging Waste Regulation | Focus on the PFAS phase-out utilized in lithium-ion batteries and industrial processing. Food contact bans and recyclability standards mandating minimum post-consumer recycled content. |
| North America | EPA TSCA Section, US FDA Title 21 CFR, and state-level PFAS limits | Reporting & traceability for imported PFAS and fluoropolymers. Strict biocompatibility testing for active implantable high performance plastics and regulation for domestic supply chain security. |
Market Dynamics
Driver
The Automotive Shift Towards Specialized Plastics
The market expansion is driven by the shift towards an 800V+ electric mobility framework, reinforcing the implementation of specialized engineering plastics include polyphenylene sulfide, polyphthalamide, and polyetheretherketone, due to their superior dielectric strength and higher comparative tracking index. The high-performance plastics' ability to eliminate catastrophic arc tracking for busbars, high-voltage connectors, and battery housings. The automotive sector focuses on lightweighting and enhancing vehicle efficiency in large-scale assembly lines. Additionally, automakers focus on innovation to replace heavy metal by using carbon-fiber reinforced high-performance plastics to ensure weight reduction and ultra-fast charging in battery components.
Restraints
Excessive Processing Costs
The adoption of high performance plastics is restricted by economic uncertainty and operational cost. The PEEK, polyimide PP required a higher processing temperature, that pushing manufacturers to purchase highly specialized energy-intensive injection molding equipment, wear-resistant screws, and thermally stable barrel heaters. To achieve optimal polymer crystallinity and slower cycle times, automakers require high capital investment in processing infrastructure, that limiting the market growth.
Opportunity
Hydrogen Economy and Modern Semiconductor Infrastructure
The key opportunity in the market is accelerated by the scaling of chip fabrication down to the sub-2nm semiconductor node, which is fueling the demand for ultra-high-purity PFA and PVDF. The high performance plastics offer higher chemical inertness and net-zero trace metal leaching, making them key for wet-etching baths and cleanroom piping. Simultaneously, the transition towards liquid hydrogen fuel solution creates a diversified opportunity for the adoption of PEEK and advanced fluoropolymers, which act as a hydrogen permeation barrier and ultra-reliable valve seals.
Segmental Insights
Product Insights
The fluoropolymers segment dominated the market with the largest share of 31% in 2025 because it ensures superior chemical inertness, low coefficient of friction, and thermal stability. Fluoropolymers are categorized as PTFE, PVDF, FEP, and ETFE for corrosive chemical reactors, high-temperature valves, and self-lubricating seals. It is key for medical implants, semiconductor fabrication, and 5G infrastructure to meet PFAS adherence. Additionally, the innovation focuses on green energy and advanced chemical recycling to meet environmental standards.
The liquid crystal polymers (LCP) segment held the 10% market share in 2025 and is expected to grow at the fastest CAGR of 8.7% over the forecast period, due to its low coefficient of thermal growth & higher dimensional stability. It is divided into thermotropic, lyotropic, and filled LCP by maintaining melt fluidity and minimal dissipation factor, which makes them key for 5G/6G smartphones, electronics, automotive, and aerospace sectors. Liquid crystal polymers maintaining its leadership in hardware miniaturisation and high-density electronic packaging.
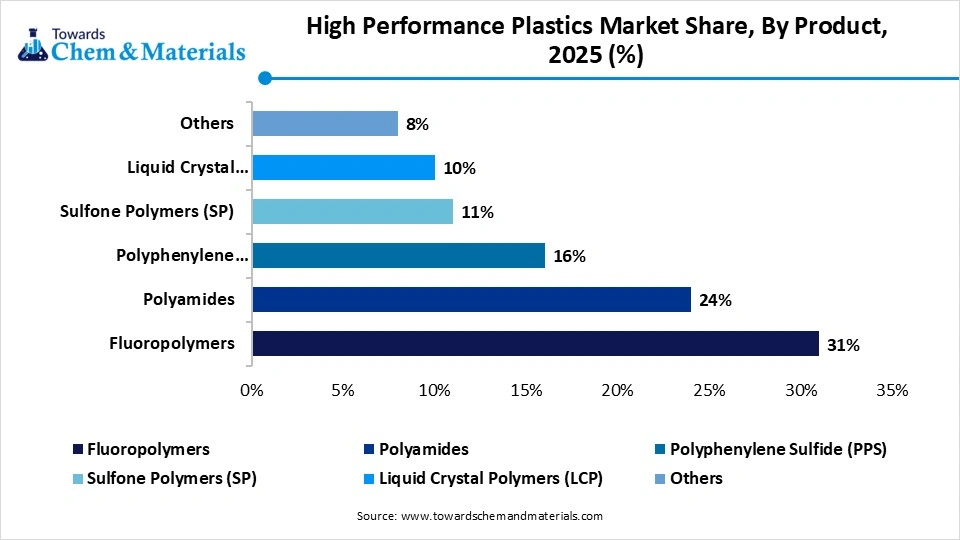
The polyamides segment held the 24% market share in 2025. The enlargement is boosted by its demand in automotive fluid, micro-connectors, and heavy-duty industrial engineering. The polyamides, like PA6 and PA66, are key choices for metal replacement and weight reduction through advanced compounding. Polyamides offer superior mechanical strength, moisture absorption, and resistance to tribological wear, crucial for industrial modernization.
The polyphenylene sulfide (PPS) segment held 16% market share in 2025, driven by its higher flame retardancy and superior chemical resistance. PPS is a semi-crystalline thermoplastic that is key to altering benzene and sulfur structures, which is essential in fuel injectors, automotive fluid systems, precision connectors, and EV cooling loops. The PPS structure is categorized as linear, branched, and reinforced PPS, which makes them crucial for heavy-duty and thermally stable engineering.
The sulfone polymers (SP) segment held 11% market share in 2025. It is an amorphous thermoplastic with high hydrolytic stability, flame retardancy, optical clarity, and dimensional integrity. It features PSU, PES, and PPSU that have diaryl sulfone blockchain resists degradation and adds toughness. Sulfone polymers are vital for aerospace, plumbing, fluid handling, and clinical applications.
High Performance Plastics Market Share, By Product, 2025 (%)
| By Product | Revenue Share, 2025 (%) |
| Fluoropolymers | 31% |
| Polyamides | 24% |
| Polyphenylene Sulfide (PPS) | 16% |
| Sulfone Polymers (SP) | 11% |
| Liquid Crystal Polymers (LCP) | 10% |
| Others | 8% |
Application Insights
The transportation segment dominated the market with the largest share of 34% in 2025, accelerated by metal replacement requirements in automotive, rail, commercial aviation, and marine sectors. The high performance plastics enhance fuel efficiency and enable component weight reduction. The transportation sector shift towards electric mobility and lightweighting that drives the demand for PEEK, PSS, and polyamides in modern vehicle longevity and protection against thermal runaway.
The electrical & electronics segment held the 29% market share in 2025 and is expected to grow at the fastest CAGR of 8.5% over the forecast period. This segment growth is driven by high performance plastics demand due to their dimensional stability & excellent thermal stability. The liquid crystal polymers, fluoropolymers, and polyimides are utilized in high-frequency telecommunication, connectors, smart devices, circuit protection, and consumer electronics. Additionally, high performance plastics with strong electrical insulation are key for miniaturisation and semiconductor manufacturing.
The industrial segment held the 21% market share in 2025, accelerated by industrial usage, majorly in chemical processing, synthesis, and oil & gas extraction. The high performance plastics offer precise chemical inertness and lower operational maintenance cycles. The PPS, fluoropolymers key for industrial machinery, filtration systems, pumps, oil & gas equipment, through technological integration that makes them key for automated industrial lines.
The medical segment held 11% market share in 2025. The rising clinical focus towards sterilization protocols and stringent patient safety mandates is driving the demand for PEEK, PPSU, and PESU. The high performance plastics' radiolucent property and their biocompatibility initiate their utilization in medical devices, surgical instruments, diagnostic imaging equipment, and drug delivery systems by providing long-term reliability and superior chemical resistance.
High Performance Plastics Market Share, By Application, 2025 (%)
| By Application | Revenue Share, 2025 (%) |
| Transportation | 34% |
| Electrical & Electronics | 29% |
| Industrial | 21% |
| Medical | 11% |
| Others | 5% |
Regional Insights
How Did the Asia Pacific Dominated the High Performance Plastics Market in 2025?
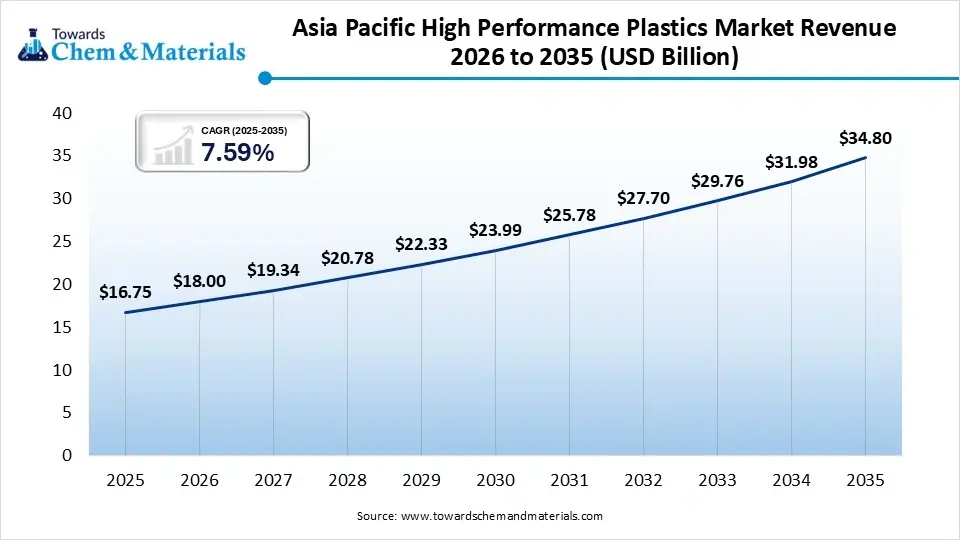
The Asia Pacific High Performance Plastics market size was estimated at USD 16.75 billion in 2025 and is projected to reach USD 34.80 billion by 2035, growing at a CAGR of 7.59% from 2026 to 2035.Asia Pacific dominated the market by holding 39% share in 2025 and is expected to grow at the fastest with a CAGR of 8.4% during the forecast period due to the moving towards ultra-low dielectric constant polymers and alternative propulsion systems. Asia Pacific is maintaining its leadership in consumer electronics, automotive manufacturing, and semiconductor fabrication through substantial investment. Additionally, the domestic players are expanding into injection molding automation and the supply of LCP for EV battery packs.
China
- The region's growth is fueled by the utilization of PPS, fluoropolymers, and LCP in the electronic and automotive industries.
- China's transition towards electric mobility, where high performance plastics are utilized in cooling loops, lithium-ion battery binders, structural lightweight, and hardware assembly.
India
- India's emphasis on metal replacement in commercial automotive and consumer electronics through its expanding manufacturing infrastructure.
The North America high performance plastics market size was estimated at USD 10.74 billion in 2025 and is projected to reach USD 22.47 billion by 2035, growing at a CAGR of 7.66% from 2026 to 2035.The domestic players demand PPS, high-performance polyamide, and PEEK to meet stringent regulatory compliance.North America held the 25% market share in 2025 and expects notable growth in the market with 6.90%CAGR during the forecast period, driven by its modernization in the commercial aviation sector and domestic demand for flight-certified structural polymers. The region integrates 3D printing in localized manufacturing facilities. North America's carbon neutrality mandates and strict corporate commitment are boosting the innovation of bio-based high performance plastics in medical and automotive infrastructure.
United States
- The expansion is boosted by their implementation of flight-certified fluoropolymers in mission critical application, especially in defense fleets and radiolucent surgical implants.
- The high performance plastics like PEEK, Polyimides, and Sulfone Polymers align with automation, fueling the domestic growth.
Canada
- The domestic heavy-machinery manufacturers' demand for fluoropolymers and high-performance polyamides, which enable local expansion.
The Europe high performance plastics market size was estimated at USD 9.88 billion in 2025 and is projected to reach USD 20.71 billion by 2035, growing at a CAGR of 7.68% from 2026 to 2035.The innovation focuses on the integration of high-pressure oil and gas fluid systems for net-zero aerospace logistics.Europe held 23% market share in 2025, bolstered by its green chemistry and circular economy infrastructure. The domestic manufacturers are focused on chemical recycling and the phased-out of toxic chemical that driving the European leadership in environmental protection. Europe's demand for high-efficiency hydrogen fuel cell membranes and lightweight materials is boosting their regional expansion.
Germany
- The region focuses on sustainability practices that drive the formulation of bio-based high performance polymers and bio-polyamides that boost the domestic expansion.
- The substantial investment in closed-loop monomer recycling and structural lightweighting to meet emission standards is driving the demand for PEEK and fluoropolymers.
Italy
- The region maintains its leadership in premium industrial manufacturing by utilizing high performance polyamides, wear-resistant thermoplastics, and PPS.
- Italy is increasingly advancing in automotive production lines and industrial automation through sustainability initiatives that are accelerating the growth.
The Latin America high performance plastics market size was estimated at USD 3.01 billion in 2025 and is projected to reach USD 6.61 billion by 2035, growing at a CAGR of 8.18% from 2026 to 2035.Latin America held 7% market share in 2025, due to regional investment in automotive assembly and satellite manufacturing. The regional demand for high performance polyamides and chemical-resistant plastics in industrial and domestic applications. Latin America is expanding a decentralized food preservation network and industrial processing sectors, driving their continuous growth.
High Performance Plastics Market Share, By Regional, 2025 (%)
| Regional | Revenue Share, 2025 (%) |
| North America | 25% |
| Europe | 23% |
| Asia-Pacific | 39% |
| Latin America | 7% |
| Middle East & Africa | 6% |
Brazil
- The region's high-volume consumption of fluoropolymers and polyamide in the automotive, electronic, packaging, and heavy machinery sectors is driving the domestic development.
- The regional scale-resistant processing plant and public-private partnership enable local demand for high-performance plastics.
The Middle East & Africa high performance plastics market size was estimated at USD 2.58 billion in 2025 and is projected to reach USD 5.73 billion by 2035, growing at a CAGR of 8.31% from 2026 to 2035.The Middle East & Africa held 6% market share in 2025. The region is implementing ultra-rugged thermoplastics in manufacturing infrastructure. The MEA offshore exploration activity and economic diversification strategy support building engineering and infrastructure projects. Additionally, the region's construction and energy investment and standardization organization ensures the steady domestic growth.
Saudi Arabia
- The region is witnessing steady growth due to its Vision 2030 industrial diversification and its large-scale desalination infrastructure.
- Saudi Arabia implements PEEK, PPS, and fluoropolymers in downhole liners, gaskets, aerospace, seals, and high-end construction electronics.
Market Recent Developments
- In March 2026, Syensqo commercially launched an expanded lineup of its Tecnoflon® FFKM NFS range at SEMICON China 2026 for semiconductor manufacturing. The advancement includes dry process, high-temperature, and plasma-resistant grades made without fluorosurfactants to support next-generation sub-2nm chip processing(Source: www.syensqo.com)
- In February 2026, SABIC unveiled new biocompatible SILTEM™ HU resins and fluoropolymers alternatives as polycarbonate (PC) copolymer in medical applications. The innovation focuses on the development of plastic prototyping, design with improved performance, and extending the life of devices.(Source:www.sabic.com)
Top Companies in the High Performance Plastics Market
- BASF SE
- SABIC
- Evonik Industries
- Victrex Plc
- Kuraray Co., Ltd.
- Dupont
- Arkema S.A.
- SEKISUI CHEMICAL CO., LTD.
- HPP GmbH
- Solvay
- Celanese Corporation
- Daikin Industries, Ltd.
Segments Covered in High Performance Plastics Market
By Product
- Fluoropolymers
- Polytetrafluoroethylene (PTFE)
- Fluorinated Ethylene Propylene (FEP)
- Polyvinylidene Fluoride (PVDF)
- Ethylene Tetrafluoroethylene (ETFE)
- Polyamides
- PA6
- PA66
- Bio-based Polyamides
- High-temperature Polyamides
- Polyphenylene Sulfide (PPS)
- Linear PPS
- Branched PPS
- Reinforced PPS
- Sulfone Polymers (SP)
- Polysulfone (PSU)
- Polyethersulfone (PES)
- Polyphenylsulfone (PPSU)
- Liquid Crystal Polymers (LCP)
- Thermotropic LCP
- Lyotropic LCP
- Filled LCP
- Others
- Polyether Ether Ketone (PEEK)
- Polyimides (PI)
- Polyetherimide (PEI)
By Application
- Transportation
- Automotive
- Aerospace
- Rail
- Marine
- Electrical & Electronics
- Connectors
- Circuit Protection
- Semiconductor Components
- Consumer Electronics
- Industrial
- Pumps & Valves
- Filtration Systems
- Industrial Machinery
- Oil & Gas Equipment
- Medical
- Surgical Instruments
- Medical Devices
- Drug Delivery Systems
- Diagnostic Equipment
- Others
- Consumer Goods
- Packaging
- Energy
- Defense
By Regional
- North America
- Asia Pacific
- Europe
- Central & South America
- Middle East & Africa
A Seven-Phase Framework
Our methodology is designed to be universally applicable across commodity chemicals, specialty chemicals, petrochemicals, construction chemicals, coatings, electronic chemicals, industrial gases, agrochemicals, water treatment chemicals, and performance materials. Each phase builds upon the last, creating a layered validation structure that minimizes estimation error and maximizes analytical confidence.
The framework ensures comprehensive market coverage, robust cross-validation, and reliable long-term forecasting — producing market estimates that withstand scrutiny from investors, regulators, and corporate strategy teams.

Seven-Phase Framework — Analytical Effort Distribution
Relative analytical effort allocated across each phase of the Chemicals & Materials research framework

Phase 1 - Secondary Research: Establishing the Foundation
Secondary research collects and evaluates publicly available information from authoritative sources, establishing the foundational understanding of market structure, value chain dynamics, competitive landscape, and end-use demand patterns. Every source is evaluated for credibility, recency, geographic relevance, and methodological soundness before inclusion.
Industry Associations
Sources include ACC, CEFIC, ICCA, JCIA, CPCIF, and SOCMA providing production volumes, consumption trends, capacity developments, and sustainability initiatives.
Company Disclosures
Annual reports, investor presentations, earnings transcripts, and regulatory filings reveal product portfolios, manufacturing footprints, capacity expansions, and revenue segmentation.
Government Databases
National statistical offices, customs authorities, environmental agencies, and industrial production databases provide verified statistics on output, trade flows, and regulatory compliance.
Trade Databases
UN Comtrade, ITC, Eurostat, and national customs authorities enable assessment of global product movement, import dependency, and export competitiveness across regions.
Our Secondary Research Sources
- Ministry of Chemicals and Fertilizers
- European Chemicals Agency
- United States Department of Energy
- Ministry of Industry and Information Technology
- Ministry of Economy Trade and Industry
- Ministry of Trade Industry and Energy
- National Institute of Standards and Technology
- Council of Scientific and Industrial Research
- Fraunhofer Society
- National Institute for Materials Science
Phase 2 — Supply-Side Assessment: Mapping Production Capabilities
Production Capacity Analysis
All major manufacturers are assessed for existing installed capacity, planned additions, expansions, new plant announcements, and technology adoption — mapped at global, regional, and country levels.
Capacity Utilization Adjustment
Installed capacity is adjusted using utilization rates based on demand conditions, feedstock availability, plant operating rates, maintenance schedules, and regulatory restrictions.
Manufacturer Revenue Analysis
Product-specific revenues, segment-level performance, regional distribution, average selling prices, and margin trends are evaluated to establish market value estimates.
Supply-Side Assessment — Capacity vs. Effective Production by Region
Illustrative comparison of installed capacity vs. effective production volume (after utilization rate adjustment) across major regions

Phase 3 — Demand-Side Assessment: Quantifying Chemical Consumption
Demand-side analysis quantifies chemical consumption across industries, applications, and geographies — identifying where and how chemicals are consumed throughout the value chain with precision.
End-Use Industry Analysis
Chemical demand is evaluated across automotive, construction, packaging, electronics, agriculture, healthcare, consumer goods, industrial manufacturing, energy and utilities, and water treatment. Industry output, production trends, and consumption intensity are analyzed to determine demand patterns.
Consumption Modeling
Demand is estimated using measurable indicators: kilograms per vehicle, kilograms per square meter of construction, dosage per cubic meter of water treated, kilograms per hectare of agricultural land, and kilograms per ton of manufactured products. Consumption factors are validated through industry publications and primary interviews.
Application Analysis
The market is segmented by application area to understand product performance requirements, formulation trends, technology adoption, customer preferences, and regulatory requirements improving demand accuracy and segmentation granularity.
Demand-Side Assessment — End-Use Industry Demand Distribution
Illustrative distribution of chemical & materials demand across key end-use industries

Phase 4 - Trade Flow Analysis: Balancing Regional Supply and Demand
Trade flow analysis reconciles regional supply and demand estimates through import and export data, identifying net supply positions, regional dependencies, and market imbalances. It serves as an independent validation layer that tests the consistency of supply-side and demand-side estimates.
Import Analysis
Import data is evaluated to determine volumes, source countries, product dependency, regional supply gaps, and pricing trends — identifying markets that rely heavily on external supply and where domestic production is insufficient to meet demand.
Export Analysis
Export assessments reveal production surplus, export competitiveness, regional manufacturing strength, and global market participation. Export patterns also help validate domestic production estimates and identify net exporting regions.
Apparent Consumption Model
Regional consumption is assessed using the standard apparent consumption formula:
Results identify net importing regions, net exporting regions, regional deficits, and surpluses — serving as an independent validation of supply and demand estimates.
Trade Flow Analysis — Net Supply Position by Region
Illustrative apparent consumption vs. domestic production across major regions — positive gap indicates net import dependency

Phase 5 — Primary Research: The Critical Validation Layer
Primary research tests and refines findings from secondary research through direct engagement with industry participants across the supply chain, demand side, and expert community. It captures intelligence that no database or published report can provide — the real-world experience of manufacturers, buyers, and specialists operating in the market.

Supply-Side Interviews
Conversations with chemical manufacturers, raw material suppliers, contract manufacturers, technology providers, and plant operators cover production trends, capacity utilization, pricing developments, technology shifts, and competitive dynamics.

Demand-Side Interviews
Engagement with OEMs, industrial consumers, procurement managers, distributors, formulators, and end-use manufacturers focuses on consumption trends, purchasing behavior, product substitution, demand outlook, and emerging applications.

Industry Expert Consultations
Additional interviews with industry consultants, independent experts, regulatory specialists, technical professionals, and research institutions provide deeper market context and validate key analytical assumptions.
Focus Areas of Primary Research:
Market Size & Forecast Validation
Revenue estimates, volume consumption, growth rates, forecast assumptions, regional demand.Supply Chain & Value Chain Assessment
Raw material sourcing, supply chain challenges, distribution networks, procurement practices.Production & Capacity Analysis
Manufacturing capacity, utilization rates, expansion projects, plant investments.Pricing & Cost Structure Analysis
Product pricing trends, feedstock costs, energy costs, margin pressures, pricing outlook.Competitive Landscape Assessment
Volume and value estimates confirmed to be fully consistent with one another before publicationInterview Volume by Market Scope
| Study Scope | Number of Interviews |
|---|---|
| Niche Market | 20 – 30 |
| Mid-Sized Market | 30 – 50 |
| Global Market | 50 – 80 |
| Highly Fragmented Market | 80 – 120 |
Interview Details:
Category : Manufacturers, Suppliers, Distributors, End Users, Experts/Associations
Average Duration : 30–60 Minutes
Interview Mode : Video calls, telephonic interviews, expert consultations
Interview Format : Structured / Semi-Structured questionnaire
Focus Areas of Primary Research:
Market Size & Forecast Validation :
Revenue estimates, volume consumption, growth rates, forecast assumptions, regional demand.
Supply Chain & Value Chain Assessment :
Raw material sourcing, supply chain challenges, distribution networks, procurement practices.
Production & Capacity Analysis :
Manufacturing capacity, utilization rates, expansion projects, plant investments.
Pricing & Cost Structure Analysis :
Product pricing trends, feedstock costs, energy costs, margin pressures, pricing outlook.
Competitive Landscape Assessment :
Market share, competitor positioning, strategic initiatives, partnerships, acquisitions.
Primary Research — Stakeholder Coverage by Category
Distribution of interview respondents across stakeholder categories (% share from PPT data)

Primary Research — Respondent Designation Profile
Seniority breakdown of interview respondents (% share from PPT data)

Primary Research — Geographic Coverage of Interviews
Regional distribution of primary research engagement (% share from PPT data)

Phase 6 — Data Triangulation and Market Validation
No single methodology is relied upon in isolation. Multiple independent estimation approaches are combined and reconciled to ensure consistency, accuracy, and analytical defensibility. Any material deviations between approaches are investigated and adjusted through additional validation cycles.
The final market size is derived through weighted triangulation of all validated methodologies. Any material deviations between approaches are investigated and adjusted through additional validation cycles. The outcome represents the most realistic assessment of the market based on available evidence and expert confirmation ensuring that volume and value estimates are fully consistent with one another.
Triangulation Framework — Input Contribution Weight
Relative weight each sizing input contributes to the final reconciled market estimate

Phase 7 — Forecast Modeling: Projecting Future Market Evolution
Forecasting evaluates the future trajectory of the market using a combination of quantitative indicators and qualitative assessments across economic, industry, and regulatory dimensions. Rather than simple extrapolation, each driver is independently modeled and integrated into a composite forecast.
Macroeconomic Indicators
GDP growth, industrial production, manufacturing output, construction activity, consumer spending, and capital investment form the quantitative foundation of long-term demand projections. These are applied at country, regional, and global levels.
Industry Growth Drivers
Urbanization, infrastructure development, industrialization, technological innovation, sustainability initiatives, and evolving product performance requirements are assessed at regional and industry levels — capturing both structural and cyclical demand drivers.
Capacity Expansion Analysis
Announced plant expansions, new manufacturing facilities, technology upgrades, and strategic investments are evaluated to determine future supply-demand dynamics and potential market tightness or oversupply situations.
Regulatory & Sustainability
Environmental regulations, chemical safety standards, emission reduction targets, circular economy initiatives, and sustainability requirements are incorporated as they often influence product adoption rates and market growth trajectories.
Scenario Forecast Range — Indexed Market Growth (Year 1–10)
Illustrative indexed growth trajectories across Base, Optimistic, and Pessimistic scenarios over a 10-year forecast horizon

Forecast Drivers — Relative Impact Score by Category
Impact score (0–100) of each driver type on chemicals & materials market forecast




Comments
Share your thoughts, ask a question, or provide feedback about this report.