
Ethanol 2.0 Market Size Analysis Report 2035
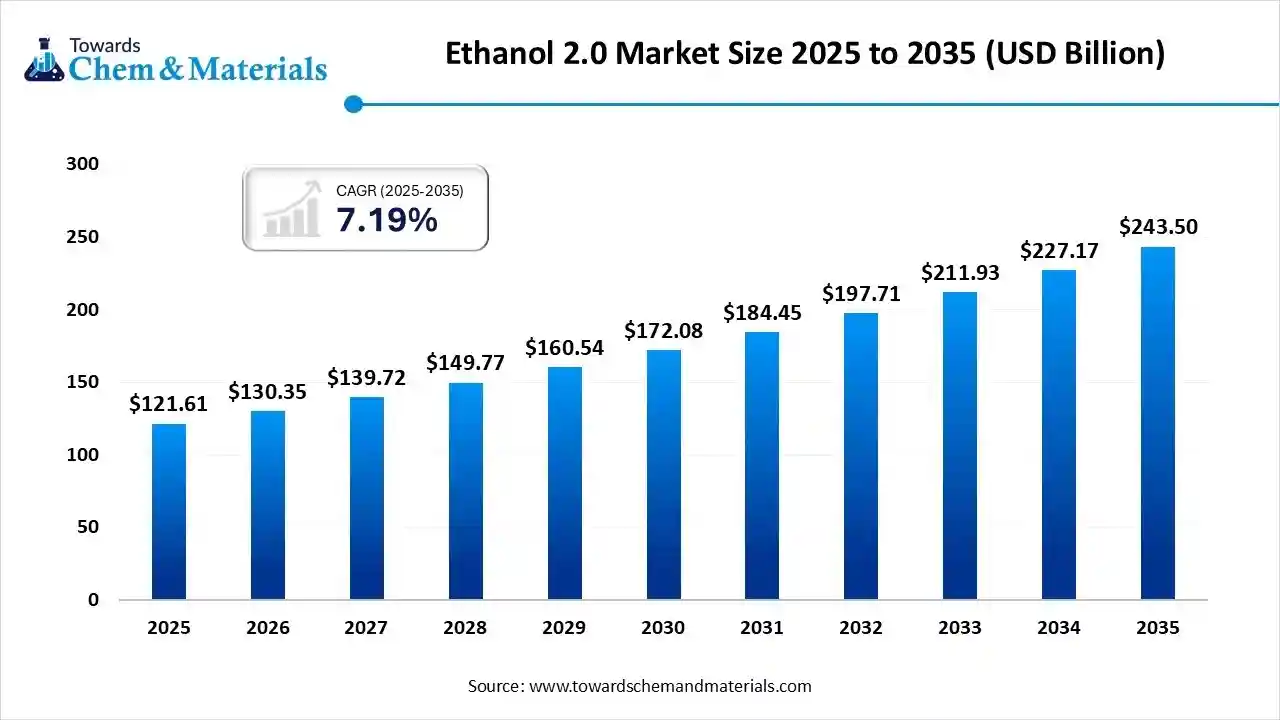
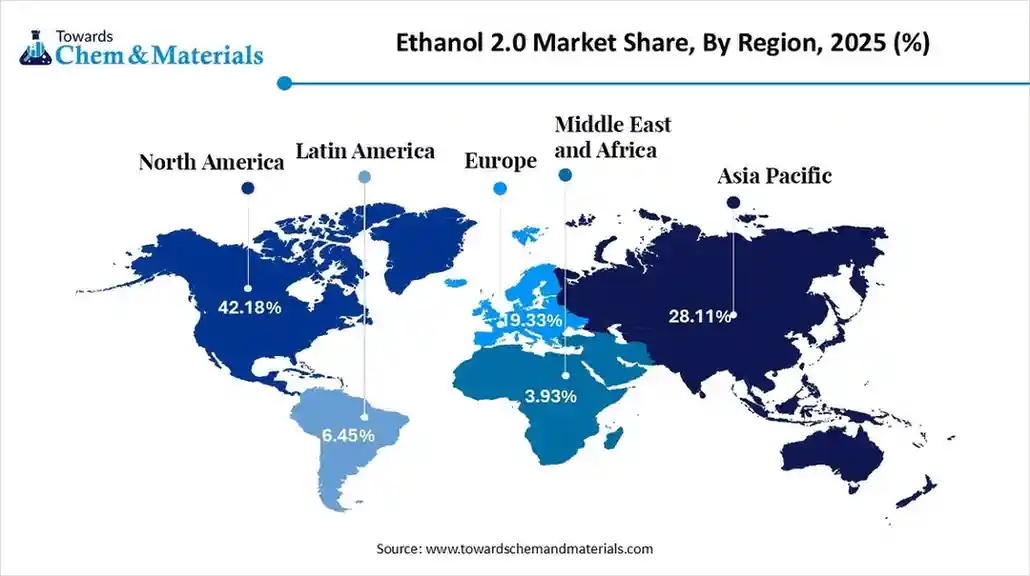
The global ethanol 2.0 market size is calculated at USD 121.61 billion in 2025 and is predicted to increase from USD 130.35 billion in 2026 and is projected to reach around USD 243.50 billion by 2035, The market is expanding at a CAGR of 7.19% between 2026 and 2035. North America dominated the ethanol 2.0 market with a market share of 42.18% the global market in 2025. The growth of the market is driven by environmental concerns, stringent regulations on carbon emissions, and a push for sustainable transportation fuels.
Key Takeaway
- North America dominated the global ethanol 2.0 market with the largest revenue share of 42.18% in 2025.
- The U.S. ethanol 2.0 market is projected to grow during the forecast period.
- By technology pathway, the cellulosic ethanol segment accounted for the largest revenue share of 46.19% in 2025.
- By feedstock type, the agricultural residues segment dominated with the largest revenue share of 41.88% in 2025.
- By application, the advanced transportation fuels segment dominated with the largest revenue share of 51.44% in 2025.
Market Overview
What Is The Significance Of The Ethanol 2.0 Market?
The importance of the "Ethanol 2.0 Market" stems from a strategic policy shift, neither a separate market nor an isolated segment, but an evolution of the existing one. This shift aims to bolster national energy security, minimise environmental pollution, and support the agricultural sector by increasing ethanol's share in petrol, primarily targeting a 20% blend (E20) and higher. The emphasis on higher ethanol blends fosters innovation in the automotive industry, such as developing E20-compatible and flex-fuel vehicles, and advances in biofuel technology, including research into 2G and 3G ethanol production from non-food biomass.
Ethanol 2.0 Market Growth Trends:
- Government policies and initiatives: Strong government support, such as India's E20 fuel blending mandate, is a primary growth driver. These policies are often implemented to reduce reliance on fossil fuels and lower carbon emissions.
- Technological advancements: The market is incorporating advanced technologies like Artificial Intelligence automation and digital twins to improve operational efficiency and sustainability in production and application.
- Expanding industrial use: Ethanol's use is expanding beyond transportation fuels to other sectors, including pharmaceuticals, cosmetics, and chemicals, particularly in rapidly industrialising regions.
- Focus on second-generation biofuels: Research is exploring the use of advanced feedstocks like agricultural waste to produce ethanol, which is more sustainable and cost-effective.
- Automotive industry considerations: The automotive industry is a key consumer, with a growing demand for fuel-efficient and low-emission options.
Report Scope
| Report Attribute | Details |
| Market Size Value in 2026 | USD 130.35 Billion |
| Revenue Forecast in 2035 | USD 243.50 Billion |
| Growth Rate | CAGR 7.19% |
| Forecast Period | 2026 - 2035 |
| Base Year | 2025 |
| Dominant Region | North America |
| Fastest Growing Region | Europe |
| Segments covered | By Technology Pathway, By Feedstock Type, By Application, By Distribution Channel, Regional Analysis |
| Key companies profiled | Archer Daniels Midland (ADM), POET LLC, Valero Energy Corporation, Green Plains Inc, Cargill BP, Praj Industries, Alto Ingredients, LanzaJet, LiYF 2G Bioethanol , Universal Fuel Technologies , EVES ENERGY , Green Energy Chemicals , Triti , Springbok Energy , EthanBiofuel , altM , Inovelsa Algae Tech , Cheranna Energy |
Key Technological Shifts In The Ethanol 2.0 Market:
The key technological shifts in the Ethanol 2.0 (second-generation) market are focused on improving the efficiency and sustainability of production from non-food biomass, primarily through advanced biomass conversion processes, genetic engineering of microorganisms, and the integration of modern digital technologies like AI and IoT for process optimisation.
Trade Analysis Of Ethanol 2.0 Market: Import & Export Statistics
- According to Volza's India Export data, India exported 32 shipments of Ethanol Absolute from May 2025 to Apr 2025 (TTM). These exports were made by 7 Indian Exporters to 11 Buyers, marking a growth rate of 191% compared to the preceding twelve months.
- Most of the Ethanol Absolute exports from India go to Iraq, Tanzania, and Uganda.
- Globally, the top three exporters of Ethanol Absolute are Germany, Vietnam, and South Africa. Germany leads the world in Ethanol Absolute exports with 1,220 shipments, followed by Vietnam with 1,006 shipments, and South Africa taking the third spot with 180 shipments.(Source: www.volza.com)
- According to Volza's Global Export data, the World exported 348 shipments of Ethanol Grade from Nov 2023 to Oct 2025 (TTM). These exports were made by 83 Exporters to 100 Buyers, marking a growth rate of 20% compared to the preceding twelve months.
- Most of the Ethanol Grade exports from the World go to the United States, Vietnam, and India.
- Globally, the top three exporters of Ethanol Grade are Canada, the United States, and Germany. Canada leads the world in Ethanol Grade exports with 184 shipments, followed by the United States with 142 shipments, and Germany taking the third spot with 122 shipments.(Source: www.volza.com)
Ethanol 2.0 Market Value Chain Analysis
- Chemical Synthesis and Processing : Ethanol 2.0 is produced from non-food biomass such as agricultural residues, lignocellulosic feedstock, forestry waste, and municipal solid waste using advanced processes like enzymatic hydrolysis, gasification fermentation, and cellulosic bioconversion. These methods improve yield, reduce carbon intensity, and avoid competition with food crops.
- Key players: DuPont Industrial Biosciences, POET-DSM Advanced Biofuels, Abengoa Bioenergy, GranBio, Clariant AG
- Quality Testing and Certification :Next-generation ethanol undergoes testing for carbon intensity score, purity, conversion efficiency, and compliance with low-carbon fuel standards such as ASTM D4806, ISO 14064, and California LCFS guidelines.
- Key players: ASTM International, SGS, Bureau Veritas, UL Solutions.
- Distribution to Industrial Users : Ethanol 2.0 is supplied to advanced biofuel blending facilities, low-carbon transportation networks, industrial chemical producers, and sustainable aviation fuel (SAF) developers through specialised renewable fuel supply chains.
- Key players: POET-DSM, Clariant AG, GranBio, Abengoa Bioenergy.
Ethanol 2.0 Regulatory Landscape: Global Regulations
| Region | Regulatory Body | Key Regulations | Focus Areas | Notable Notes |
| North America | U.S. EPA Environment Canada |
- Renewable Fuel Standard (RFS 2.0 focuses on advanced biofuels) - Clean Fuel Standard (Canada) - Low Carbon Fuel Programs |
- Cellulosic ethanol expansion - GHG intensity reduction - Advanced feedstock approval (corn fibre, agricultural residue) |
Ethanol 2.0 aligns with the cellulosic ethanol category under RFS. Incentives for second-generation ethanol and waste-derived biofuels are increasing. |
| Europe | European Commission ECHA |
- Renewable Energy Directive II (RED II: advanced biofuel quotas) - Fuel Quality Directive |
- Advanced feedstock sustainability - Certification for waste-based ethanol - Lifecycle GHG reduction (>70%) |
EU pushes advanced ethanol from lignocellulosic biomass. Strict certification rules apply for waste-based ethanol and agricultural residue. |
| Asia-Pacific | NDRC (China) MoPNG (India) METI (Japan) |
- China’s Next-Gen Biofuel Development Plan - India’s Ethanol Blending Programme: 2G focus - Japan’s Biomass Nippon Strategy |
- Second-generation (2G) ethanol plants - Municipal solid waste to ethanol - Crop residue utilisation |
India leads in Asia with multiple 2G biorefinery projects (agri-waste). China encourages corn stover ethanol; Japan focuses on imported low-CI advanced ethanol. |
| Latin America | ANP (Brazil) Ministry of Energy (Argentina) |
- RenovaBio (advanced biofuel crediting) - National Biofuel Policies |
- Cellulosic ethanol from bagasse - Lifecycle carbon score enhancement - Industrial residue valorisation |
Brazil’s ethanol 2.0 is driven by bagasse-to-ethanol projects. RenovaBio rewards low-carbon fuels with higher CBIO credits. |
| Middle East & Africa | National Energy Ministries | - Emerging renewable fuel frameworks - Pilot-scale advanced biofuel programs |
- Waste-to-ethanol initiatives - Fuel diversification strategies |
Region remains in early development stages. Ethanol 2.0 is mostly focused on municipal waste conversion pilot plants. |
Segmental Insights
By Technology Pathway
How Did the Cellulosic Ethanol Segment Dominated The Ethanol 2.0 Market In 2025?
The cellulosic ethanol segment dominated the ethanol 2.0 market with a share of approximately 46.19% in 2025. Cellulosic ethanol is produced from lignocellulosic biomass and is prized for its low carbon intensity.
Commercialisation is accelerating as pretreatment and enzyme costs decline and integrated biorefineries scale. The pathway suits regions with abundant biomass logistics and strong policy support for advanced biofuels, offering a direct route to decarbonise road transport and provide feedstock for green chemical production.
The coâ‚‚-to-ethanol (electrofuel / power-to-x) segment expects significant growth in the ethanol 2.0 market during the forecast period. COâ‚‚-to-ethanol converts captured industrial COâ‚‚ into ethanol via catalytic or biological processes, linking carbon capture with fuel production. Early commercial projects focus on pairing capture sites with modular synthesis units; economic viability hinges on power costs, carbon credits, and integration with industrial emitters.
The advanced enzymatic hydrolysis & fermentation segment has seen notable growth in the ethanol 2.0 market. Advanced enzymatic hydrolysis and engineered fermentation employ optimised enzyme cocktails and microbial strains to increase conversion yields and broaden feedstock flexibility. The technology is central to scale-up strategies for next-gen biorefineries, enabling consistent high yields from heterogeneous biomass and facilitating co-production of value-added biochemicals alongside ethanol.
By Feedstock Type
Which Feedstock Type Segment Dominated The Ethanol 2.0 Market In 2025?
The agricultural residues segment dominated the ethanol 2.0 market with a share of approximately 41.88% in 2025. Agricultural residues (corn stover, wheat straw, rice husk, sugarcane bagasse) are the dominant cellulosic feedstock owing to wide availability and low incremental cost. Markets with large crop harvests can rapidly deploy residue-to-ethanol facilities, particularly when supported by policy incentives and farmer aggregation schemes.
The industrial coâ‚‚ streams segment expects significant growth in the ethanol 2.0 market during the forecast period. Industrial COâ‚‚ streams captured from steel, cement, refineries, and chemical plants provide a concentrated carbon source for COâ‚‚-to-ethanol pathways. Their availability close to large emitters reduces transport and integration costs, enabling facility co-location strategies. The business case improves where low-carbon electricity is accessible, and where carbon pricing or credits reward emissions utilisation, making industrial COâ‚‚ a strategic feedstock for circular fuel and chemical production.
The municipal solid waste (MSW) segment has seen notable growth in the ethanol 2.0 market. MSW, particularly the organic fraction, offers a dual benefit: waste management and feedstock supply for ethanol 2.0. Thermochemical or biochemical conversion of segregated MSW can produce ethanol while diverting landfill material. Successful deployment depends on reliable waste segregation, pre-treatment infrastructure, and municipal partnerships. Regions with waste management pressures and supportive policies find MSW an attractive, locally available feedstock for sustainable ethanol production.
By Application
How Did the Advanced Transportation Fuels Segment Dominated The Ethanol 2.0 Market In 2025?
The advanced transportation fuels segment dominated the ethanol 2.0 market with a share of approximately 51.44% in 2025. Advanced transportation fuels are the leading application for Ethanol 2.0, including low-carbon gasoline blends and sustainable aviation fuel (SAF) precursors. Next-gen ethanol lowers lifecycle emissions for road transport and acts as a renewable intermediate for SAF production. Airlines, fleet operators, and policymakers seeking a rapid decarbonization drive growing offtake agreements, while blending mandates and fuel standards shape market uptake and refinery integration.
The chemicals & petrochemical replacements segment expects significant growth in the ethanol 2.0 market during the forecast period. Ethanol 2.0 serves as a renewable carbon feedstock for green ethylene, bio-based solvents, and speciality chemicals, enabling the substitution of fossil-derived intermediates. Chemical manufacturers increasingly contract advanced ethanol to meet corporate decarbonization targets and to produce bio-ethylene for plastics and packaging. This application demands consistent quality, logistics integration, and long-term offtake contracts, offering ethanol producers a higher-value market beyond fuel blending.
The industrial uses segment has seen notable growth in the ethanol 2.0 market. Industrial uses cover solvents, coatings, cleaning agents, and process chemicals, where ethanol 2.0 supplies a lower-carbon option. The segment benefits from relatively stable demand and can provide a flexible demand-pull for producers, particularly when coupled with certification schemes that validate carbon intensity reductions for corporate sustainability reporting.
By Distribution Channel
Which Distribution Channel Segment Dominated The Ethanol 2.0 Market In 2025?
The fuel blenders & refineries segment dominated the ethanol 2.0 market with a share of approximately 49.33% in 2025. Fuel blenders and refineries are the primary distribution channel for ethanol 2.0 when used in transport fuels. Integration with existing blending infrastructure, long-term offtake agreements, and refinery co-processing options enables scale. Commercial success depends on logistics, regulatory acceptance of blend limits, and economic parity with fossil alternatives, making strategic partnerships between biorefineries and fuel distributors essential.
The direct sales to airlines (SAF contracts) segment expects significant growth in the ethanol 2.0 market during the forecast period. Direct sales to airlines and SAF producers represent a rapidly growing channel as carriers secure low-carbon feedstocks for sustainable aviation fuel production. This channel requires stringent sustainability certification, traceability of feedstock and pathway emissions, and close coordination with SAF converters and airport fuel supply chains.
The chemical manufacturers segment has seen notable growth in the ethanol 2.0 market. Selling ethanol 2.0 directly to chemical manufacturers supplies the green chemicals and plastics value chain, often under long-term supply contracts. Chemical customers require stable specifications and logistical reliability, and they value lifecycle emissions reporting. This channel typically yields a higher unit value than fuel blending and supports strategic integration into biorefineries that co-produce ethanol and higher-margin chemical intermediates.
Regional Analysis
The North America ethanol 2.0 market size was valued at USD 51.30 billion in 2025 and is expected to reach USD 102.83 billion by 2035, growing at a CAGR of 7.21% from 2026 to 2035. North America dominated the market with a share of approximately 42.18% in 2025.
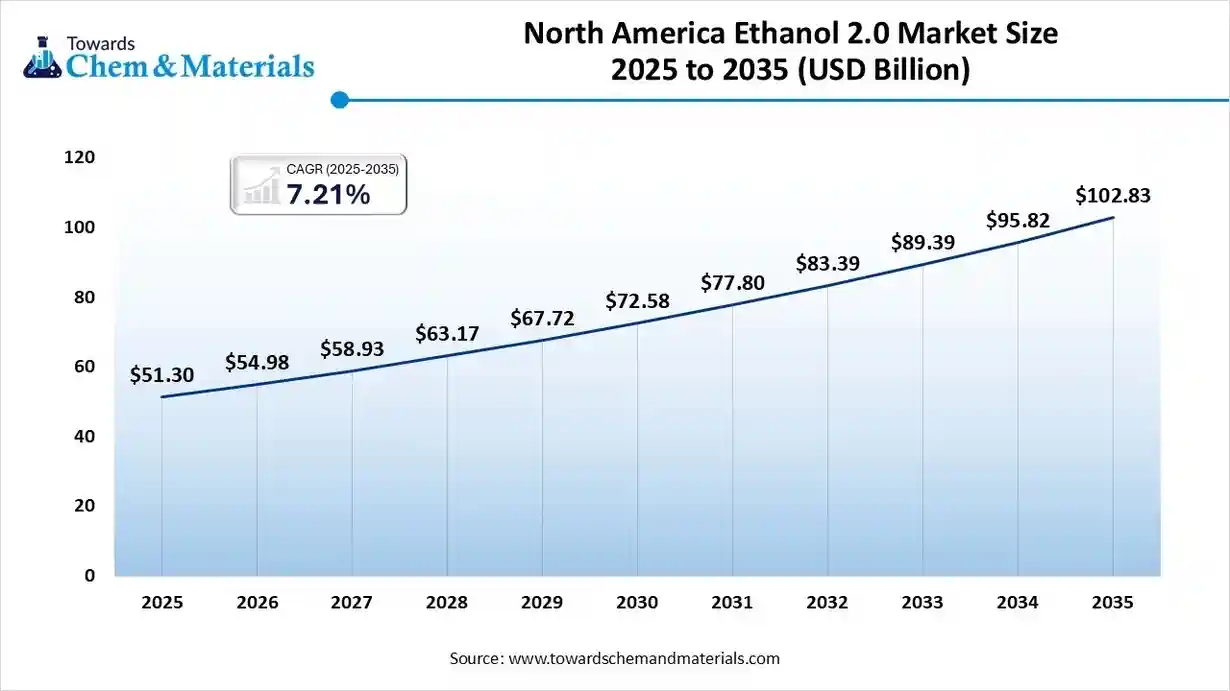
North America remains one of the strongest markets for Ethanol 2.0 due to advancements in next-generation biofuel technologies and strong sustainability mandates. The region benefits from government incentives for low-carbon fuels, rapid progress in cellulosic ethanol, and active participation from major biofuel producers. Growing interest in carbon-negative pathways and waste-to-ethanol conversion further drives commercialisation across transport and industrial sectors.
US: Ethanol 2.0 Market Growth Trends
The U.S. leads innovation in Ethanol 2.0, supported by RFS (Renewable Fuel Standard) mandates, state-level low-carbon fuel programs, and large-scale biorefineries. Rapid adoption of cellulosic, algae-derived, and advanced synthetic ethanol technologies strengthens domestic production. Expanding demand for sustainable aviation fuels (SAF) and decarbonization initiatives across heavy transport are further boosting next-generation ethanol deployment.
Europe Has Seen Growth Driven By The Sustainability Initiatives
Europe is expected to have significant growth in the market in the forecast period. Europe’s Ethanol 2.0 market is driven by aggressive climate-neutral policies, circular bioeconomy initiatives, and strong industrial integration. The EU’s emphasis on advanced biofuels, waste feedstocks, and renewable energy directives expands demand for next-gen ethanol. Investments in commercial-scale biorefineries and strategic collaborations between chemical, energy, and biotech companies accelerate technology adoption across mobility and industrial sectors.
Germany: Ethanol 2.0 Market Growth Trends
Germany is emerging as a high-potential market for Ethanol 2.0 due to its focus on reducing transport emissions and expanding renewable chemical feedstocks. Government incentives support waste-to-fuel technologies, cellulosic ethanol projects, and the integration of bioethanol into synthetic fuels. Industrial users, particularly chemical manufacturers, increasingly adopt advanced ethanol for lower-carbon production pathways.
Asia Pacific: Ethanol 2.0 Market Is Driven By Supportive Policies
Asia Pacific is rapidly expanding its Ethanol 2.0 market, driven by rising energy demand, carbon-neutrality commitments, and strong interest in agricultural waste valorisation. Countries across the region are scaling next-gen biofuel plants using rice straw, bagasse, municipal waste, and algae feedstocks. Supportive policies, industrial decarbonization needs, and growing automotive sectors accelerate the deployment of advanced ethanol technologies.
India: Ethanol 2.0 Market Growth Trends
India is a major growth hotspot due to its national biofuel policy and rapid expansion of 2G (second-generation) ethanol plants based on crop residues. Strong government backing, blending mandates, and the availability of abundant biomass encourage investment in new biorefineries. Ethanol 2.0 aligns with India’s energy security goals, reducing crude oil imports while supporting rural bio-economy development.
South America Market Growth Is Driven By The Advanced Technologies
South America, led by Brazil, has a mature bioethanol ecosystem transitioning into advanced Ethanol 2.0 technologies. The region leverages extensive sugarcane resources and introduces 2G production using bagasse and waste biomass. Growing SAF initiatives, export opportunities, and increasing sustainability regulations strengthen market expansion across transportation and industrial applications.
Brazil: Ethanol 2.0 Market Growth Trends
Brazil is a global leader in bioethanol and now pioneers Ethanol 2.0 through integrated first- and second-generation biorefineries. Strong policy support, carbon credit programs, and established ethanol blending infrastructure enable the quick adoption of advanced processes. Investments in cellulosic ethanol and bio-based chemical pathways continue to enhance Brazil’s position in the next-gen biofuel landscape.
Middle East & Africa (MEA): The Growth Is Driven By Diversifying Energy Sources
MEA’s Ethanol 2.0 market remains nascent but is steadily evolving, driven by waste-to-fuel initiatives, circular economy policies, and interest in diversifying energy sources. Countries are exploring municipal waste, agro-waste, and algae-based ethanol technologies. Growing industrial decarbonization needs and new partnerships with global biofuel companies are improving regional capability.
GCC Countries: Ethanol 2.0 Market Growth Trends
GCC nations are investing in Ethanol 2.0 mainly through pilot and demonstration-scale projects using waste biomass and COâ‚‚-to-ethanol technologies. Their focus on creating low-carbon industrial zones and advanced petrochemical pathways accelerates the adoption of sustainable fuel alternatives. Strategic collaborations with international biotech firms support research and early commercialisation.
Recent Developments
- In May 2025, Prime Minister Narendra Modi inaugurated India's first bamboo-based ethanol plant at the Numaligarh Refinery in Assam on September 14, 2025. The facility, developed by Assam Bio Ethanol Private Limited with an investment of ₹5,000 crore, is the world's first commercial-scale plant to produce second-generation ethanol exclusively from green bamboo. (Source: www.energetica-india.net)
- In April 2025, India's government accelerated its ethanol blending program, successfully achieving a 20% blend nationwide and setting a new target of 30% blending by 2030. This initiative aims to reduce oil imports, save foreign exchange, cut emissions, and benefit farmers, although achieving the 30% target will require vehicle compatibility considerations and potential engine modifications or the development of new flex-fuel vehicles.(Source: www.indiatoday.in)
Top players in the Ethanol 2.0 Market & Their Offerings:
- Raízen (Brazil): Raízen is a global leader in advanced (second-generation) ethanol production derived from sugarcane bagasse and agricultural residues. The company’s Ethanol 2.0 technology enhances yield without expanding farmland, supporting low-carbon fuel initiatives and sustainable mobility.
- POET–DSM Advanced Biofuels (USA/Netherlands): This joint venture focuses on next-generation cellulosic ethanol using corn stover and agricultural waste. Their proprietary enzyme and yeast technologies enable high-efficiency conversion, supplying renewable fuels for transportation and reducing lifecycle emissions.
- DuPont Industrial Biosciences (USA): DuPont has pioneered cellulosic ethanol through its enzyme platforms and pretreatment technologies. The company provides advanced bioprocessing solutions for Ethanol 2.0 plants, aiming to convert biomass such as corn stover, wheat straw, and other residues into renewable fuel.
- Clariant AG (Switzerland): Clariant’s Sunliquid® technology is a major innovation in the Ethanol 2.0 market, enabling enzymatic hydrolysis of various agricultural wastes. Its process is known for high yields, low energy consumption, and scalability for commercial biorefinery operations globally.
- GranBio (Brazil): GranBio produces second-generation ethanol using sugarcane straw and bagasse through its Bioflex biorefinery. The company specialises in advanced biofuels, nanocellulose, and integrated biochemicals, supporting low-carbon initiatives and sustainable energy development.
Other Top Players Are
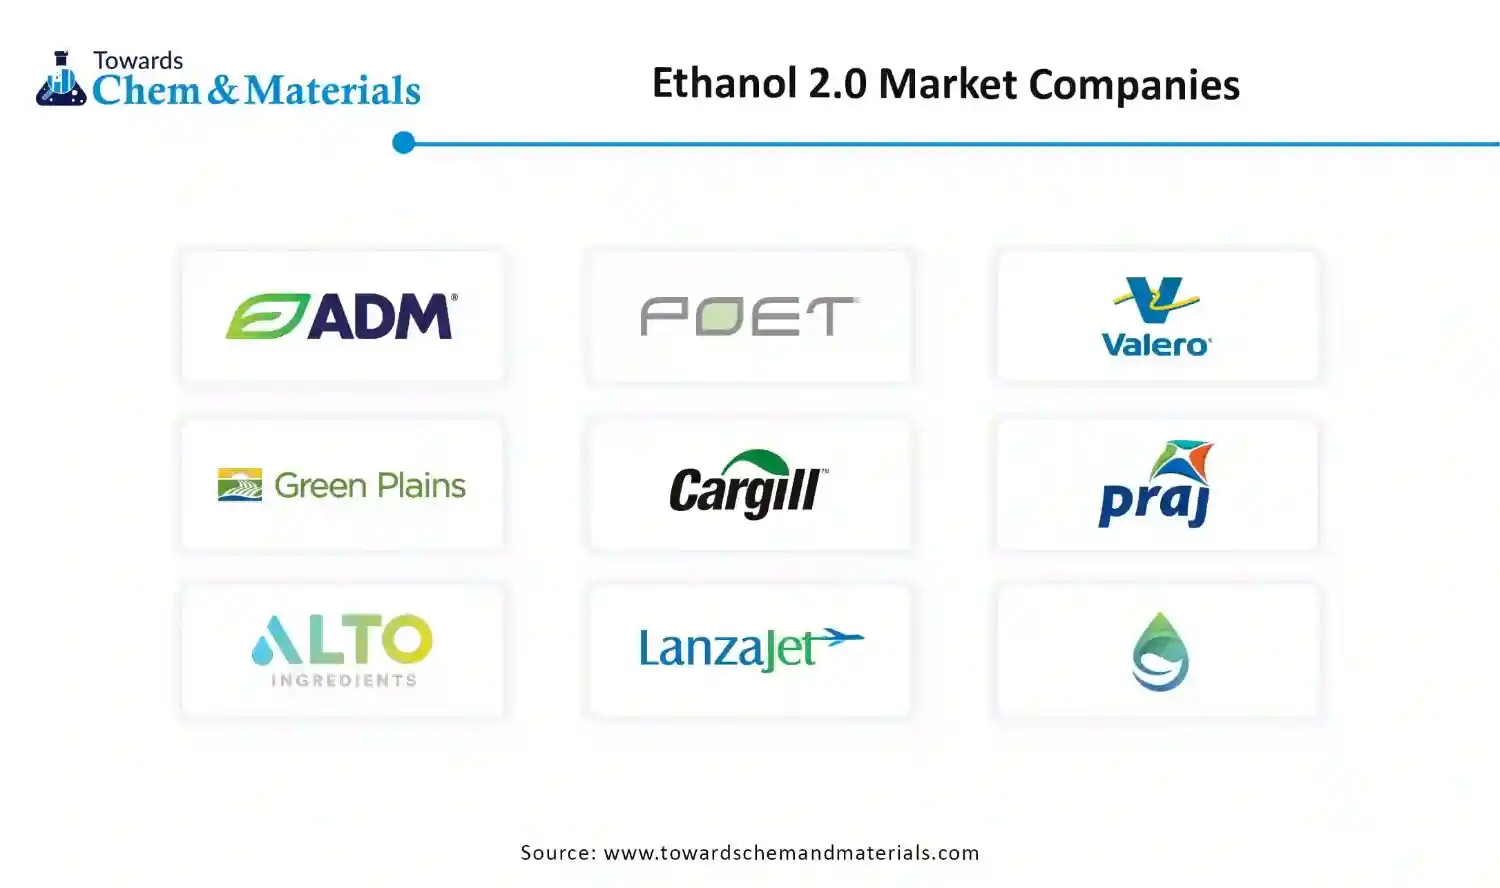
- Archer Daniels Midland (ADM)
- POET LLC
- Valero Energy Corporation
- Green Plains Inc
- Cargill BP
- Praj Industries
- Alto Ingredients
- LanzaJet,
- LiYF 2G Bioethanol
- Universal Fuel Technologies
- EVES ENERGY
- Green Energy Chemicals
- Triti
- Springbok Energy
- EthanBiofuel
- altM
- Inovelsa Algae Tech
- Cheranna Energy
Segments Covered:
By Technology Pathway
- Cellulosic Ethanol
- Coâ‚‚-to-Ethanol (Electrofuel / Power-To-X)
- Advanced Enzymatic Hydrolysis & Fermentation
By Feedstock Type
- Agricultural Residues
- Industrial Coâ‚‚ Streams
- Municipal Solid Waste (MSW)
By Application
- Advanced Transportation Fuels
- Chemicals & Petrochemical Replacements
- Industrial Uses
By Distribution Channel
- Fuel Blenders & Refineries
- Direct Sales to Airlines (SAF Contracts)
- Chemical Manufacturers
By Region
- North America
- U.S.
- Canada
- Mexico
- Europe
- Germany
- UK
- France
- Italy
- Spain
- Asia Pacific
- China
- India
- Japan
- South Korea
- Latin America
- Brazil
- Argentina
- Middle East & Africa
- Saudi Arabia
- South Africa
A Seven-Phase Framework
Our methodology is designed to be universally applicable across commodity chemicals, specialty chemicals, petrochemicals, construction chemicals, coatings, electronic chemicals, industrial gases, agrochemicals, water treatment chemicals, and performance materials. Each phase builds upon the last, creating a layered validation structure that minimizes estimation error and maximizes analytical confidence.
The framework ensures comprehensive market coverage, robust cross-validation, and reliable long-term forecasting — producing market estimates that withstand scrutiny from investors, regulators, and corporate strategy teams.

Seven-Phase Framework — Analytical Effort Distribution
Relative analytical effort allocated across each phase of the Chemicals & Materials research framework

Phase 1 - Secondary Research: Establishing the Foundation
Secondary research collects and evaluates publicly available information from authoritative sources, establishing the foundational understanding of market structure, value chain dynamics, competitive landscape, and end-use demand patterns. Every source is evaluated for credibility, recency, geographic relevance, and methodological soundness before inclusion.
Industry Associations
Sources include ACC, CEFIC, ICCA, JCIA, CPCIF, and SOCMA providing production volumes, consumption trends, capacity developments, and sustainability initiatives.
Company Disclosures
Annual reports, investor presentations, earnings transcripts, and regulatory filings reveal product portfolios, manufacturing footprints, capacity expansions, and revenue segmentation.
Government Databases
National statistical offices, customs authorities, environmental agencies, and industrial production databases provide verified statistics on output, trade flows, and regulatory compliance.
Trade Databases
UN Comtrade, ITC, Eurostat, and national customs authorities enable assessment of global product movement, import dependency, and export competitiveness across regions.
Our Secondary Research Sources
- Ministry of Chemicals and Fertilizers
- European Chemicals Agency
- United States Department of Energy
- Ministry of Industry and Information Technology
- Ministry of Economy Trade and Industry
- Ministry of Trade Industry and Energy
- National Institute of Standards and Technology
- Council of Scientific and Industrial Research
- Fraunhofer Society
- National Institute for Materials Science
Phase 2 — Supply-Side Assessment: Mapping Production Capabilities
Production Capacity Analysis
All major manufacturers are assessed for existing installed capacity, planned additions, expansions, new plant announcements, and technology adoption — mapped at global, regional, and country levels.
Capacity Utilization Adjustment
Installed capacity is adjusted using utilization rates based on demand conditions, feedstock availability, plant operating rates, maintenance schedules, and regulatory restrictions.
Manufacturer Revenue Analysis
Product-specific revenues, segment-level performance, regional distribution, average selling prices, and margin trends are evaluated to establish market value estimates.
Supply-Side Assessment — Capacity vs. Effective Production by Region
Illustrative comparison of installed capacity vs. effective production volume (after utilization rate adjustment) across major regions

Phase 3 — Demand-Side Assessment: Quantifying Chemical Consumption
Demand-side analysis quantifies chemical consumption across industries, applications, and geographies — identifying where and how chemicals are consumed throughout the value chain with precision.
End-Use Industry Analysis
Chemical demand is evaluated across automotive, construction, packaging, electronics, agriculture, healthcare, consumer goods, industrial manufacturing, energy and utilities, and water treatment. Industry output, production trends, and consumption intensity are analyzed to determine demand patterns.
Consumption Modeling
Demand is estimated using measurable indicators: kilograms per vehicle, kilograms per square meter of construction, dosage per cubic meter of water treated, kilograms per hectare of agricultural land, and kilograms per ton of manufactured products. Consumption factors are validated through industry publications and primary interviews.
Application Analysis
The market is segmented by application area to understand product performance requirements, formulation trends, technology adoption, customer preferences, and regulatory requirements improving demand accuracy and segmentation granularity.
Demand-Side Assessment — End-Use Industry Demand Distribution
Illustrative distribution of chemical & materials demand across key end-use industries

Phase 4 - Trade Flow Analysis: Balancing Regional Supply and Demand
Trade flow analysis reconciles regional supply and demand estimates through import and export data, identifying net supply positions, regional dependencies, and market imbalances. It serves as an independent validation layer that tests the consistency of supply-side and demand-side estimates.
Import Analysis
Import data is evaluated to determine volumes, source countries, product dependency, regional supply gaps, and pricing trends — identifying markets that rely heavily on external supply and where domestic production is insufficient to meet demand.
Export Analysis
Export assessments reveal production surplus, export competitiveness, regional manufacturing strength, and global market participation. Export patterns also help validate domestic production estimates and identify net exporting regions.
Apparent Consumption Model
Regional consumption is assessed using the standard apparent consumption formula:
Results identify net importing regions, net exporting regions, regional deficits, and surpluses — serving as an independent validation of supply and demand estimates.
Trade Flow Analysis — Net Supply Position by Region
Illustrative apparent consumption vs. domestic production across major regions — positive gap indicates net import dependency

Phase 5 — Primary Research: The Critical Validation Layer
Primary research tests and refines findings from secondary research through direct engagement with industry participants across the supply chain, demand side, and expert community. It captures intelligence that no database or published report can provide — the real-world experience of manufacturers, buyers, and specialists operating in the market.

Supply-Side Interviews
Conversations with chemical manufacturers, raw material suppliers, contract manufacturers, technology providers, and plant operators cover production trends, capacity utilization, pricing developments, technology shifts, and competitive dynamics.

Demand-Side Interviews
Engagement with OEMs, industrial consumers, procurement managers, distributors, formulators, and end-use manufacturers focuses on consumption trends, purchasing behavior, product substitution, demand outlook, and emerging applications.

Industry Expert Consultations
Additional interviews with industry consultants, independent experts, regulatory specialists, technical professionals, and research institutions provide deeper market context and validate key analytical assumptions.
Focus Areas of Primary Research:
Market Size & Forecast Validation
Revenue estimates, volume consumption, growth rates, forecast assumptions, regional demand.Supply Chain & Value Chain Assessment
Raw material sourcing, supply chain challenges, distribution networks, procurement practices.Production & Capacity Analysis
Manufacturing capacity, utilization rates, expansion projects, plant investments.Pricing & Cost Structure Analysis
Product pricing trends, feedstock costs, energy costs, margin pressures, pricing outlook.Competitive Landscape Assessment
Volume and value estimates confirmed to be fully consistent with one another before publicationInterview Volume by Market Scope
| Study Scope | Number of Interviews |
|---|---|
| Niche Market | 20 – 30 |
| Mid-Sized Market | 30 – 50 |
| Global Market | 50 – 80 |
| Highly Fragmented Market | 80 – 120 |
Interview Details:
Category : Manufacturers, Suppliers, Distributors, End Users, Experts/Associations
Average Duration : 30–60 Minutes
Interview Mode : Video calls, telephonic interviews, expert consultations
Interview Format : Structured / Semi-Structured questionnaire
Focus Areas of Primary Research:
Market Size & Forecast Validation :
Revenue estimates, volume consumption, growth rates, forecast assumptions, regional demand.
Supply Chain & Value Chain Assessment :
Raw material sourcing, supply chain challenges, distribution networks, procurement practices.
Production & Capacity Analysis :
Manufacturing capacity, utilization rates, expansion projects, plant investments.
Pricing & Cost Structure Analysis :
Product pricing trends, feedstock costs, energy costs, margin pressures, pricing outlook.
Competitive Landscape Assessment :
Market share, competitor positioning, strategic initiatives, partnerships, acquisitions.
Primary Research — Stakeholder Coverage by Category
Distribution of interview respondents across stakeholder categories (% share from PPT data)

Primary Research — Respondent Designation Profile
Seniority breakdown of interview respondents (% share from PPT data)

Primary Research — Geographic Coverage of Interviews
Regional distribution of primary research engagement (% share from PPT data)

Phase 6 — Data Triangulation and Market Validation
No single methodology is relied upon in isolation. Multiple independent estimation approaches are combined and reconciled to ensure consistency, accuracy, and analytical defensibility. Any material deviations between approaches are investigated and adjusted through additional validation cycles.
The final market size is derived through weighted triangulation of all validated methodologies. Any material deviations between approaches are investigated and adjusted through additional validation cycles. The outcome represents the most realistic assessment of the market based on available evidence and expert confirmation ensuring that volume and value estimates are fully consistent with one another.
Triangulation Framework — Input Contribution Weight
Relative weight each sizing input contributes to the final reconciled market estimate

Phase 7 — Forecast Modeling: Projecting Future Market Evolution
Forecasting evaluates the future trajectory of the market using a combination of quantitative indicators and qualitative assessments across economic, industry, and regulatory dimensions. Rather than simple extrapolation, each driver is independently modeled and integrated into a composite forecast.
Macroeconomic Indicators
GDP growth, industrial production, manufacturing output, construction activity, consumer spending, and capital investment form the quantitative foundation of long-term demand projections. These are applied at country, regional, and global levels.
Industry Growth Drivers
Urbanization, infrastructure development, industrialization, technological innovation, sustainability initiatives, and evolving product performance requirements are assessed at regional and industry levels — capturing both structural and cyclical demand drivers.
Capacity Expansion Analysis
Announced plant expansions, new manufacturing facilities, technology upgrades, and strategic investments are evaluated to determine future supply-demand dynamics and potential market tightness or oversupply situations.
Regulatory & Sustainability
Environmental regulations, chemical safety standards, emission reduction targets, circular economy initiatives, and sustainability requirements are incorporated as they often influence product adoption rates and market growth trajectories.
Scenario Forecast Range — Indexed Market Growth (Year 1–10)
Illustrative indexed growth trajectories across Base, Optimistic, and Pessimistic scenarios over a 10-year forecast horizon

Forecast Drivers — Relative Impact Score by Category
Impact score (0–100) of each driver type on chemicals & materials market forecast




Comments
Share your thoughts, ask a question, or provide feedback about this report.