
Magnesium Powder Market Size Analysis Report 2035
The global magnesium powder market size was estimated at USD 360.45 million in 2025 and is expected to increase from USD 383.34 million in 2026 to USD 667.14 million by 2035, growing at a CAGR of 6.35% from 2026 to 2035. In terms of volume, the market is projected to grow from 280.0 thousand tons in 2025 to 909.2 thousand tons by 2035. growing at a CAGR of 12.50% from 2026 to 2035. Asia Pacific dominated the magnesium powder market with the largest volume share of 45.00% in 2025. The shift towards lightweight materials has accelerated market growth in recent years.
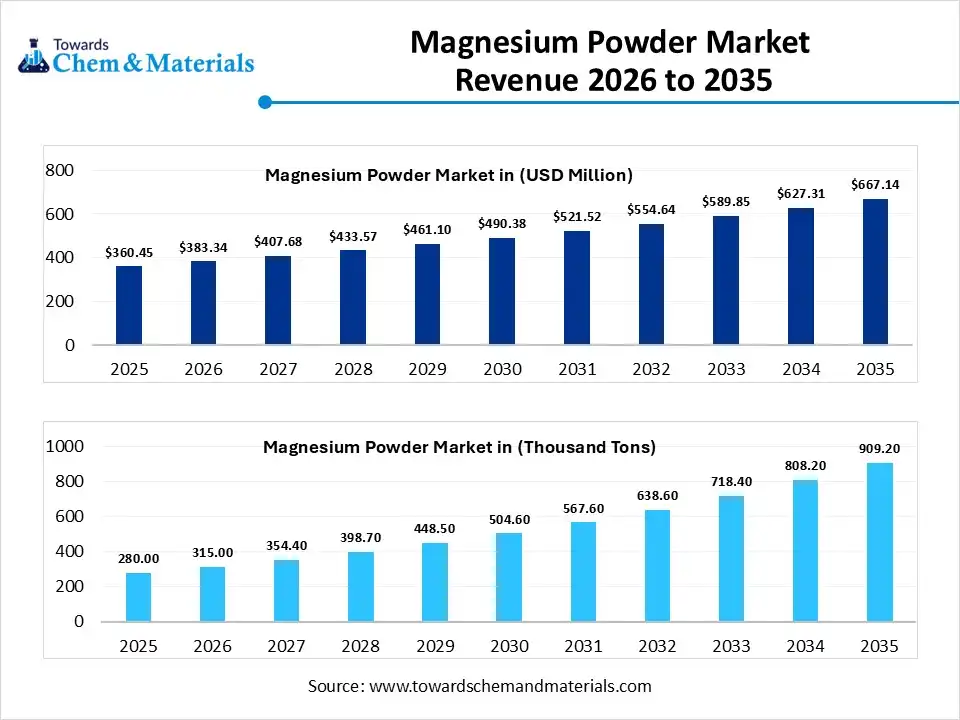
Maket Highlights
- The Asia Pacific dominated the global magnesium powder market with the largest volume share of 45.00% in 2025.
- The magnesium powder market in North America is expected to grow at a substantial CAGR of 13.49% from 2026 to 2035.
- The Europe magnesium powder market segment accounted for the major volume share of 18.41% in 2025.
- By product type, the atomized pure magnesium powder segment dominated the market and accounted for the largest volume share of 40% in 2025.
- By product type, the specialty/nano-grade magnesium powder segment is expected to grow at the fastest CAGR of 16.44% from 2026 to 2035 in terms of volume.
- By end use, the automotive segment led the market with the largest revenue volume share of 35.00% in 2025.
- By form, the standard/industrial grade segment dominated the market and accounted for the largest volume share of 45.00% in 2025.
Magnesium Powder: Small Particles, Big Power
The metal powder, which is made from magnesium metal called magnesium powder. Moreover, the magnesium powder has seen using in fast reaction, bright energy release, and lightweight strength is needed. Also, sectors like fireworks, construction materials, metal alloys, and energy applications have seen under the heavy need for magnesium powder in the past few years, as per the observation.
Magnesium Powder Market Trends:
- The growing need for the high energy and lightweight materials has been forecast to strengthen the bottom line for the production firms in recent years. Moreover, the major sectors such as the construction, transportation, and industrial manufacturing have elevated the earning potential for magnesium powder producers by using it in their field as an ideal material in recent years.
- The greater shift towards safer and controlled powder handling is likely to lead robust revenue growth across the sector. Also, the major brands are sen under the heavy improvements of handling the magnesium powder due to its stronger reaction characteristics.
- The expansion into the specialized and advanced applications is expected to translate into favourable financial prospects for producers in the coming years. Moreover, the manufacturers are actively collaborating with the brands to supply tailored options of the magnesium powder in the past few years.
Report Scope
| Report Attribute | Details |
| Market Size and Volume in 2026 | USD 383.34 Million / 315.0 Thousand Tons |
| Revenue Forecast in 2035 | USD 667.14 Million / 909.2 ThousandTons |
| Growth Rate | CAGR 6.35% |
| Forecast Period | 2026 - 2035 |
| Base Year | 2025 |
| Units Considered | Value (Billion / Million), Volume (Thousand Tons) |
| Dominant Region | Asia Pacific |
| Segment Covered | By Product Type, By End-User Industry, By Form/Grade,By Region |
| Key companies profiled | Almamet GMBH (and subsidiary Almamet Shanxi), Société pour la Fabrication du Magnésium SA (SFM), Luxfer Magtech, US Magnesium LLC, Magnezit Group, Gulf Magnesium, STAHLwerk GmbH, Tateho Chemical Industries, Shanghai Regal Magnesium Ltd., Taiyuan Tongxiang Magnesium Co., Nippon Kinzoku Co., China Minmetals Non-Ferrous Metals Co., Magnesium Elektron Ltd., Korea Magnesium Corporation (KMC), Norsk Hydro ASA, Shijiazhuang Donghua Jinlong Chemical, Beihai Group, Liaoning Aihai Talc Co., Premier Magnesia LLC, BASF SE |
When Particle Precision Meets Innovation
The industry is actively shifting from rough, uneven powder production to controlled and precise particle design. Earlier methods produced powders with mixed sizes, which caused unstable performance. Moreover, the new processes focus on uniform particle size and smoother surfaces. This improves safety, reaction control, and product quality. With better control, magnesium powder can be used more accurately in advanced applications.
Trade Analysis of the Magnesium Powder Market :
Import, Export, Consumption, and Production Statistics
- China has been known for the heavy magnesium powder exports, where the country has exported the 7,127 mt magnesium powder in 2024.
- The United States been observed in sophisticated magnesium powder export with 484 shipments according to the published report.
Value Chain Analysis of the Magnesium Powder Market:
- Distribution to Industrial Users: The magnesium powder industry continues to be dominated by direct distribution channels, as manufacturers prioritize reducing supply chain steps to offer competitive pricing to high-volume industrial users.
- Key Players: US Magnesium LLC and RIMA Group
- Chemical Synthesis and Processing: The synthesis and processing of magnesium (Mg) powder have evolved to support advanced manufacturing, particularly additive manufacturing -3D printing and hydrogen storage.
- Key Players: Almamet GMBH and Luxfer Magtech
- Regulatory Compliance and Safety Monitoring: The regulatory landscape for magnesium powder is strictly governed by standards that address its high reactivity, specifically its tendency to ignite on contact with air or moisture. Compliance focuses on preventing Class D metal fires and managing explosive dust environments.
- Safety Standards- NFPA 484 and REACH and CLP (EU)
Magnesium Powder Market Regulatory Landscape: Global Regulations
| Country / Region | Regulatory Body | Key Regulations | Focus Areas |
| United States | Occupational Safety and Health Administration (OSHA) | 29 CFR 1910.1200 (Hazard Communication) | Mitigating dust explosion risks in additive manufacturing (3D printing) |
| European Union | European Chemicals Agency (ECHA) | REACH Regulation (EC 1907/2006) | Reducing import dependency, ensuring "Explosion Protection Documents" (EPD) for industrial sites |
| China | Ministry of Emergency Management (MEM) | Decree 591 (Safe Management of Hazardous Chemicals) | Controlling overcapacity |
Segmental Insights
Product Type Insights
How did the Atomized Pure Magnesium Powder Segment Dominate the Magnesium Powder Market in 2025?
The atomized pure magnesium powder segment volume was valued at 112.0 thousand tons in 2025 and is projected to reach 354.4 thousand tons by 2035, expanding at a CAGR of 13.66% during the forecast period from 2025 to 2035. The atomized pure magnesium powder segment dominated the market with approximately 40% volume share in 2025, due to its offerings like better purity, uniform particle size, and reliable performance. Moreover, by producing the power that reacts and flows well with consistency, the atomized pure magnesium has gained major attention from industrial users in recent years.
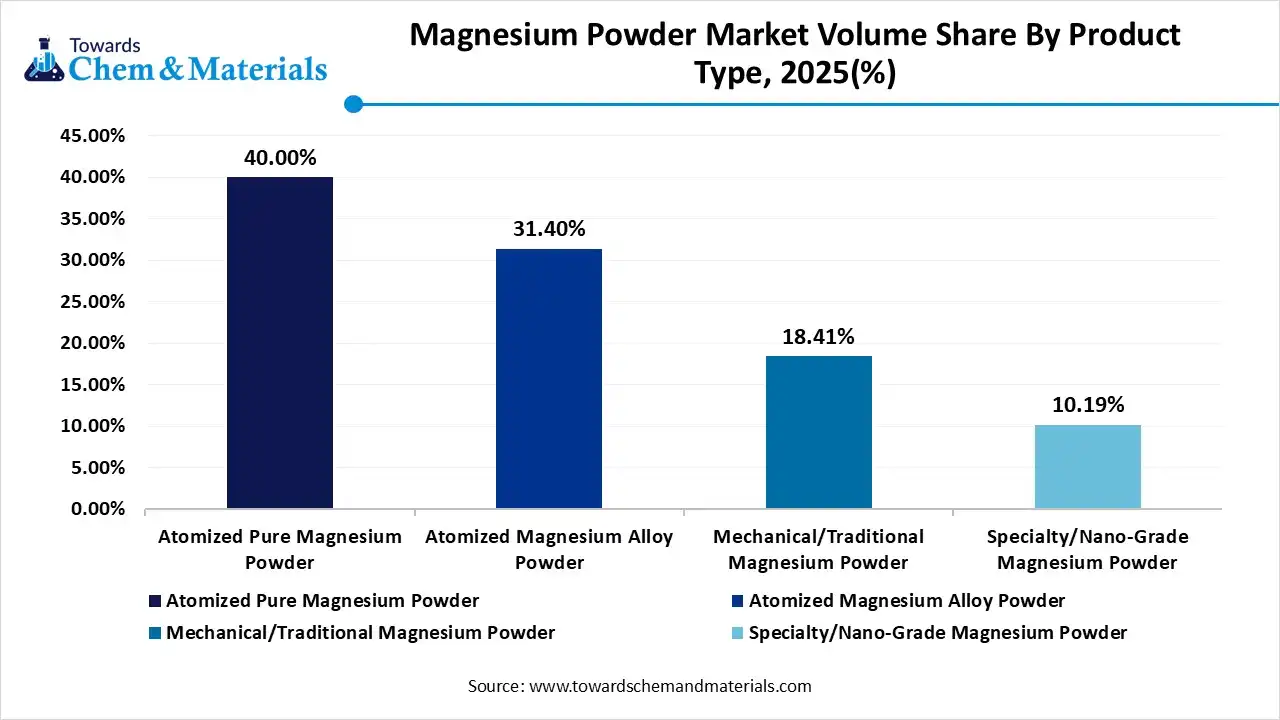
The specialty/nano-grade magnesium powder segment volume was valued at 28.5 thousand tons in 2025 and is expected to surpass around 112.3 thousand tons by 2035, and it is anticipated to expand to 16.44% of CAGR during 2026 to 2035., owing to the increasing need for control, precision, and advanced performance. Moreover, by providing advantages like higher surface area, better integration into advanced systems, and faster reaction, the segment is likely to positively impact revenue potential and industry scalability in the coming years.
Magnesium Powder Market Volume and Share, By Product Type, 2025-2035
| By Product Type | Market Volume Share (%), 2025 | Market Volume (Thousand Tons)2025 | Market Volume (Thousand Tons)2035 | CAGR(%) 2026-2035 | Market Volume Share (%), 2035 |
| Atomized Pure Magnesium Powder | 40.00% | 112.0 | 354.4 | 13.66% | 38.98% |
| Atomized Magnesium Alloy Powder | 31.40% | 87.9 | 273.9 | 13.46% | 30.12% |
| Mechanical/Traditional Magnesium Powder | 18.41% | 51.5 | 168.7 | 14.08% | 18.55% |
| Specialty/Nano-Grade Magnesium Powder | 10.19% | 28.5 | 112.3 | 16.44% | 12.35% |
End Use Insights
How did the Automotive Segment Dominate the Magnesium Powder Market in 2025?
The automotive segment dominated the market with approximately 35% industry volume share in 2025, akin to the powder is aligning with the industry's goal of lighter, more efficient vehicles. The material enables performance improvements without major design changes. Manufacturers adopt it where weight savings directly impact efficiency and emissions. The automotive sector's large production volumes further amplified magnesium powder consumption.
The advanced manufacturing & additive industries segment is expected to grow because they require high-precision, customizable materials. Magnesium powder supports complex geometries and controlled material behavior in modern production methods. These industries prioritize performance per unit weight and process efficiency.
Form Insights
Why does the Standard/ Industrial Grade Segment Dominate the Magnesium Powder Market?
The standard/industrial grade segment dominated the market with approximately 45% volume share in 2025, owing to its cost-effectiveness, wide availability, and suitability for bulk applications. These grades meet the needs of traditional industries that prioritize volume and reliability. They integrate easily into established production systems. Their balance of performance and affordability supported large-scale adoption across automotive construction and chemical industries.
The specialised composite powder segment is expected to grow at a rapid CAGR, akin to industries increasingly need multi-functional materials. These powders combine magnesium with other elements to deliver enhanced strength, stability, and performance. They are designed for specific applications rather than general use.
Regional Insights
The Asia Pacific magnesium powder market size was valued at USD 162.20 million in 2025 and is expected to be worth around USD 300.21 million by 2035, exhibiting at a compound annual growth rate (CAGR) of 6.37% over the forecast period from 2026 to 2035.
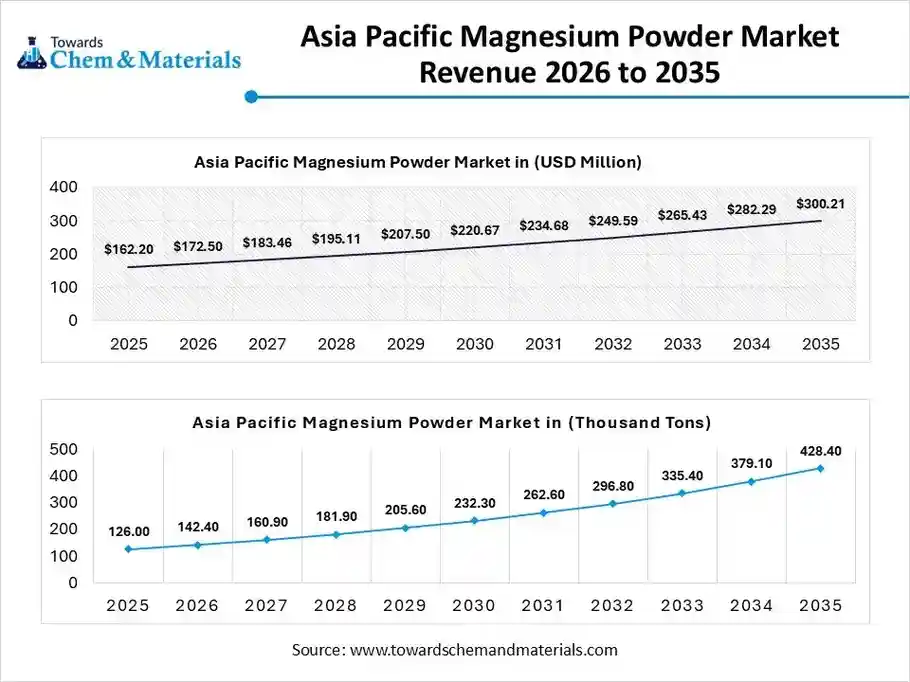
The Asia Pacific magnesium powder market volume was estimated at 126.0 thousand tons in 2025 and is projected to reach 428.4 thousand tons by 2035, growing at a CAGR of 14.57% from 2026 to 2035. Asia Pacific dominated the magnesium powder market with approximately 45.00% share in 2025, due to heavy manufacturing volume and a cost-efficient production environment in the current period. Also, the major sectors in the region, such as chemicals, metal processing, and construction materials, have created profitable pathways for sector participants in the past few years, as per the observation.
North America Magnesium Powder Market Evaluation
The North America magnesium powder market volume was estimated at 79.0 thousand tons in 2025 and is projected to reach 246.8 thousand tons by 2035, growing at a CAGR of 13.49% from 2026 to 2035. North America is a notably growing region due to the regional sudden shift towards safety, precision, and high-performance applications. Also, the major industries in the region have been observed under the privatization of material behavior and regulatory compliance, which is anticipated to contribute to favorable industry economics for the market in the coming years.
China Leads High Volume Magnesium Production
China maintained its dominance in the market, owing to the heavy production and export of magnesium powder. Also, having an abundant raw material supply and well-developed metal processing industries, the country has driven investor confidence in the industry’s future. Also, the ability scale production in minimum time is expected create lucrative opportunities in the country during the forecast period.

Brazil Emerges as Magnesium Powerhouse
The Brazil is expected to emerge as a prominent country for the magnesium powder market in the coming years, akin to the strong industrial demand and local manufacturing requirements. Magnesium powder is used to improve material efficiency and reduce production weight. Also, the Brazilian industries value adaptable materials that fit existing processes
Consistent Performance Powers United States Manufacturing
The United States is expected to gain a major industry share, akin to the presence of advanced manufacturing infrastructure and early access to the latest technology. Also, factors like material consistency and predictable outcomes are likely to support stronger cash flows for manufacturing enterprises of the magnesium powder in the United States during the projected period.
Europe Magnesium Powder Market Evaluation
Europe is a notably growing region, owing to increased demand for high-performance materials that meet strict safety and environmental standards. European industries emphasize durability, efficiency, and long-term reliability. Magnesium powder is increasingly used where weight reduction and reaction precision are essential. The region's strong engineering culture supports continuous material refinement rather than mass adoption.
Germany Advances Performance With Reliable Materials
Germany is expected to gain a major industry share, due to its ability to enhance performance without compromising reliability. German manufacturers use the material selectively in processes requiring accuracy and stability. Also, Germany's disciplined approach to material selection encourages the use of magnesium powder in specialized applications.
Magnesium Powder Market Volume and Share, By Region, 2025-2035
| By Region | Market Volume Share (%), 2025 | Market Volume ( Thousand Tons)2025 | Market Volume (Thousand Tons)2035 | CAGR(%) 2026-2035 | Market Volume Share (%), 2035 |
| North America | 28.21% | 79.0 | 246.8 | 13.49% | 27.14% |
| Europe | 18.41% | 51.5 | 155.7 | 13.07% | 17.12% |
| Asia Pacific | 45.00% | 126.0 | 428.4 | 14.57% | 47.12% |
| Latin America | 5.31% | 14.9 | 47.2 | 13.69% | 5.19% |
| Middle East & Africa | 3.07% | 8.6 | 31.2 | 15.39% | 3.43% |
Latin America Magnesium Powder Market Examination
The Latin America magnesium powder market volume was estimated at 14.9 thousand tons in 2025 and is projected to reach 47.2 thousand tons by 2035, growing at a CAGR of 13.69% from 2026 to 2035. Latin America is expected to capture a major share of the magnesium powder market with a rapid CAGR, owing to the increasing industrial activity and material optimization efforts. Industries seek cost-effective ways to improve performance. Magnesium powder provides efficiency gains without major process changes. This makes it attractive for gradual adoption in the region.
Magnesium Powder Market Study in the Middle East and Africa
The Middle East and Africa magnesium powder market volume was estimated at 8.6 thousand tons in 2025 and is projected to reach 31.2 thousand tons by 2035, growing at a CAGR of 15.39% from 2026 to 2035. The Middle East and Africa are expected to capture a notable share of the industry, due to increasing industrial diversification. Also, the regional countries are investing in manufacturing capabilities beyond raw material exports. Magnesium powder is valued for its performance in high-temperature and demanding environments. Infrastructure development and industrial projects create demand for durable and efficient materials in the region.
Magnesium Powers Saudi Industrial Advancement
Saudi Arabia is expected to emerge as a prominent country, akin to focus on industrial development and material efficiency. The country is expanding manufacturing activities that require durable and high- performance materials. Magnesium powder supports these goals by improving reaction efficiency and reducing material weight.
Recent Developments
- In July 2025, Fytika unveiled its latest supplement called magnesium bisglycinate+. Also, the newly launched supplement is specifically designed to support better sleep while enhancing brain function, as per the published report published by the company.(Source: fooddrinkinnovations.com)
- In July 2025, The Rasayanam has introduced a high absorption magnesium supplement known as Rasayanam Magnesium Glycinate in India. Also, this supplement is likely to help in the recovery of low energy, anxiety, and muscle cramps as per the company's claim.( Source: www.tribuneindia.com)
Top Vendors in the Magnesium Powder Market & Their Offerings:
- Almamet GMBH (and subsidiary Almamet Shanxi): A global leader in the desulfurization of hot metal, providing customized magnesium-based reagents and powders through its integrated production network in Europe and China.
- Société pour la Fabrication du Magnésium SA (SFM): A Swiss-based specialist renowned for producing high-purity, atomized magnesium and magnesium alloy powders tailored for the aerospace, defense, and high-end industrial sectors.
- Luxfer Magtech: A division of the Luxfer Group that stands as a premier manufacturer of high-performance magnesium powders used in critical applications such as military countermeasures, heat-source products, and chemical processing.
- US Magnesium LLC: Operating the largest primary magnesium refinery in North America, this company is a critical domestic supplier of magnesium products, including specialized powders for the steel, aerospace, and chemical industries.
- Magnezit Group
- Gulf Magnesium
- STAHLwerk GmbH
- Tateho Chemical Industries
- Shanghai Regal Magnesium Ltd.
- Taiyuan Tongxiang Magnesium Co.
- Nippon Kinzoku Co.
- China Minmetals Non-Ferrous Metals Co.
- Magnesium Elektron Ltd.
- Korea Magnesium Corporation (KMC)
- Norsk Hydro ASA
- Shijiazhuang Donghua Jinlong Chemical
- Beihai Group
- Liaoning Aihai Talc Co.
- Premier Magnesia LLC
- BASF SE
Segments Covered in the Report
By Product Type
- Atomized Pure Magnesium Powder
- Atomized Magnesium Alloy Powder
- Mechanical/Traditional Magnesium Powder
- Specialty/Nano-Grade Magnesium Powder
By End-User Industry
- Automotive Sector
- Aerospace & Defense
- Electronics & Electrical
- Chemical & Metallurgy
- Research & Development
- Advanced Manufacturing & Additive Industries
By Form/Grade
- Standard/Industrial Grade
- High-Purity/Technical Grade
- Micro/Nano-Grade
- Specialized Composite Powder
By Region
- North America
- U.S.
- Canada
- Mexico
- Europe
- Germany
- UK
- France
- Italy
- Spain
- Asia Pacific
- China
- India
- Japan
- South Korea
- Latin America
- Brazil
- Argentina
- Middle East & Africa
- Saudi Arabia
- South Africa
A Seven-Phase Framework
Our methodology is designed to be universally applicable across commodity chemicals, specialty chemicals, petrochemicals, construction chemicals, coatings, electronic chemicals, industrial gases, agrochemicals, water treatment chemicals, and performance materials. Each phase builds upon the last, creating a layered validation structure that minimizes estimation error and maximizes analytical confidence.
The framework ensures comprehensive market coverage, robust cross-validation, and reliable long-term forecasting — producing market estimates that withstand scrutiny from investors, regulators, and corporate strategy teams.

Seven-Phase Framework — Analytical Effort Distribution
Relative analytical effort allocated across each phase of the Chemicals & Materials research framework

Phase 1 - Secondary Research: Establishing the Foundation
Secondary research collects and evaluates publicly available information from authoritative sources, establishing the foundational understanding of market structure, value chain dynamics, competitive landscape, and end-use demand patterns. Every source is evaluated for credibility, recency, geographic relevance, and methodological soundness before inclusion.
Industry Associations
Sources include ACC, CEFIC, ICCA, JCIA, CPCIF, and SOCMA providing production volumes, consumption trends, capacity developments, and sustainability initiatives.
Company Disclosures
Annual reports, investor presentations, earnings transcripts, and regulatory filings reveal product portfolios, manufacturing footprints, capacity expansions, and revenue segmentation.
Government Databases
National statistical offices, customs authorities, environmental agencies, and industrial production databases provide verified statistics on output, trade flows, and regulatory compliance.
Trade Databases
UN Comtrade, ITC, Eurostat, and national customs authorities enable assessment of global product movement, import dependency, and export competitiveness across regions.
Our Secondary Research Sources
- Ministry of Chemicals and Fertilizers
- European Chemicals Agency
- United States Department of Energy
- Ministry of Industry and Information Technology
- Ministry of Economy Trade and Industry
- Ministry of Trade Industry and Energy
- National Institute of Standards and Technology
- Council of Scientific and Industrial Research
- Fraunhofer Society
- National Institute for Materials Science
Phase 2 — Supply-Side Assessment: Mapping Production Capabilities
Production Capacity Analysis
All major manufacturers are assessed for existing installed capacity, planned additions, expansions, new plant announcements, and technology adoption — mapped at global, regional, and country levels.
Capacity Utilization Adjustment
Installed capacity is adjusted using utilization rates based on demand conditions, feedstock availability, plant operating rates, maintenance schedules, and regulatory restrictions.
Manufacturer Revenue Analysis
Product-specific revenues, segment-level performance, regional distribution, average selling prices, and margin trends are evaluated to establish market value estimates.
Supply-Side Assessment — Capacity vs. Effective Production by Region
Illustrative comparison of installed capacity vs. effective production volume (after utilization rate adjustment) across major regions

Phase 3 — Demand-Side Assessment: Quantifying Chemical Consumption
Demand-side analysis quantifies chemical consumption across industries, applications, and geographies — identifying where and how chemicals are consumed throughout the value chain with precision.
End-Use Industry Analysis
Chemical demand is evaluated across automotive, construction, packaging, electronics, agriculture, healthcare, consumer goods, industrial manufacturing, energy and utilities, and water treatment. Industry output, production trends, and consumption intensity are analyzed to determine demand patterns.
Consumption Modeling
Demand is estimated using measurable indicators: kilograms per vehicle, kilograms per square meter of construction, dosage per cubic meter of water treated, kilograms per hectare of agricultural land, and kilograms per ton of manufactured products. Consumption factors are validated through industry publications and primary interviews.
Application Analysis
The market is segmented by application area to understand product performance requirements, formulation trends, technology adoption, customer preferences, and regulatory requirements improving demand accuracy and segmentation granularity.
Demand-Side Assessment — End-Use Industry Demand Distribution
Illustrative distribution of chemical & materials demand across key end-use industries

Phase 4 - Trade Flow Analysis: Balancing Regional Supply and Demand
Trade flow analysis reconciles regional supply and demand estimates through import and export data, identifying net supply positions, regional dependencies, and market imbalances. It serves as an independent validation layer that tests the consistency of supply-side and demand-side estimates.
Import Analysis
Import data is evaluated to determine volumes, source countries, product dependency, regional supply gaps, and pricing trends — identifying markets that rely heavily on external supply and where domestic production is insufficient to meet demand.
Export Analysis
Export assessments reveal production surplus, export competitiveness, regional manufacturing strength, and global market participation. Export patterns also help validate domestic production estimates and identify net exporting regions.
Apparent Consumption Model
Regional consumption is assessed using the standard apparent consumption formula:
Results identify net importing regions, net exporting regions, regional deficits, and surpluses — serving as an independent validation of supply and demand estimates.
Trade Flow Analysis — Net Supply Position by Region
Illustrative apparent consumption vs. domestic production across major regions — positive gap indicates net import dependency

Phase 5 — Primary Research: The Critical Validation Layer
Primary research tests and refines findings from secondary research through direct engagement with industry participants across the supply chain, demand side, and expert community. It captures intelligence that no database or published report can provide — the real-world experience of manufacturers, buyers, and specialists operating in the market.

Supply-Side Interviews
Conversations with chemical manufacturers, raw material suppliers, contract manufacturers, technology providers, and plant operators cover production trends, capacity utilization, pricing developments, technology shifts, and competitive dynamics.

Demand-Side Interviews
Engagement with OEMs, industrial consumers, procurement managers, distributors, formulators, and end-use manufacturers focuses on consumption trends, purchasing behavior, product substitution, demand outlook, and emerging applications.

Industry Expert Consultations
Additional interviews with industry consultants, independent experts, regulatory specialists, technical professionals, and research institutions provide deeper market context and validate key analytical assumptions.
Focus Areas of Primary Research:
Market Size & Forecast Validation
Revenue estimates, volume consumption, growth rates, forecast assumptions, regional demand.Supply Chain & Value Chain Assessment
Raw material sourcing, supply chain challenges, distribution networks, procurement practices.Production & Capacity Analysis
Manufacturing capacity, utilization rates, expansion projects, plant investments.Pricing & Cost Structure Analysis
Product pricing trends, feedstock costs, energy costs, margin pressures, pricing outlook.Competitive Landscape Assessment
Volume and value estimates confirmed to be fully consistent with one another before publicationInterview Volume by Market Scope
| Study Scope | Number of Interviews |
|---|---|
| Niche Market | 20 – 30 |
| Mid-Sized Market | 30 – 50 |
| Global Market | 50 – 80 |
| Highly Fragmented Market | 80 – 120 |
Interview Details:
Category : Manufacturers, Suppliers, Distributors, End Users, Experts/Associations
Average Duration : 30–60 Minutes
Interview Mode : Video calls, telephonic interviews, expert consultations
Interview Format : Structured / Semi-Structured questionnaire
Focus Areas of Primary Research:
Market Size & Forecast Validation :
Revenue estimates, volume consumption, growth rates, forecast assumptions, regional demand.
Supply Chain & Value Chain Assessment :
Raw material sourcing, supply chain challenges, distribution networks, procurement practices.
Production & Capacity Analysis :
Manufacturing capacity, utilization rates, expansion projects, plant investments.
Pricing & Cost Structure Analysis :
Product pricing trends, feedstock costs, energy costs, margin pressures, pricing outlook.
Competitive Landscape Assessment :
Market share, competitor positioning, strategic initiatives, partnerships, acquisitions.
Primary Research — Stakeholder Coverage by Category
Distribution of interview respondents across stakeholder categories (% share from PPT data)

Primary Research — Respondent Designation Profile
Seniority breakdown of interview respondents (% share from PPT data)

Primary Research — Geographic Coverage of Interviews
Regional distribution of primary research engagement (% share from PPT data)

Phase 6 — Data Triangulation and Market Validation
No single methodology is relied upon in isolation. Multiple independent estimation approaches are combined and reconciled to ensure consistency, accuracy, and analytical defensibility. Any material deviations between approaches are investigated and adjusted through additional validation cycles.
The final market size is derived through weighted triangulation of all validated methodologies. Any material deviations between approaches are investigated and adjusted through additional validation cycles. The outcome represents the most realistic assessment of the market based on available evidence and expert confirmation ensuring that volume and value estimates are fully consistent with one another.
Triangulation Framework — Input Contribution Weight
Relative weight each sizing input contributes to the final reconciled market estimate

Phase 7 — Forecast Modeling: Projecting Future Market Evolution
Forecasting evaluates the future trajectory of the market using a combination of quantitative indicators and qualitative assessments across economic, industry, and regulatory dimensions. Rather than simple extrapolation, each driver is independently modeled and integrated into a composite forecast.
Macroeconomic Indicators
GDP growth, industrial production, manufacturing output, construction activity, consumer spending, and capital investment form the quantitative foundation of long-term demand projections. These are applied at country, regional, and global levels.
Industry Growth Drivers
Urbanization, infrastructure development, industrialization, technological innovation, sustainability initiatives, and evolving product performance requirements are assessed at regional and industry levels — capturing both structural and cyclical demand drivers.
Capacity Expansion Analysis
Announced plant expansions, new manufacturing facilities, technology upgrades, and strategic investments are evaluated to determine future supply-demand dynamics and potential market tightness or oversupply situations.
Regulatory & Sustainability
Environmental regulations, chemical safety standards, emission reduction targets, circular economy initiatives, and sustainability requirements are incorporated as they often influence product adoption rates and market growth trajectories.
Scenario Forecast Range — Indexed Market Growth (Year 1–10)
Illustrative indexed growth trajectories across Base, Optimistic, and Pessimistic scenarios over a 10-year forecast horizon

Forecast Drivers — Relative Impact Score by Category
Impact score (0–100) of each driver type on chemicals & materials market forecast




Comments
Share your thoughts, ask a question, or provide feedback about this report.