
Asia Pacific Polymers Market Size, Competitive Landscape Analysis Report 2035
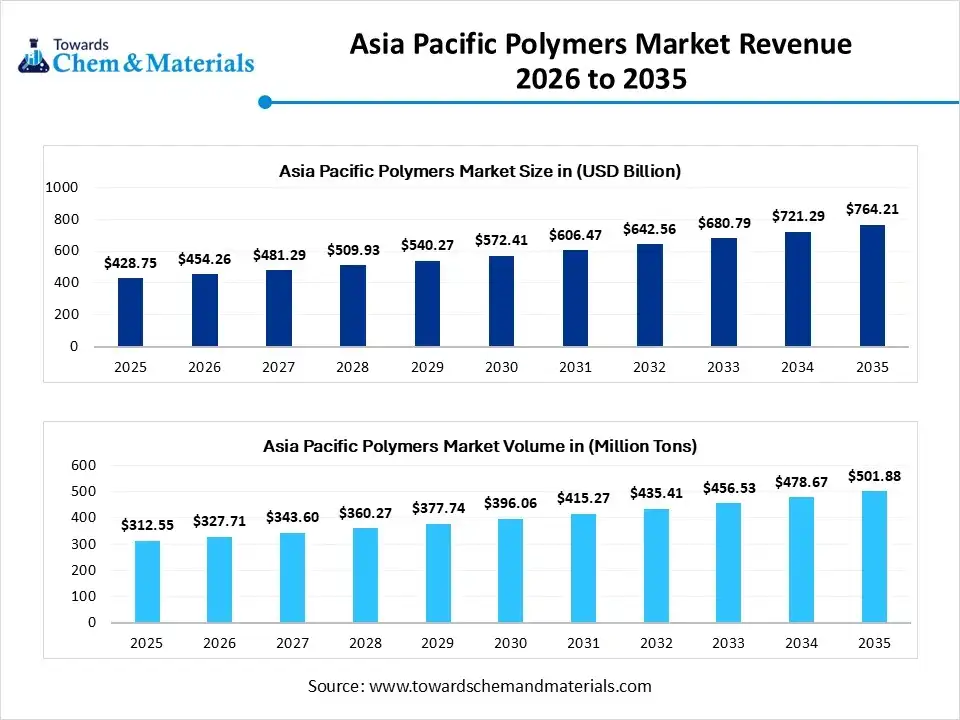
The Asia Pacific polymers market size was estimated at USD 428.75 billion in 2025 and is expected to be worth around USD 764.21 billion by 2035, growing at a CAGR of 5.95% from 2026 to 2035. In terms of volume, the Asia Pacific polymers industry is projected to grow from 312.55 million tons in 2025 to 501.88 million tons by 2035, exhibiting a compound annual growth rate (CAGR) of 4.85% over the forecast period from 2026 to 2035.Growing polymer demand from various sectors is the key factor driving market growth. Also, a surge in urbanization and economic development in the region, coupled with innovations in manufacturing technologies, can fuel market growth further.
Key Takeaways
- By region, East Asia dominated the market with a 45% share in 2025.
- By region, the Southeast Asia region is expected to grow at the fastest CAGR over the forecast period.
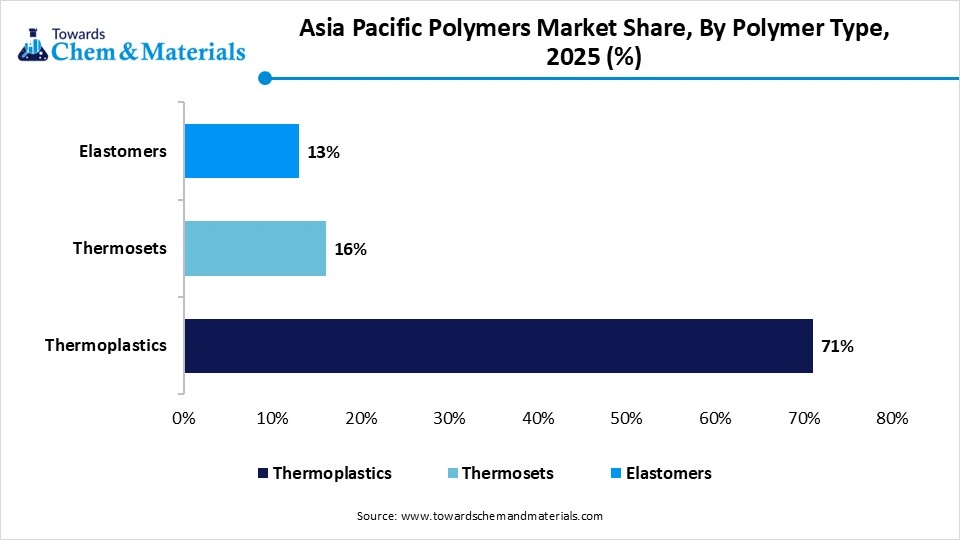
- By polymer type, the Thermoplastics segment dominated the market with a 71% share in 2025.
- By polymer type, the polylactic acid (PLA) segment is expected to grow at the fastest CAGR over the forecast period.
- By processing technology, the injection molding segment held a 33% market share in 2025.
- By processing technology, the additive manufacturing (3D Printing) segment is expected to grow at the fastest CAGR during the projected period.
- By end-use industry, the packaging segment dominated the market by holding a 36% share in 2025.
- By end-use industry, the healthcare & medical segment is expected to grow at the fastest CAGR during the study period.
Market Size and Volume Forecast
- Market Estimated Size (2025): USD 428.75 Billion | CAGR (2026–2035): 5.95%
- Market Projected Size (2035): USD 764.21 Billion
- Market Volume (2025): 312.55 Million Tons| Volume CAGR (2026–2035): 4.85%
- Market Projected Volume (2035): 501.88 Million Tons
- Pricing Data (2025):
- Average Manufacturing Price (2025): USD 1,750/Ton
- Average Selling Price (2025): USD 1,470/Ton
- Pricing CAGR (2026–2035): 3.65%
What is Polymer?
The increasing consumer demand for packaged products is the major factor fuelling market growth. The Asia Pacific polymers market encompasses synthetic and natural polymeric materials used across industries such as packaging, automotive, construction, electronics, and healthcare. Polymers are classified based on type, processing technology, and end-use, and are valued for their lightweight, durability, and versatile properties.
Asia Pacific Polymers Market Outlook:
- Industry Growth Overview: Between 2025-2034, the market is expected to witness substantial growth due to rapid advancements in polymer manufacturing, such as automation and precision that improve product quality and overall production efficiency. Also, the development of advanced and high-performance materials can propel market growth soon.
- Sustainability Trends: An ongoing surge in bio-based and biodegradable materials, fuelled by government mandates and environmental concerns, is the current sustainability trend in the market. The development of cutting-edge smart materials with improved performance and new functionalities is driving the adoption of sustainable production processes.
- Global Expansion: Major players in the region, such as Dow Inc. and LG Chem, are driving advancements and manufacturing in developing countries such as China and India, particularly in emulsion polymers. Countries such as China and India are providing a competitive advantage due to their robust manufacturing capabilities.
Key Technological Shifts in the Asia Pacific Polymers Market:
The market in the region is witnessing a major technological shift, boosted by a strong emphasis on sustainability and innovations in high-performance materials, with the integration of digital production techniques. Chemical recycling methods, like pyrolysis, are increasingly becoming popular as this technology breaks down plastics waste into raw oils and monomers.
Kaneka Corporation, BASF, and Dow Inc. are major players in the market, which produces high-performance and solvent-free sealants for the automotive and construction sectors. Sumitomo Chemical has recently obtained the certification for its sustainably produced acrylonitrile.
Report Scope
| Report Attributes | Details |
| Market Size in 2026 | USD 454.26 Billion |
| Expected Size by 2035 | USD 764.21 Billion |
| Growth Rate from 2025 to 2034 | CAGR 5.95% |
| Base Year of Estimation | 2025 |
| Forecast Period | 2025 - 2035 |
| Segment Covered | By Product Type / Chemical Class, By Feedstock / Raw Material, By Application / End-Use Industry |
| Key Companies Profiled | Corbion, Evonik Industries (U.S. operations), Genomatica, Inc., Novozymes, Inc., Solvay S.A. (U.S. operations), BioAmber (renewable succinic acid), Amyris, Inc., Green Biologics Ltd.LanzaTech (carbon-to-chemicals technology) |
Trade Analysis of the Asia Pacific Polymers Market: Import & Export Statistics
- China: In 2024, China was the largest producer and exporter of natural and modified natural polymers within the Asia Pacific, accounting for 93% of the region's exports in primary forms.
- Indonesia: Ranked as the second top buyer of Chinese PP in 2023, importing approximately 94,000 tons.
- Vietnam: Chinese PP imports saw a significant rebound in 2023, reaching 205,000 tons, following a decline in 2022.
Value Chain Analysis of the Asia Pacific Polymers Market
- Feedstock Procurement : It is the process of acquiring the raw materials required to produce polymers. This includes sourcing fossil-fuel-based materials.
- Chemical Synthesis and Processing : It refers to the entire lifecycle of producing polymers, from creating the chemical building blocks to converting them into a finished product.
- Packaging and Labelling : In this stage, various polymer resins are utilized to manufacture both flexible and rigid packaging materials and labels for different industries.
- Regulatory Compliance and Safety Monitoring : It involves adherence to a detailed set of national and international regulations focusing on ensuring overall product quality and worker safety.
Asia Pacific Polymers Market 's Regulatory Landscape: Global Regulations
| Country/Region | Key Regulations and Trade Statistics |
| China | In 2024, China was the largest producer and exporter of natural and modified natural polymers within the Asia Pacific, accounting for 93% of the region's exports in primary forms. |
| India | India meets a significant portion of its domestic polymer demand through imports, estimated at 3.93 million tonnes in 2022–2023, and projected at 3.28 million tonnes for 2023–2024. |
| Japan | In 2024, Japan was the main regional importer of natural and modified natural polymers, with 38,000 tons, accounting for 34% of total imports. |
Market Opportunity
The Growing Emphasis on New Product Launches
The increasing focus on innovative product launches is a major factor creating lucrative opportunities in the market. It is necessary for businesses to focus on this area to stay updated and innovative with the latest market trends. Furthermore, one crucial trend in the market is the development of high-grade biodegradable polymers that give better properties like oxygen permeability and impact strength.
Market Challenge
Inconsistent Waste Management
Many emerging economies in the region lack the strong infrastructure for effective waste management, like kerbside collection systems, which is a major factor hindering market expansion. Moreover, trade restrictions due to geopolitical tensions can fluctuate the supply chains for raw materials and the resulting material, which can affect the overall production costs in the APAC.
Segmental Insights
Polymer Type Insight
How Much Share Did the Polyethylene (PE) Segment Held in 2025?
The Thermoplastics segment dominated the market with a 71%share in 2025. It is a subsegment of thermoplastic polymers. The dominance of the segment can be attributed to the rapid industrialization and urbanization in the emerging economies such as China and India. Additionally, advancements in polymer manufacturing technology, along with the surge in development of PE types, are further boosting segment growth.
The polylactic acid (PLA) segment is expected to grow at the fastest CAGR over the forecast period. It is also another subsegment of thermoplastic polymers. The growth of the segment can be credited to the growing consumer demand for sustainable products, coupled with the rising need for bioplastics in sectors such as textiles and automotive. In addition, PLA is increasingly becoming price-competitive compared to some conventional plastics.
Asia Pacific Polymers Market Share, By Polymer Type, 2025 (%)
| By Polymer Type | Revenue Share, 2025 (%) |
| Thermoplastics | 71% |
| Thermosets | 16% |
| Elastomers | 13% |
- Thermoplastics hold a dominant revenue share of 71% because their ability to be melted and reshaped makes them ideal for high-speed mass production. This segment leads the market due to massive demand for polyethylene and polypropylene in the region's expanding packaging, automotive, and consumer electronics sectors.
- Thermosets account for a revenue share of 16% as they provide the structural integrity and heat resistance necessary for heavy-duty industrial applications. Their significant presence is driven by the Asia Pacific construction and aerospace industries which require materials that do not soften or deform under extreme thermal stress.
- Elastomers represent a revenue share of 13% due to their specialized role in providing flexibility and impact resistance for technical components. This share is sustained by the region's massive tire manufacturing industry and the increasing need for medical-grade rubber and flexible seals in modern infrastructure.
Processing Technology Insight
Which Processing Technology Type Segment Dominated the Asia Pacific Polymers Market in 2025?
The injection molding segment held a 32% market share in 2025. The dominance of the segment can be linked to the growing product demand from the electronics, automotive, and packaging sectors, driven by strong manufacturing bases, especially in the developing nations. Furthermore, Injection molding is a crucial process for manufacturing components such as syringes and IV components.
The additive manufacturing (3D Printing) segment is expected to grow at the fastest CAGR during the projected period. The growth of the segment can be driven by the growing need for customized products and ongoing innovations in 3D printing technology. Moreover, the inherent advantages of 3D printing, like lower labour costs and reduced material waste in the production process, contribute to its increasing adoption.
Asia Pacific Polymers Market Share, By Processing Technology, 2025 (%)
| By Processing Technology | Revenue Share, 2025 (%) |
| Injection Molding | 33% |
| Blow Molding | 15% |
| Extrusion | 24% |
| Thermoforming | 8% |
| Compression Molding | 7% |
| Rotational Molding | 4% |
| Additive Manufacturing (3D Printing) | 9% |
- Injection Molding commands a leading revenue share of 33% because it is the most efficient method for producing complex parts in high volumes with high precision. This technology dominates the market due to the massive output of automotive components and consumer electronic housings across the Asia Pacific region.
- Extrusion accounts for a significant revenue share of 24% as it is the primary method for manufacturing continuous profiles like pipes, tubing, and structural films. Its substantial market presence is driven by the rapid expansion of infrastructure and construction projects that require high-volume plastic profiles.
- Blow Molding holds a revenue share of 15% due to its specialized role in creating hollow plastic containers and bottles for the beverage and pharmaceutical industries. This segment remains a major contributor because of the rising demand for lightweight and durable liquid packaging solutions in emerging economies.
End-Use Industry Insight
Which End-Use Industry Segment Dominated the Asia Pacific Polymers Market in 2025?
The packaging segment dominated the market by holding a 35% share in 2025. The dominance of the segment is owed to the growing demand for durable, lightweight, and flexible packaging solutions in the personal care, pharmaceutical, and food & beverage industries. Also, polymer packaging has benefited from innovative additives that provide enhanced oxygen barriers, UV resistance, and other properties that safeguard products from degradation.
The healthcare & medical segment is expected to grow at the fastest CAGR during the study period. The growth of the segment is due to growing demand for innovative medical devices along with the surging healthcare infrastructure in the major countries. Some nations in the Asia Pacific region are also developing into medical tourism hubs, which increases the need for advanced healthcare procedures, leading to segment growth soon.
Europe Ceramic Tiles Market Share, By End-Use Industry 2025 (%)
| By End-Use Industry | Revenue Share, 2025 (%) |
| Packaging | 36% |
| Automotive | 18% |
| Construction | 20% |
| Electronics & Electricals | 14% |
| Healthcare & Medical | 6% |
| Textiles & Coatings | 6% |
- Packaging leads the market with a revenue share of 36% because specialized ceramic coatings and containers are increasingly used to provide superior chemical resistance and aesthetic appeal. This segment dominates as European brands shift toward premium, sustainable materials that offer better barrier properties than traditional plastics or glass.
- Construction accounts for a revenue share of 20% as ceramic tiles remain the primary choice for durable flooring and wall cladding in both residential and commercial projects. This share is sustained by Europe's high standards for energy efficiency and the rising trend of using large-format porcelain slabs in modern architectural designs.
- Automotive represents a revenue share of 18% because high-performance ceramic components are essential for the thermal management and braking systems of electric and luxury vehicles. The region's strong automotive manufacturing base drives this share as engineers seek materials that can withstand extreme heat and friction without degrading.
- Electronics & Electricals hold a revenue share of 14% due to the critical role of ceramics as insulators and substrates in high-frequency circuit boards and power modules. This segment is supported by the European push for domestic semiconductor production and the increasing complexity of smart home and industrial automation devices.
By Thickness / Technical Grade
The European ceramic tiles market demonstrates a notable distribution based on thickness and technical grade, with a dominant preference for standard thickness tiles (6–10 mm), which make up a significant 64% of the market share. This segment is favored for its versatility and cost-effectiveness, making it the preferred choice for a wide range of residential, commercial, and industrial applications. Standard ceramic tiles are popular due to their balance of durability and affordability, suitable for most floor and wall coverings. The thick ceramic tiles, ranging from >10–20 mm, hold a smaller but still substantial share of the market at 22%. These thicker tiles are often used in high-demand areas such as heavy traffic zones, outdoor applications, or settings that require extra durability, offering superior resistance to wear and tear.
The remaining portion of the market is composed of thinner tiles, as well as specialty grades for specific applications, but the focus largely remains on the standard and thick segments due to their practical benefits. The demand for these ceramic tiles is driven by ongoing construction activities, renovation projects, and evolving design trends in residential and commercial buildings. The market share distribution highlights consumer preference towards versatility and long-lasting products, with a clear inclination towards materials that combine aesthetic appeal with functional advantages. As we move forward, the ceramic tiles market is expected to continue evolving, with these two segments maintaining their lead in terms of revenue contribution.
Europe Ceramic Tiles Market Share, By Thickness / Technical Grade, 2025 (%)
| By Thickness / Technical Grade | Revenue Share, 2025 (%) |
| Standard (6–10 mm) | 64% |
| Thick (>10–20 mm) | 22% |
| Thin gauged porcelain panels (3–6 mm) | 14% |
- Standard tiles hold a dominant revenue share of 64% because they provide the ideal balance of durability and cost for everyday residential and commercial flooring. This segment leads the market as the go-to choice for traditional indoor installations due to its proven performance and ease of handling.
- Thick tiles account for a revenue share of 22% as the rising demand for outdoor paving and high-traffic public areas requires superior load-bearing strength. This share is supported by the European trend for porcelain pavers that can be installed without adhesives on gravel or grass.
- Thin gauged porcelain panels represent a revenue share of 14% because their lightweight nature allows for seamless large-format wall cladding and efficient renovations. This segment is growing as architects seek sustainable options that offer a modern aesthetic with minimal material waste.
By Application
the European ceramic tiles market exhibits a dominant preference for floor tiles (interior), capturing 34% of the revenue share, followed by wall tiles (interior), which account for 24%. The strong performance of floor tiles can be attributed to their essential role in interior design, offering both aesthetic appeal and practical durability. Floor tiles, particularly in high-traffic areas such as living rooms, kitchens, and commercial spaces, are sought after for their ability to withstand wear and tear while maintaining a polished appearance. These tiles not only enhance the visual appeal of any room but also provide long-lasting functionality, which is essential for homeowners and businesses alike. The versatility of floor tiles, available in various finishes, sizes, and designs, contributes significantly to their market dominance, as they cater to both modern and traditional interior styles.
Wall tiles, while slightly less prominent in terms of market share, continue to play a crucial role in interior design, holding 24% of the market. They are primarily used in spaces such as bathrooms, kitchens, and other wet areas, where moisture resistance and easy maintenance are key. The growing trend toward stylish and functional wall coverings, coupled with the increasing popularity of decorative tile designs, solidifies the importance of wall tiles in the European ceramic tile market. Together, these two segments form the backbone of the ceramic tiles industry in Europe, with both providing the perfect combination of beauty, practicality, and longevity, making them indispensable in residential and commercial interior applications.
Europe Ceramic Tiles Market Share, By Application, 2025 (%)
| By Application | Revenue Share, 2025 (%) |
| Floor tiles (interior) | 34% |
| Wall tiles (interior) | 24% |
| Exterior paving & façade panels | 15% |
| Wet areas (bathrooms, pools) | 11% |
| Kitchen worktops & countertops | 8% |
| Industrial / chemical-resistant flooring | 8% |
- Interior floor tiles hold a dominant revenue share of 34% because they are the primary surfacing material used in nearly every residential and commercial construction project. This segment leads due to the high volume of material required to cover large surface areas in European housing and retail developments.
- Interior wall tiles account for a revenue share of 24% as they are essential for decorative and protective surfaces in both kitchens and living spaces. Their significant share is driven by the European preference for easy-to-clean and aesthetically versatile ceramic coverings for vertical surfaces.
- Exterior paving and façade panels represent a revenue share of 15% because of the growing architectural trend toward ventilated facades and durable outdoor living spaces. This segment is supported by the need for frost-resistant and UV-stable materials that can withstand Europe’s diverse climate conditions.
- Wet areas like bathrooms and pools maintain a revenue share of 11% due to the mandatory requirement for slip-resistant and waterproof surfaces in moisture-heavy environments. This share is sustained by constant renovation cycles in the hospitality sector and strict safety regulations for public swimming facilities.
- Kitchen worktops and countertops hold a revenue share of 8% as large-format porcelain slabs become a popular, heat-resistant alternative to natural stone and quartz. This growing segment reflects the shift toward high-performance ceramic surfaces that offer superior scratch resistance in modern European kitchen designs.
- Industrial and chemical-resistant flooring accounts for a revenue share of 8% because specialized heavy-duty tiles are required for food processing plants and laboratories. This segment remains a vital niche where high mechanical strength and resistance to corrosive substances are non-negotiable for safety and longevity.
By End-User / Sector
In 2025, the European ceramic tiles market is predominantly driven by the residential sector, which captures 44% of the revenue share. This reflects the growing demand for durable, aesthetically pleasing, and easy-to-maintain flooring solutions in homes. Ceramic tiles, with their variety of styles and finishes, are a top choice for interior spaces such as kitchens, bathrooms, and living rooms, where they provide both functionality and design flexibility. The commercial sector follows with a 22% share, driven by the need for cost-effective and resilient flooring in offices, retail spaces, and other business environments. These tiles offer long-lasting durability and easy maintenance, making them ideal for high-traffic areas.
The hospitality sector, contributing 10%, also relies on ceramic tiles for their visual appeal and practicality in hotels, restaurants, and resorts. Similarly, the institutional sector (8%) and infrastructure/public works (10%) benefit from ceramic tiles' resilience in public spaces and educational facilities. The industrial facilities sector, contributing 6%, requires ceramic tiles for their toughness and longevity in environments like warehouses and factories. This diverse end-user distribution highlights the widespread importance of ceramic tiles across multiple sectors, making them a preferred choice for both residential and commercial applications due to their versatility, durability, and aesthetic value.
Europe Ceramic Tiles Market Share, By End-User / Sector, 2025 (%)
| By End-User / Sector | Revenue Share, 2025 (%) |
| Residential | 44% |
| Commercial | 22% |
| Hospitality | 10% |
| Institutional | 8% |
| Infrastructure / public works | 10% |
| Industrial facilities | 6% |
- The residential sector holds a dominant revenue share of 44% because of the constant demand for home renovations and new housing projects across the European region. This segment leads the market as homeowners increasingly choose durable and stylish ceramic tiles for long-term interior and exterior surfacing.
- The commercial sector accounts for a revenue share of 22% as the growth of retail spaces and modern office buildings requires high-traffic flooring solutions. This share is driven by the need for low-maintenance materials that can withstand heavy footfall while maintaining a professional aesthetic.
- Infrastructure and public works represent a revenue share of 10% due to the rising investment in transit hubs and urban revitalization projects. This segment is supported by the requirement for extremely durable, slip-resistant tiles for airports, railway stations, and city plazas.
- The hospitality sector maintains a revenue share of 10% because hotels and resorts frequently upgrade their interiors to meet luxury standards and guest expectations. This share remains significant as premium ceramic surfaces are essential for high-end bathrooms, lobbies, and pool areas.
- The institutional sector holds a revenue share of 8% as schools, hospitals, and government buildings require hygienic and fire-resistant surfacing materials. This segment is sustained by strict European safety regulations that mandate easy-to-sanitize and non-combustible flooring in public facilities.
- Industrial facilities account for a revenue share of 6% as specialized heavy-duty tiles are necessary for manufacturing plants that handle chemicals or heavy machinery. This niche share is critical for environments where high mechanical strength and chemical resistance are mandatory for operational safety.
Regional Insights
East Asia dominated the market with a 45% share in 2025.
The dominance of the segment can be attributed to the growing polymer demand from booming construction, packaging, and automotive sectors, coupled with the several government initiatives supporting sustainable polymer solutions. In addition, the region's strong infrastructure and skilled labor make it a hub for polymer production and supply chains.
China Asia Pacific Polymers Market Trends
In the Asia Pacific, China dominated the market owing to the robust government support and ongoing push toward sustainability. China is a major hub for electronics production, which fuels significant demand for high-performance and specialty plastics. Also, the Chinese government heavily invested in petrochemical manufacturing facilities to ensure a stable supply of raw materials.
The Southeast Asia region is expected to grow at the fastest CAGR over the forecast period.
The growth of the region can be credited to the growing consumer awareness of environmental concerns, which drives the demand for eco-friendly and sustainable options. Furthermore, consumers in this region are rapidly preferring green products, optimising the development of biodegradable polymers and other alternatives.
India Asia Pacific Polymers Market Trends
In the Asia Pacific, India is witnessing the fastest growth during the forecast period, due to innovations in polymer technology, such as the development of bioplastics and a surge in vehicle manufacturing and production in the country. Growing consumer awareness regarding environmental issues is also creating demand for green alternatives like bio-based polymers.
Country-level Investments & Funding Trends for the Asia Pacific Polymers Market:
- China: Investments are increasing in bio-based and circular polymers. For instance, in August 2025, IKEA's investment arm backed Chinese recycling firm Re-mall, which recycles polypropylene.
- India: In 2025, venture capital funds invested $6.6 million in South Asian polymers, including Indian-based firms focused on biomaterials.
- Japan and South Korea: Companies like Japan's Nippon Shokubai are investing in biomass-derived superabsorbent polymers, aligning with carbon-neutrality goals.
Recent Development
- In June 2025, Covestro unveiled localized manufacturing of medical-grade Thermoplastic Polyurethane TPU in the Asia Pacific. It is Covestro's second facility across the globe, qualified to manufacture high-grade materials in the region, enabling more efficient and flexible regional supply to fulfil growing demand.(Source: www.covestro.com)
Top Vendors in Asia Pacific Polymers Market & Their Offerings:
- LyondellBasell Industries: LyondellBasell is a major producer of polymers in the Asia Pacific (APAC) market, with a significant presence across China, Malaysia, South Korea, and Thailand.
- SABIC: SABIC is a major player in the Asia Pacific (APAC) polymers market, with an extensive network of manufacturing sites, technology centers, and sales offices across the region.
- LG Chem: LG Chem is a leading and major player in the Asia-Pacific polymers market, leveraging its strong petrochemical foundation to expand into high-value and sustainable materials.
Other Players
- Formosa Plastics
- Sinopec
- Reliance Industries
- Mitsui Chemicals
- Sumitomo Chemical
- Dow Inc.
- ExxonMobil Chemical
- Braskem
- Idemitsu Kosan
- Covestro
- INEOS
- Toray Industries
- Ube Industries
- China National Chemical Corp (ChemChina)
- Asahi Kasei
- Hengli Group
- Wanhua Chemical
Segment Covered
By Polymer Type
- Thermoplastics
- Polyethylene (LDPE, HDPE, LLDPE)
- Polypropylene (Homopolymer, Copolymer)
- Polyvinyl Chloride (Rigid, Flexible)
- Polystyrene (GPPS, HIPS)
- Polyethylene Terephthalate (Crystalline, Amorphous)
- Acrylonitrile Butadiene Styrene (ABS)
- Polycarbonate (PC)
- Polyamide (PA6, PA66)
- Polyoxymethylene (POM)
- Polybutylene Terephthalate (PBT)
- Polyurethane (TPU, Thermoset PU)
- Polylactic Acid (PLA)
- Thermosets
- Epoxy Resins
- Phenolic Resins
- Unsaturated Polyester Resins (UPR)
- Melamine Formaldehyde
- Urea Formaldehyde
- Elastomers
- Styrene-Butadiene Rubber (SBR)
- Ethylene Propylene Diene Monomer (EPDM)
- Nitrile Rubber (NBR)
- Silicone Rubber
- Thermoplastic Elastomers (SBC, TPV, TPO, TPU)
By Processing Technology
- Injection Molding
- Blow Molding
- Extrusion
- Thermoforming
- Compression Molding
- Rotational Molding
- Additive Manufacturing (3D Printing)
By End-Use Industry
- Packaging
- Flexible Packaging (Films, Pouches, Laminates)
- Rigid Packaging (Bottles, Containers, Trays)
- Automotive
- Interior Components (Dashboard, Seats, Panels)
- Exterior Components (Bumpers, Fenders, Doors)
- Under-the-Hood Components (Engine Covers, Air Intake, Fuel Tanks)
- Construction
- Residential (Single/Multi-Family Homes, Apartments)
- Commercial (Office Buildings, Hotels, Warehouses)
- Industrial (Factories, Refineries, Power Plants)
- Electronics & Electricals
- Consumer Electronics
- Industrial Electronics
- Electrical Insulation Materials
- Healthcare & Medical
- Medical Devices
- Packaging for Pharma
- Disposable Consumables
- Textiles & Coatings
- Synthetic Fibers
- Performance Coatings
A Seven-Phase Framework
Our methodology is designed to be universally applicable across commodity chemicals, specialty chemicals, petrochemicals, construction chemicals, coatings, electronic chemicals, industrial gases, agrochemicals, water treatment chemicals, and performance materials. Each phase builds upon the last, creating a layered validation structure that minimizes estimation error and maximizes analytical confidence.
The framework ensures comprehensive market coverage, robust cross-validation, and reliable long-term forecasting — producing market estimates that withstand scrutiny from investors, regulators, and corporate strategy teams.

Seven-Phase Framework — Analytical Effort Distribution
Relative analytical effort allocated across each phase of the Chemicals & Materials research framework

Phase 1 - Secondary Research: Establishing the Foundation
Secondary research collects and evaluates publicly available information from authoritative sources, establishing the foundational understanding of market structure, value chain dynamics, competitive landscape, and end-use demand patterns. Every source is evaluated for credibility, recency, geographic relevance, and methodological soundness before inclusion.
Industry Associations
Sources include ACC, CEFIC, ICCA, JCIA, CPCIF, and SOCMA providing production volumes, consumption trends, capacity developments, and sustainability initiatives.
Company Disclosures
Annual reports, investor presentations, earnings transcripts, and regulatory filings reveal product portfolios, manufacturing footprints, capacity expansions, and revenue segmentation.
Government Databases
National statistical offices, customs authorities, environmental agencies, and industrial production databases provide verified statistics on output, trade flows, and regulatory compliance.
Trade Databases
UN Comtrade, ITC, Eurostat, and national customs authorities enable assessment of global product movement, import dependency, and export competitiveness across regions.
Our Secondary Research Sources
- Ministry of Chemicals and Fertilizers
- European Chemicals Agency
- United States Department of Energy
- Ministry of Industry and Information Technology
- Ministry of Economy Trade and Industry
- Ministry of Trade Industry and Energy
- National Institute of Standards and Technology
- Council of Scientific and Industrial Research
- Fraunhofer Society
- National Institute for Materials Science
Phase 2 — Supply-Side Assessment: Mapping Production Capabilities
Production Capacity Analysis
All major manufacturers are assessed for existing installed capacity, planned additions, expansions, new plant announcements, and technology adoption — mapped at global, regional, and country levels.
Capacity Utilization Adjustment
Installed capacity is adjusted using utilization rates based on demand conditions, feedstock availability, plant operating rates, maintenance schedules, and regulatory restrictions.
Manufacturer Revenue Analysis
Product-specific revenues, segment-level performance, regional distribution, average selling prices, and margin trends are evaluated to establish market value estimates.
Supply-Side Assessment — Capacity vs. Effective Production by Region
Illustrative comparison of installed capacity vs. effective production volume (after utilization rate adjustment) across major regions

Phase 3 — Demand-Side Assessment: Quantifying Chemical Consumption
Demand-side analysis quantifies chemical consumption across industries, applications, and geographies — identifying where and how chemicals are consumed throughout the value chain with precision.
End-Use Industry Analysis
Chemical demand is evaluated across automotive, construction, packaging, electronics, agriculture, healthcare, consumer goods, industrial manufacturing, energy and utilities, and water treatment. Industry output, production trends, and consumption intensity are analyzed to determine demand patterns.
Consumption Modeling
Demand is estimated using measurable indicators: kilograms per vehicle, kilograms per square meter of construction, dosage per cubic meter of water treated, kilograms per hectare of agricultural land, and kilograms per ton of manufactured products. Consumption factors are validated through industry publications and primary interviews.
Application Analysis
The market is segmented by application area to understand product performance requirements, formulation trends, technology adoption, customer preferences, and regulatory requirements improving demand accuracy and segmentation granularity.
Demand-Side Assessment — End-Use Industry Demand Distribution
Illustrative distribution of chemical & materials demand across key end-use industries

Phase 4 - Trade Flow Analysis: Balancing Regional Supply and Demand
Trade flow analysis reconciles regional supply and demand estimates through import and export data, identifying net supply positions, regional dependencies, and market imbalances. It serves as an independent validation layer that tests the consistency of supply-side and demand-side estimates.
Import Analysis
Import data is evaluated to determine volumes, source countries, product dependency, regional supply gaps, and pricing trends — identifying markets that rely heavily on external supply and where domestic production is insufficient to meet demand.
Export Analysis
Export assessments reveal production surplus, export competitiveness, regional manufacturing strength, and global market participation. Export patterns also help validate domestic production estimates and identify net exporting regions.
Apparent Consumption Model
Regional consumption is assessed using the standard apparent consumption formula:
Results identify net importing regions, net exporting regions, regional deficits, and surpluses — serving as an independent validation of supply and demand estimates.
Trade Flow Analysis — Net Supply Position by Region
Illustrative apparent consumption vs. domestic production across major regions — positive gap indicates net import dependency

Phase 5 — Primary Research: The Critical Validation Layer
Primary research tests and refines findings from secondary research through direct engagement with industry participants across the supply chain, demand side, and expert community. It captures intelligence that no database or published report can provide — the real-world experience of manufacturers, buyers, and specialists operating in the market.

Supply-Side Interviews
Conversations with chemical manufacturers, raw material suppliers, contract manufacturers, technology providers, and plant operators cover production trends, capacity utilization, pricing developments, technology shifts, and competitive dynamics.

Demand-Side Interviews
Engagement with OEMs, industrial consumers, procurement managers, distributors, formulators, and end-use manufacturers focuses on consumption trends, purchasing behavior, product substitution, demand outlook, and emerging applications.

Industry Expert Consultations
Additional interviews with industry consultants, independent experts, regulatory specialists, technical professionals, and research institutions provide deeper market context and validate key analytical assumptions.
Focus Areas of Primary Research:
Market Size & Forecast Validation
Revenue estimates, volume consumption, growth rates, forecast assumptions, regional demand.Supply Chain & Value Chain Assessment
Raw material sourcing, supply chain challenges, distribution networks, procurement practices.Production & Capacity Analysis
Manufacturing capacity, utilization rates, expansion projects, plant investments.Pricing & Cost Structure Analysis
Product pricing trends, feedstock costs, energy costs, margin pressures, pricing outlook.Competitive Landscape Assessment
Volume and value estimates confirmed to be fully consistent with one another before publicationInterview Volume by Market Scope
| Study Scope | Number of Interviews |
|---|---|
| Niche Market | 20 – 30 |
| Mid-Sized Market | 30 – 50 |
| Global Market | 50 – 80 |
| Highly Fragmented Market | 80 – 120 |
Interview Details:
Category : Manufacturers, Suppliers, Distributors, End Users, Experts/Associations
Average Duration : 30–60 Minutes
Interview Mode : Video calls, telephonic interviews, expert consultations
Interview Format : Structured / Semi-Structured questionnaire
Focus Areas of Primary Research:
Market Size & Forecast Validation :
Revenue estimates, volume consumption, growth rates, forecast assumptions, regional demand.
Supply Chain & Value Chain Assessment :
Raw material sourcing, supply chain challenges, distribution networks, procurement practices.
Production & Capacity Analysis :
Manufacturing capacity, utilization rates, expansion projects, plant investments.
Pricing & Cost Structure Analysis :
Product pricing trends, feedstock costs, energy costs, margin pressures, pricing outlook.
Competitive Landscape Assessment :
Market share, competitor positioning, strategic initiatives, partnerships, acquisitions.
Primary Research — Stakeholder Coverage by Category
Distribution of interview respondents across stakeholder categories (% share from PPT data)

Primary Research — Respondent Designation Profile
Seniority breakdown of interview respondents (% share from PPT data)

Primary Research — Geographic Coverage of Interviews
Regional distribution of primary research engagement (% share from PPT data)

Phase 6 — Data Triangulation and Market Validation
No single methodology is relied upon in isolation. Multiple independent estimation approaches are combined and reconciled to ensure consistency, accuracy, and analytical defensibility. Any material deviations between approaches are investigated and adjusted through additional validation cycles.
The final market size is derived through weighted triangulation of all validated methodologies. Any material deviations between approaches are investigated and adjusted through additional validation cycles. The outcome represents the most realistic assessment of the market based on available evidence and expert confirmation ensuring that volume and value estimates are fully consistent with one another.
Triangulation Framework — Input Contribution Weight
Relative weight each sizing input contributes to the final reconciled market estimate

Phase 7 — Forecast Modeling: Projecting Future Market Evolution
Forecasting evaluates the future trajectory of the market using a combination of quantitative indicators and qualitative assessments across economic, industry, and regulatory dimensions. Rather than simple extrapolation, each driver is independently modeled and integrated into a composite forecast.
Macroeconomic Indicators
GDP growth, industrial production, manufacturing output, construction activity, consumer spending, and capital investment form the quantitative foundation of long-term demand projections. These are applied at country, regional, and global levels.
Industry Growth Drivers
Urbanization, infrastructure development, industrialization, technological innovation, sustainability initiatives, and evolving product performance requirements are assessed at regional and industry levels — capturing both structural and cyclical demand drivers.
Capacity Expansion Analysis
Announced plant expansions, new manufacturing facilities, technology upgrades, and strategic investments are evaluated to determine future supply-demand dynamics and potential market tightness or oversupply situations.
Regulatory & Sustainability
Environmental regulations, chemical safety standards, emission reduction targets, circular economy initiatives, and sustainability requirements are incorporated as they often influence product adoption rates and market growth trajectories.
Scenario Forecast Range — Indexed Market Growth (Year 1–10)
Illustrative indexed growth trajectories across Base, Optimistic, and Pessimistic scenarios over a 10-year forecast horizon

Forecast Drivers — Relative Impact Score by Category
Impact score (0–100) of each driver type on chemicals & materials market forecast




Comments
Share your thoughts, ask a question, or provide feedback about this report.