
Refractory Material Market Size and Forecast 2026 to 2035
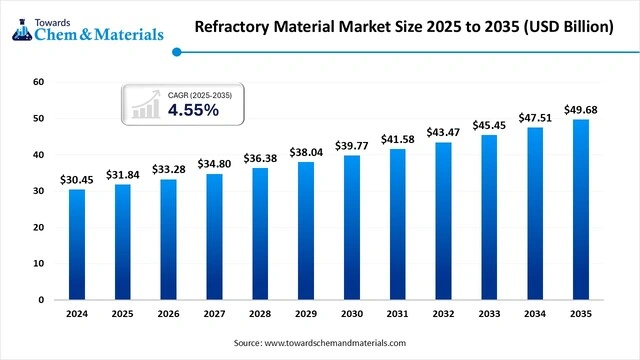
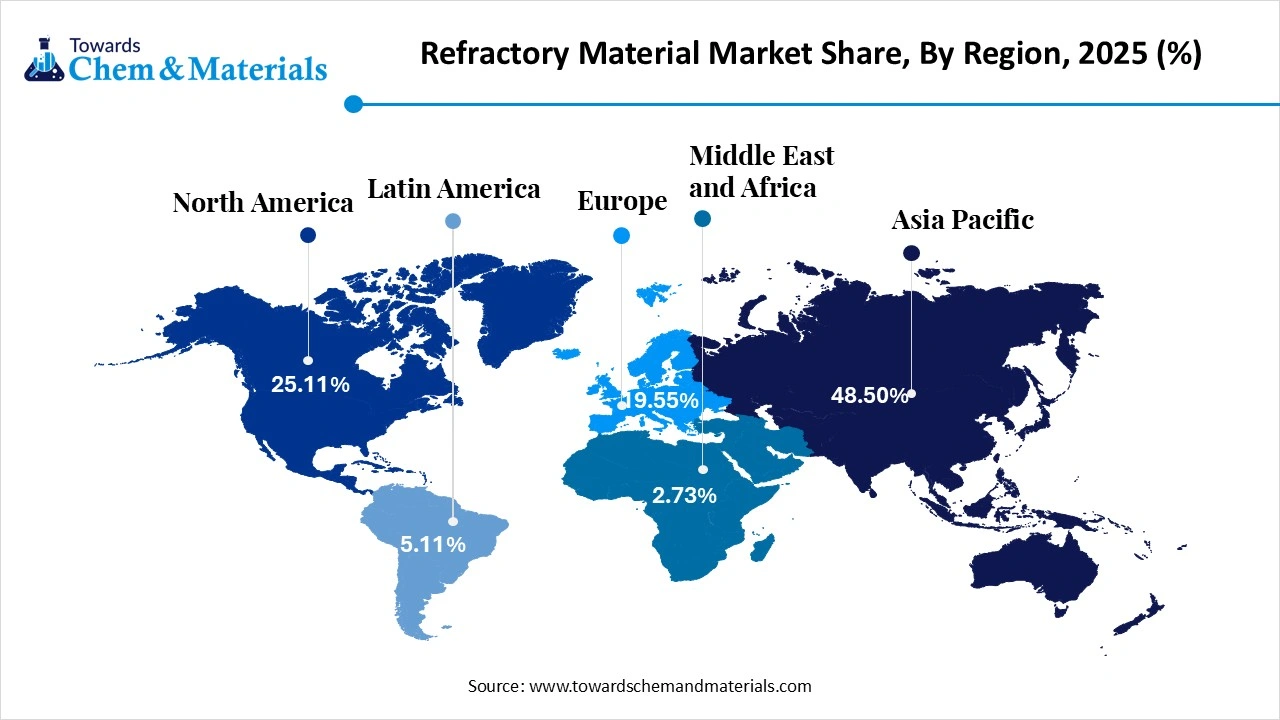
The global refractory material market size is calculated at USD 31.84 billion in 2025 and is predicted to increase from USD 33.28 billion in 2026 and is projected to reach around USD 49.68 billion by 2035, The market is expanding at a CAGR of 4.55% between 2026 and 2035. Asia Pacific dominated the refractory material market with a market share of 48.50% the global market in 2025. The global adoption of sustainable manufacturing practices has accelerated the industry's growth in recent years.
Key Takeaways
- The global refractory material market was valued at USD 31.84 billion in 2025.
- The is estimated to reach around USD 33.28 billion in 2026.
- The market is projected to grow to approximately USD 49.68 billion by 2035.
- This reflects a compound annual growth rate (CAGR) of about 4.55% during 2026-2035.
- Key refractory material top Company RHI Magnesita (Austria), Vesuvius (UK), Krosaki HarimaCorporation (Japan),Imerys (France), Shinagawa Refractories Co., Ltd. (Japan), Saint-Gobain (France), Calderys (France)
- North America dominated the refractory material industry, accounting for the largest revenue share of 48.50% in 2025.
- By form, the shaped refractories segment led the market and accounted for 64.50% of the global revenue share in 2025.
- By material type, the alumina refractories segment accounted for the largest revenue share of 32.40% in 2025.
- By end use, the iron and steel segment dominated with the largest revenue share of 34.40% in 2025.
- By manufacturing process, the dry press process segment dominated the market and accounted for the largest revenue share of 45.60% in 2025.
- By end-use industry, the construction segment accounted for the largest market revenue share of 48.50% in 2025.
High Temperature Heroes: Refractories Drive Modern Industrial Growth
Refractory materials are heat-resistant substances designed to maintain strength and chemical stability at high temperatures. They are primarily used to line furnaces, kilns, incinerators, and reactors in industries such as iron and steel, cement, glass, and non-ferrous metals. These materials allow industrial equipment to operate under extreme thermal conditions without losing structural integrity or reacting with molten substances.
Refractories can withstand corrosion, thermal shock, and mechanical wear. Their durability makes them essential for processes that involve rapid temperature changes, abrasive particles, or chemically aggressive environments. Industries depend on these materials to ensure safe operations, reduce downtime, and maintain consistent production output.
The market is driven by increasing steel and cement production, industrialization in emerging economies, and innovations in monolithic and eco-friendly refractory solutions for extended lifecycle performance. As countries expand infrastructure and manufacturing capacity, demand for reliable high-temperature materials continues to rise. New formulations that improve energy efficiency, reduce emissions, and extend service life are also contributing to the overall market growth.
The Current Trends in the Refractory Material Market?
- Industry Growth Overview: Between 2025 and 2035, the refractory material market is expected to expand steadily due to rising demand for heatproof components used in steelmaking, glass production, cement kilns and other high-temperature industrial systems. The global push toward clean energy facilities, including waste-to-energy plants, hydrogen units and advanced battery manufacturing, is also creating fresh opportunities for refractory suppliers. At the same time, recyclers and manufacturers are reporting increased demand for cutting tools, spent refractory recovery and high-end lining materials that support longer operational lifecycles and reduced furnace downtime.
- Sustainability Trends: Sustainability trends in the refractory sector are strengthening as manufacturers adopt low-carbon binders, recycled foundry sand and secondary raw materials for brick and castable production. Many plants have started integrating closed-loop recycling systems to recover old refractories and convert them into usable aggregates. Companies are placing emphasis on improved installation practices, predictive maintenance and regular lining inspections to minimise heat loss and extend furnace life. These practices are reducing environmental burdens and improving cost efficiency for steel, cement and non-ferrous industries.
- Global Expansion: Global expansion is being shaped by industrial shifts in developing regions, where countries that once exported large quantities of scrap materials are now establishing small, smart refractory plants to serve their domestic steel and cement sectors. Regional producers are forming partnerships with international specialists to gain access to technical expertise, advanced formulations and training in modern installation methods. Many global firms are also setting up service hubs near large industrial clusters to provide faster delivery, on-site inspections and maintenance solutions tailored to local plant requirements.
- Major Investors: Major investors include global refractory and materials companies that are upgrading production lines to meet rising demand for high-alumina, magnesia-based and monolithic refractories. Leading players are investing in automation, tunnel-kiln modernisation, energy-efficient firing methods and digital monitoring tools that support real-time lining diagnostics. Investment is also flowing into recycling infrastructure, advanced specialty mixes for new-energy industries and technical service offerings that improve customer retention in steel, cement and petrochemical sectors.
- Startup Ecosystem: The startup ecosystem in the refractory market is emerging gradually, with new companies focusing on sustainability, waste reduction and digital process optimisation. Startups are developing solutions such as AI-assisted furnace monitoring, improved installation techniques and lightweight refractory blends using industrial by-products. Some young firms are experimenting with 3D-printed refractory shapes for custom furnace components and rapid prototyping. Their innovations support greater energy efficiency, lower downtime and more precise material performance across high-temperature industries.
Market Report Scope
| Report Attribute | Details |
| Market Size Value in 2026 | USD 33.28 Billion |
| Revenue Forecast in 2035 | USD 49.68 Billion |
|
Growth rate |
CAGR of 4.55% from 2026 to 2035 |
| Forecast Period | 2026 - 2035 |
| Base Year | 2025 |
| Dominant Region | Asia Pacific |
| Fastest Growing Region | North America |
| Segments covered | By Form, By Material Type , By End-Use Industry , By Manufacturing Process , By Regional |
| Key companies profiled | Calderys, Dalmia Bharat Refractory, IFGL Refractories Ltd., Krosaki Harima Corporation, Lanexis, Morgan Advanced Materials, RHI Magnesita GmbH, Saint Gobain, SHINAGAWA REFRACTORIES CO., LTD., Vitcas |
Beyond Heat Resistance: The Rise of Sensor-Enabled Refractory Systems
The manufacturers are shifting towards smarter refractories that combine better ceramics with improved installation and simple sensors. These systems are designed to provide both mechanical strength and real-time monitoring, allowing industries to track temperature changes, detect stress points, and evaluate lining performance during high-temperature operations. This shift represents a move from passive refractory materials to intelligent solutions that support predictive maintenance.
Moreover, these advanced refractories can help manufacturers by indicating repair alarms before failure happens. Early warnings reduce unplanned shutdowns, protect equipment from severe damage, and improve operational efficiency in steel, cement, glass, and petrochemical plants. The ability to identify deteriorating conditions in advance also extends furnace life and supports safer working environments.
Import, Export, Consumption, and Production Statistics
China has observed a significant increase in the export of refractory bricks in 2024, with an estimated value of USD 1.7 billion, as per a published report. This high export volume reflects China’s strong manufacturing base, large-scale production capacity, and competitive pricing, which allow it to supply refractory products to major industrial markets worldwide. China remains one of the leading global suppliers because of its abundant raw materials, established kiln infrastructure, and strong demand from international steel and cement producers.
The United States exported a large amount of refractory material to Greece in 2024, valued at USD 31.54 thousand, according to the latest survey. Although smaller than those of major exporters, this trade highlights the specialized nature of U.S. refractory products used in niche applications and high-performance industrial systems. Such exports support industries that rely on high-quality ceramics and refractory components for furnaces, thermal plants, and metallurgical operations. (Source: https://tradingeconomics.com)
Value Chain Analysis of the Refractory Material Market:
- Distribution to Industrial Users
The distribution of refractory materials to industrial users involves a global network of major manufacturers. Some of whom are vertically integrated with their own raw material sources, as well as specialized local and regional distributors and contractors.
Key Players: RHI Magnesita (Austria), Vesuvius (U.K.), Ltd., and Krosaki Harima Corporation (Japan)
- Chemical Synthesis and Processing
The chemical synthesis and processing of refractory materials are fundamental steps that determine the final properties and performance of products designed to withstand temperatures above 1,000°C. Key players in this market are often vertically integrated, controlling raw material extraction and advanced manufacturing processes to ensure quality and consistency.
Key Players: Saint-Gobain (France), Imerys (France/U.S.), Ltd., and HarbisonWalker International (HWI) (U.S.)
- Regulatory Compliance and Safety Monitoring
Regulatory compliance and safety monitoring in the refractory materials market are governed by a complex framework of international, national, and industry-specific standards. These regulations aim to manage environmental impact, ensure worker safety during handling and installation, and guarantee product quality and reliability in high-temperature applications
Key Agencies: Environmental Protection Agencies, Occupational Safety and Health Administration (OSHA), and International Organization for Standardization (ISO)
Refractory Material Market Regulatory Landscape: Global Regulations
| Country / Region | Regulatory Body | Key Regulations | Focus Areas |
| United States | Occupational Safety and Health Administration (OSHA) | OSHA Permissible Exposure Limits (PELs) and Safety Data Sheets (SDS) | OSHA Permissible Exposure Limits (PELs) and Safety Data Sheets (SDS) |
| European Union | European Commission (EC) | REACH Regulation (EC) No 1907/2006 | Managing chemical safety and exposure |
| China | Ministry of Industry and Information Technology (MIIT) | Ministry of Industry and Information Technology (MIIT) | Addressing overcapacity and promoting industry consolidation |
Segmental Insights
Form Insights
How did the Shaped Refractories Segment Dominate the Refractory Material Market in 2024?
The shaped refractories segment dominated the refractory material market, accounting for 64.50% of industry share in 2025, driven by industries' recent preference for ready-made bricks. Also, factors such as ease of storage, installation, and shipping have stimulated demand-led growth in the shaped refractories segment in recent years. Moreover, owing to their durability and suitability for high-temperature equipment, the shaped refractories segment has attracted industry attention in recent years.
On the other hand, the unshaped refractories segment is expected to grow at a 5.7% CAGR owing to the increasing need for flexible material that can fit any furnace design. Moreover, by enabling faster installation while reducing labor costs, unshaped refractories are expected to create value-added opportunities for industry participants during the forecast period.
Material Insights
Why does the Alumina Refractories Segment Dominate the Refractory Material Market by Material?
The alumina refractories segment dominated the market with 32.40% of industry share in 2025, owing to factors such as the durability, affordability, and increasing demand in high-temperature industries. Also, by withstanding chemical attack, heavy wear, and thermal shock, alumina refractories have boosted revenue potential across the manufacturing landscape in the current period.
The magnesia refractories segment is expected to grow rapidly at a 5.8% CAGR as industries move toward higher-temperature processes and cleaner steel production. Magnesia handles extreme heat and resists basic slags, making it essential for steelmaking, oxygen furnaces, and newer green-hydrogen steel technologies.
The silica refractories segment is also growing rapidly because they perform well in glass furnaces, coke ovens, and other high-temperature structures that require excellent thermal stability. Silica resists chemical attack and maintains strength even near its melting point. As demand for glass in solar panels, packaging, and building materials rises, silica refractories are increasingly used.
End Use Insights
How did the Iron and Steel Segment Dominate the Refractory Material Market in 2024?
The iron and steel segment dominated the market with a 34.50% industry share in 2025, as steelmaking requires extremely high temperatures and large amounts of refractory materials, including bricks, castables, and monolithics. Every furnace, ladle, and converter requires a thick refractory lining to handle heat, chemicals, and continuous wear.
On the other hand, the cement segment is expected to expand at a 5.7% growth rate as global construction expands, as cement kilns require long-lasting refractory linings that withstand very high temperatures. As countries build more infrastructure- roads, bridges, housing, and industrial plants cement production will increase.
The glass segment is also growing rapidly, driven by rising demand for solar energy, food packaging, smartphones, and eco-friendly building materials. Glass furnaces operate continuously at extremely high temperatures, requiring durable refractories that resist corrosion and thermal shock.
Manufacturing Process Insights
Why does the Dry Press Process Segment Dominate the Refractory Material Market by Manufacturing Process?
The dry press process segment dominated the market, accounting for 45.60% of industry share in 2025, as it produces strong, uniform, and reliable refractory bricks at low cost. Factories prefer this method for mass production because it uses simple dies and high pressure to shape powders into consistent blocks. The process is fast, clean, and ideal for large orders.
The fused cast process segment is expected to grow rapidly at a 5.5% CAGR as industries increasingly demand refractories with extremely high purity and excellent resistance to molten glass, chemicals, and severe heat. Fused cast bricks are melted and then solidified, giving them superior strength and smooth surfaces that reduce wear.
The formed process segment is also growing rapidly as industries seek custom-shaped refractory pieces that fit complex furnace designs. This process allows special sizes, angles, and shapes that improve installation speed and reduce the number of joints. Fewer joints mean better heat resistance and longer lining life.
Regional Analysis
Asia Pacific Refractory Material Market Trends
The Asia Pacific refractory material market size was estimated at USD 15.44 billion in 2025 and is projected to reach USD 24.12 billion by 2035, expanding at a CAGR of 4.57% from 2026 to 2035.
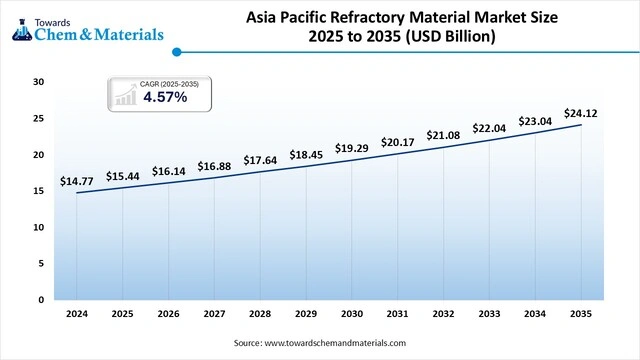
Asia Pacific dominated the refractory materials market with a 48.5% industry share, owing to the presence of one of the world's largest steel and industrial manufacturing infrastructures. The region’s extensive network of blast furnaces, rotary kilns, and high-temperature processing units creates a continuous need for durable refractory linings that can withstand intense thermal and mechanical stress. This strong industrial foundation keeps demand consistently high across both heavy manufacturing and energy-intensive sectors.
Furthermore, countries in the region, such as China, India, and Japan, have seen a high demand for furnaces, requiring continuous refractory maintenance and supply. These countries operate large-scale steel mills, cement plants, and non-ferrous metal facilities that rely on regular refractory replacement to maintain operational efficiency. As production activity expands and industrial equipment operates at higher capacities, the need for reliable refractory products continues to support Asia Pacific’s dominant position in the global market.
Powerhouse Production: China Dominates Refractory Supply Chain
China maintained its dominance in the refractory materials market due to its status as the leading producer of steel, glass, and cement. This strong industrial base creates constant demand for high-temperature materials used in blast furnaces, cement kilns, glass tanks, and other thermal processing units. As these industries operate at a large scale and require frequent refractory replacement, China continues to consume and produce significant volumes of refractory goods each year.
Moreover, with the wide availability of raw materials such as silica, magnesia, and alumina, the country has gained prominence in recent years as a producer of refractory materials, according to the survey. These abundant mineral resources support domestic manufacturing and reduce dependence on imported inputs, allowing China to maintain competitive production costs. Combined with established processing facilities and large export networks, this resource advantage has reinforced China’s position as one of the most influential players in the global refractory material market.
North America Refractory Material Sector Evaluation
North America is a notably growing region due to the significant modernization of traditional plants with the latest equipment and technology. Many steel, cement, and metal processing facilities are replacing older furnace linings and upgrading to more efficient high-temperature systems, which directly increases the demand for advanced refractory solutions. This modernization wave also supports better energy use and longer operational cycles across key industries.
Additionally, North American manufacturers have seen significant investment in renewable energy, electric arc furnaces, and advanced glass plants in the current period. These facilities require high-performance refractory linings capable of handling intense heat, rapid temperature shifts, and continuous operation. As renewable energy infrastructure and electric arc furnace steelmaking expand, the region’s reliance on durable, next-generation refractory materials continues to rise.
Stronger, Hotter, Better: The United States Refractory Market Heats Up
The United States is expected to gain significant market share through upgrades to steelmaking, cement production, petrochemical plants, and energy systems. These sectors continue to modernize high-temperature equipment and increase production efficiency, which raises the need for refractories that can endure extreme heat, chemical exposure, and continuous operational cycles. Upgraded furnaces, larger kilns, and more advanced processing units all require materials with higher durability and longer service life, pushing demand for innovative refractory solutions.
Many United States factories are switching to electric furnaces, which need advanced refractory. Electric arc furnaces and other electric-heat systems operate under different thermal patterns compared with traditional blast furnaces, often involving rapid heating, cooling, and intense localized temperatures. This shift increases the need for specialized refractory linings that can resist thermal shock and maintain stability during high-energy cycles. As more facilities adopt electric-based production in alignment with efficiency and sustainability goals, the United States refractory market is positioned for strong growth.
Europe Refractory Material Market Examination
Europe is expected to capture a major share of the refractory materials market, driven by the current shift towards cleaner, high-performance refractories in heavy industry. This shift is strongly influenced by the region’s focus on improving energy efficiency, reducing emissions, and extending the operational life of high-temperature equipment used in steelmaking, cement production, and glass manufacturing. Many European industrial facilities are modernizing their thermal systems, which increases demand for refractories that offer stronger insulation, reduced heat loss, and longer lifecycles.
Moreover, by upgrading glass furnaces, steel plants, and cement kilns while complying with stricter environmental regulations, the region is expected to create lucrative opportunities for sustainable refractory manufacturers in the coming years. European Union environmental frameworks continue to tighten emission standards and push industries toward cleaner production methods, encouraging the use of eco-friendly refractory materials made from low-carbon, recyclable, or energy-efficient compositions. As industries adopt these next-generation solutions, Europe is positioned to remain a leading market for advanced and sustainable refractories.
Germany Leads the Charge in High-Tech Refractory Innovation
Germany is expected to emerge as a prominent player in the refractory materials market over the coming years, driven by heavy investment in high-tech refractories for the chemical, steel, and glass industries. These sectors operate some of the most temperature-intensive facilities in Europe, and Germany’s strong engineering base continues to encourage the development of materials that can withstand extreme thermal, mechanical, and chemical stress. Ongoing industrial upgrades and research partnerships with technical institutes further strengthen the country’s leadership in advanced refractory technologies.
The German manufacturers are actively shifting towards waste-to-energy plants while developing advanced materials with better heat resistance and longer service life. This shift supports national sustainability goals, as waste-to-energy facilities require highly durable refractories to maintain stable combustion and protect furnace structures. By focusing on longer-lasting, more efficient refractory solutions, German companies are improving operational reliability and reducing downtime for industries that depend on continuous high-temperature performance.
Refractory Materials Market Study in Latin America
Latin America is expected to capture a notable share of the refractory materials market, as industries in regional countries such as Brazil, Mexico, and Chile expand cement, steel, and mining operations. These sectors rely heavily on high-temperature equipment, including rotary kilns, blast furnaces, and smelters, all of which require regular refractory maintenance and replacement. As industrial output grows, the need for reliable and durable refractory materials increases across the region.
New factories, infrastructure projects, and regional industrialization create steady demand for refractories. Rising investment in transportation networks, energy facilities, and construction activity supports the continuous use of materials capable of withstanding extreme heat and harsh processing conditions. This ongoing industrial growth keeps demand for both shaped and monolithic refractory products stable.
Industrial Growth Ignites Brazil’s Refractory Material Demand
Brazil is expected to emerge as a prominent player in the refractory materials market in the coming years, driven by its strong steel, cement, and mining industries. These sectors operate high-temperature equipment such as blast furnaces, rotary kilns, and smelters, all of which require continuous refractory maintenance to keep production running safely and efficiently. As Brazil remains one of the largest steel and cement producers in Latin America, its industrial base naturally supports steady demand for advanced refractory solutions.
The country is expanding construction, energy, and industrial projects, all of which require high-quality refractories. Government-supported infrastructure development, rising investment in energy facilities, and growth in manufacturing have increased the need for durable materials that can withstand extreme heat, abrasion, and chemical exposure. This ongoing expansion makes refractories essential for Brazil’s industrial progress.
Top Companies in the Refractory Material Market & Their Offerings:
- RHI Magnesita GmbH – RHI Magnesita is the global leader in refractory materials, supplying magnesia- and dolomite-based refractories for steel, cement, nonferrous metals, energy, and glass industries. The company emphasizes innovation, circularity, and end-to-end refractory solutions including installation and digital monitoring.
- Vesuvius plc – Vesuvius specializes in advanced refractories and flow-control solutions for steelmaking and foundry applications. The company delivers engineered ceramics, high-performance linings, and technical services tailored for extreme temperature environments.
- Saint-Gobain S.A. – Saint-Gobain, through its High-Performance Solutions division, manufactures a wide portfolio of refractories, ceramics, and insulating materials. Its products serve steel, cement, petrochemical, and power industries with a strong focus on energy efficiency and durability.
- Krosaki Harima Corporation – Krosaki Harima is a major Japanese refractory producer offering a full suite of refractories for steelmaking, nonferrous metals, cement, and industrial furnaces. The company emphasizes research-driven product development and long service life materials.
- Morgan Advanced Materials plc – Morgan Advanced Materials supplies engineered refractory products, insulating firebricks, monolithic linings, and high-temperature ceramics. Its solutions support metallurgical, petrochemical, and power generation industries.
- Shinagawa Refractories Co., Ltd. – Shinagawa, one of Japan’s oldest refractory makers, provides high-grade refractories for steel, casting, glass, and incineration industries. The company focuses on precision manufacturing and advanced thermal performance.
- Imerys Group – Imerys produces mineral-based refractories, including alumina, silica, and specialty clays, used in steel, casting, and high-temperature process industries. Its portfolio includes raw materials, shaped products, and monolithic refractories.
- HarbisonWalker International – HarbisonWalker offers a wide range of monolithic refractories, firebricks, and specialty products used in metals, glass, and energy sectors. The company provides engineering services, installation support, and digital monitoring tools.
- Calderys (Imerys) – Calderys manufactures monolithic refractories, precast shapes, and high-performance linings for steel, foundry, cement, and boilers. Its solutions focus on thermal efficiency, reliability, and reduced downtime.
- Chosun Refractories Co., Ltd. – Chosun Refractories produces diverse refractory bricks and monolithics for steelmaking, cement, and nonferrous industries. The company has strong regional presence in Asia with expanding global exports.
- Puyang Refractories Group Co., Ltd. – Puyang Refractories supplies high-alumina, magnesia, and silica-based products for steel, cement, and petrochemical sectors. The company focuses on cost-effective, durable solutions for large-scale industrial clients.
- Resco Products, Inc. – Resco Products manufactures alumina-silica bricks, magnesia-based refractories, and monolithics for iron & steel, cement, and mineral processing industries. Its offerings include custom-engineered refractory linings.
- IFGL Refractories Ltd. – IFGL provides refractories, flow control systems, and continuous casting consumables for steel plants. The company emphasizes engineered ceramics and global supply capabilities.
- Magnezit Group – Magnezit specializes in magnesia-based refractories, delivering products for steelmaking, nonferrous metals, and cement kilns. The company focuses on high-temperature resistance and long operational life.
- Dalmia Refractory Limited – Dalmia Refractory produces refractory bricks, monolithic products, and specialized linings for cement, steel, glass, and industrial furnaces. The company emphasizes high-quality raw materials and reliable performance.
Market Top Companies
- Calderys
- Dalmia Bharat Refractory
- IFGL Refractories Ltd.
- Krosaki Harima Corporation
- Lanexis
- Morgan Advanced Materials
- RHI Magnesita GmbH
- Saint Gobain
- SHINAGAWA REFRACTORIES CO., LTD.
- Vitcas
Recent Developments
- In October 2025, Trunnano introduced ceramic products made from Silicon Nitride-Silicon Carbide. Also, this material has high temperature stability and superior thermal shock resistance, as per the report published by the company recently. (Source: https://finance.yahoo.com/)
Segments Covered in the Report
By Form
- Shaped Refractories
- Unshaped (Monolithic) Refractories
By Material Type
- Alumina Refractories
- Silica Refractories
- Magnesia Refractories
- Zirconia Refractories
- Carbon Refractories
- Others (Chromite, Fireclay, etc.)
By End-Use Industry
- Iron & Steel
- Cement
- Glass
- Non-Ferrous Metals
- Power Generation
- Petrochemical
- Ceramics
By Manufacturing Process
- Dry Press Process
- Fused Cast Process
- Hand Molded Process
- Formed Process
By Regional
- North America
- Europe
- Asia-Pacific
- Latin America
- Middle East & Africa (MEA)
A Seven-Phase Framework
Our methodology is designed to be universally applicable across commodity chemicals, specialty chemicals, petrochemicals, construction chemicals, coatings, electronic chemicals, industrial gases, agrochemicals, water treatment chemicals, and performance materials. Each phase builds upon the last, creating a layered validation structure that minimizes estimation error and maximizes analytical confidence.
The framework ensures comprehensive market coverage, robust cross-validation, and reliable long-term forecasting — producing market estimates that withstand scrutiny from investors, regulators, and corporate strategy teams.

Seven-Phase Framework — Analytical Effort Distribution
Relative analytical effort allocated across each phase of the Chemicals & Materials research framework

Phase 1 - Secondary Research: Establishing the Foundation
Secondary research collects and evaluates publicly available information from authoritative sources, establishing the foundational understanding of market structure, value chain dynamics, competitive landscape, and end-use demand patterns. Every source is evaluated for credibility, recency, geographic relevance, and methodological soundness before inclusion.
Industry Associations
Sources include ACC, CEFIC, ICCA, JCIA, CPCIF, and SOCMA providing production volumes, consumption trends, capacity developments, and sustainability initiatives.
Company Disclosures
Annual reports, investor presentations, earnings transcripts, and regulatory filings reveal product portfolios, manufacturing footprints, capacity expansions, and revenue segmentation.
Government Databases
National statistical offices, customs authorities, environmental agencies, and industrial production databases provide verified statistics on output, trade flows, and regulatory compliance.
Trade Databases
UN Comtrade, ITC, Eurostat, and national customs authorities enable assessment of global product movement, import dependency, and export competitiveness across regions.
Our Secondary Research Sources
- Ministry of Chemicals and Fertilizers
- European Chemicals Agency
- United States Department of Energy
- Ministry of Industry and Information Technology
- Ministry of Economy Trade and Industry
- Ministry of Trade Industry and Energy
- National Institute of Standards and Technology
- Council of Scientific and Industrial Research
- Fraunhofer Society
- National Institute for Materials Science
Phase 2 — Supply-Side Assessment: Mapping Production Capabilities
Production Capacity Analysis
All major manufacturers are assessed for existing installed capacity, planned additions, expansions, new plant announcements, and technology adoption — mapped at global, regional, and country levels.
Capacity Utilization Adjustment
Installed capacity is adjusted using utilization rates based on demand conditions, feedstock availability, plant operating rates, maintenance schedules, and regulatory restrictions.
Manufacturer Revenue Analysis
Product-specific revenues, segment-level performance, regional distribution, average selling prices, and margin trends are evaluated to establish market value estimates.
Supply-Side Assessment — Capacity vs. Effective Production by Region
Illustrative comparison of installed capacity vs. effective production volume (after utilization rate adjustment) across major regions

Phase 3 — Demand-Side Assessment: Quantifying Chemical Consumption
Demand-side analysis quantifies chemical consumption across industries, applications, and geographies — identifying where and how chemicals are consumed throughout the value chain with precision.
End-Use Industry Analysis
Chemical demand is evaluated across automotive, construction, packaging, electronics, agriculture, healthcare, consumer goods, industrial manufacturing, energy and utilities, and water treatment. Industry output, production trends, and consumption intensity are analyzed to determine demand patterns.
Consumption Modeling
Demand is estimated using measurable indicators: kilograms per vehicle, kilograms per square meter of construction, dosage per cubic meter of water treated, kilograms per hectare of agricultural land, and kilograms per ton of manufactured products. Consumption factors are validated through industry publications and primary interviews.
Application Analysis
The market is segmented by application area to understand product performance requirements, formulation trends, technology adoption, customer preferences, and regulatory requirements improving demand accuracy and segmentation granularity.
Demand-Side Assessment — End-Use Industry Demand Distribution
Illustrative distribution of chemical & materials demand across key end-use industries

Phase 4 - Trade Flow Analysis: Balancing Regional Supply and Demand
Trade flow analysis reconciles regional supply and demand estimates through import and export data, identifying net supply positions, regional dependencies, and market imbalances. It serves as an independent validation layer that tests the consistency of supply-side and demand-side estimates.
Import Analysis
Import data is evaluated to determine volumes, source countries, product dependency, regional supply gaps, and pricing trends — identifying markets that rely heavily on external supply and where domestic production is insufficient to meet demand.
Export Analysis
Export assessments reveal production surplus, export competitiveness, regional manufacturing strength, and global market participation. Export patterns also help validate domestic production estimates and identify net exporting regions.
Apparent Consumption Model
Regional consumption is assessed using the standard apparent consumption formula:
Results identify net importing regions, net exporting regions, regional deficits, and surpluses — serving as an independent validation of supply and demand estimates.
Trade Flow Analysis — Net Supply Position by Region
Illustrative apparent consumption vs. domestic production across major regions — positive gap indicates net import dependency

Phase 5 — Primary Research: The Critical Validation Layer
Primary research tests and refines findings from secondary research through direct engagement with industry participants across the supply chain, demand side, and expert community. It captures intelligence that no database or published report can provide — the real-world experience of manufacturers, buyers, and specialists operating in the market.

Supply-Side Interviews
Conversations with chemical manufacturers, raw material suppliers, contract manufacturers, technology providers, and plant operators cover production trends, capacity utilization, pricing developments, technology shifts, and competitive dynamics.

Demand-Side Interviews
Engagement with OEMs, industrial consumers, procurement managers, distributors, formulators, and end-use manufacturers focuses on consumption trends, purchasing behavior, product substitution, demand outlook, and emerging applications.

Industry Expert Consultations
Additional interviews with industry consultants, independent experts, regulatory specialists, technical professionals, and research institutions provide deeper market context and validate key analytical assumptions.
Focus Areas of Primary Research:
Market Size & Forecast Validation
Revenue estimates, volume consumption, growth rates, forecast assumptions, regional demand.Supply Chain & Value Chain Assessment
Raw material sourcing, supply chain challenges, distribution networks, procurement practices.Production & Capacity Analysis
Manufacturing capacity, utilization rates, expansion projects, plant investments.Pricing & Cost Structure Analysis
Product pricing trends, feedstock costs, energy costs, margin pressures, pricing outlook.Competitive Landscape Assessment
Volume and value estimates confirmed to be fully consistent with one another before publicationInterview Volume by Market Scope
| Study Scope | Number of Interviews |
|---|---|
| Niche Market | 20 – 30 |
| Mid-Sized Market | 30 – 50 |
| Global Market | 50 – 80 |
| Highly Fragmented Market | 80 – 120 |
Interview Details:
Category : Manufacturers, Suppliers, Distributors, End Users, Experts/Associations
Average Duration : 30–60 Minutes
Interview Mode : Video calls, telephonic interviews, expert consultations
Interview Format : Structured / Semi-Structured questionnaire
Focus Areas of Primary Research:
Market Size & Forecast Validation :
Revenue estimates, volume consumption, growth rates, forecast assumptions, regional demand.
Supply Chain & Value Chain Assessment :
Raw material sourcing, supply chain challenges, distribution networks, procurement practices.
Production & Capacity Analysis :
Manufacturing capacity, utilization rates, expansion projects, plant investments.
Pricing & Cost Structure Analysis :
Product pricing trends, feedstock costs, energy costs, margin pressures, pricing outlook.
Competitive Landscape Assessment :
Market share, competitor positioning, strategic initiatives, partnerships, acquisitions.
Primary Research — Stakeholder Coverage by Category
Distribution of interview respondents across stakeholder categories (% share from PPT data)

Primary Research — Respondent Designation Profile
Seniority breakdown of interview respondents (% share from PPT data)

Primary Research — Geographic Coverage of Interviews
Regional distribution of primary research engagement (% share from PPT data)

Phase 6 — Data Triangulation and Market Validation
No single methodology is relied upon in isolation. Multiple independent estimation approaches are combined and reconciled to ensure consistency, accuracy, and analytical defensibility. Any material deviations between approaches are investigated and adjusted through additional validation cycles.
The final market size is derived through weighted triangulation of all validated methodologies. Any material deviations between approaches are investigated and adjusted through additional validation cycles. The outcome represents the most realistic assessment of the market based on available evidence and expert confirmation ensuring that volume and value estimates are fully consistent with one another.
Triangulation Framework — Input Contribution Weight
Relative weight each sizing input contributes to the final reconciled market estimate

Phase 7 — Forecast Modeling: Projecting Future Market Evolution
Forecasting evaluates the future trajectory of the market using a combination of quantitative indicators and qualitative assessments across economic, industry, and regulatory dimensions. Rather than simple extrapolation, each driver is independently modeled and integrated into a composite forecast.
Macroeconomic Indicators
GDP growth, industrial production, manufacturing output, construction activity, consumer spending, and capital investment form the quantitative foundation of long-term demand projections. These are applied at country, regional, and global levels.
Industry Growth Drivers
Urbanization, infrastructure development, industrialization, technological innovation, sustainability initiatives, and evolving product performance requirements are assessed at regional and industry levels — capturing both structural and cyclical demand drivers.
Capacity Expansion Analysis
Announced plant expansions, new manufacturing facilities, technology upgrades, and strategic investments are evaluated to determine future supply-demand dynamics and potential market tightness or oversupply situations.
Regulatory & Sustainability
Environmental regulations, chemical safety standards, emission reduction targets, circular economy initiatives, and sustainability requirements are incorporated as they often influence product adoption rates and market growth trajectories.
Scenario Forecast Range — Indexed Market Growth (Year 1–10)
Illustrative indexed growth trajectories across Base, Optimistic, and Pessimistic scenarios over a 10-year forecast horizon

Forecast Drivers — Relative Impact Score by Category
Impact score (0–100) of each driver type on chemicals & materials market forecast



Comments
Share your thoughts, ask a question, or provide feedback about this report.