
Europe Water Treatment Chemicals Market Size and Forecast 2026 to 2035
The Europe water treatment chemicals market size is estimated at USD 12.50 billion in 2025, is projected to grow to USD 13.15 billion in 2026, and is expected to reach around USD 20.66 billion by 2035. growing at a CAGR of 5.15% from 2025 to 2035. The global shift towards sustainability has fueled market growth in recent years.
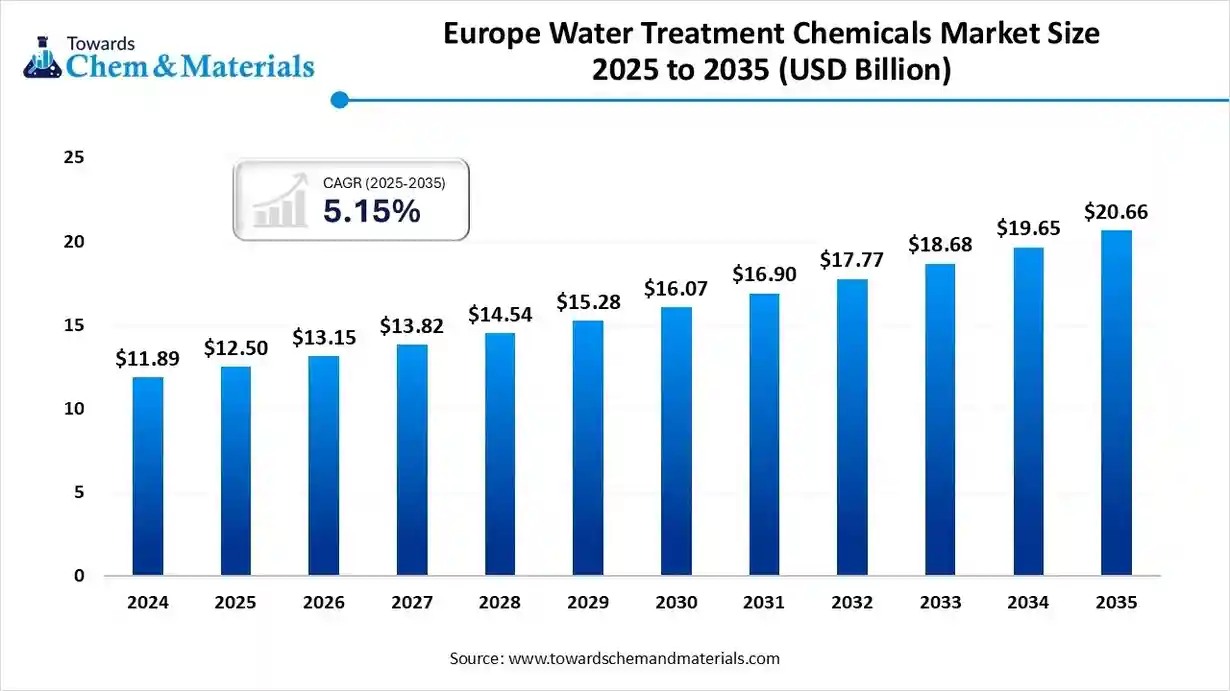
Key Takeaways
- By product type, the coagulants & flocculants segment dominated the market with 32% in 2024.
- By product type, the corrosion & scale inhibitors segment is expected to grow at the fastest rate in the market during the forecast period.
- By application type, the wastewater treatment segment dominated the market with 41% industry share in 2024.
- By application type, the boiler & cooling water treatment segment is expected to grow at the fastest rate in the market during the forecast period.
- By end user industry, the municipal water utilities segment dominated the market with 35% industry share in 2024.
- By end-use industry, the power generation segment is expected to grow at the fastest rate in the market during the forecast period.
- By source type, the wastewater & effluent treatment segment dominated the market with 58% industry share in 2024.
- By source type, the freshwater treatment segment is expected to grow at the fastest rate in the market during the forecast period.
- By technology integration type, the manual dosing segment dominated the market with 63% in 2024.
- By technology integration type, the automated smart dosing segment is expected to grow at the fastest rate in the market during the forecast period.
Transforming Every Drop: Europe’s Path to Smarter, Cleaner Water
- The Europe water treatment chemicals market covers chemical formulations used to control scale, corrosion, biofouling, and impurities across municipal, industrial, and commercial water systems. These chemicals improve water quality, process efficiency, and environmental compliance in sectors such as power generation, food & beverage, pulp & paper, oil & gas, and wastewater management.
- The market is driven by tightening EU Water Framework Directive standards, circular water reuse initiatives, and decarbonization goals. Technological advances focus on eco-friendly chemistries, polymer-based inhibitors, and integrated digital dosing systems for optimized consumption and reduced environmental footprint.
Europe Water Treatment Chemicals Market Outlook:
- Industry Growth Overview: Between 2025 and 2034, the increasing initiatives of the replacement of older systems and tighter sustainability rules have raised awareness among venture and corporate backers in recent years. Also, the government is actively supporting initiatives like small towns with multiple factories, where the industrial water clusters are playing a vital role in Europe in recent years.
- Sustainability Trends: Industry in the region is known for its biodegradable chemistries, chemical recovery loops, and lower sludge. Moreover, the European manufacturers are seen in selling water circularity scores where the buyers are thinking and understanding ESG badges showing litres saved per ton of the launched product.
- Global Expansion: The European manufacturers are actively seen in exporting their high-value water chemistries across the globe where the modular systems have raised heavy demand. Furthermore, several global buyers are observed in meeting the EU and buyers' standards to adopt the latest technologies and advanced systems in recent years.
Report Scope
| Report Attributes | Details |
| Market Size in 2026 | USD 13.15 Billion |
| Expected Size by 2035 | USD 20.66 Billion |
| Growth Rate from 2025 to 2035 | CAGR 5.15% |
| Base Year of Estimation | 2024 |
| Forecast Period | 2025 - 2035 |
| Segment Covered | By Product Type, By Application, By End-Use Industry, By Source Type, By Technology Integration, |
| Key Companies Profiled | BASF SE., Ecolab, Solenis LLC, Veolia Water Technologies , Kurita Europe GmbH , SNF Floerger , Arkema S.A. , Dow Chemical Company , Nouryon , SUEZ Group , Baker Hughes Company , Italmatch Chemicals S.p.A. , Solvay S.A. , Lenntech B.V. |
Digital Dosing: The New ERA of Smart Water Chemistry
The technology has become a trending subject among institutional investors nowadays. The European chemical manufacturers and water treatment buyers are shifting towards sensor-calibrated dosing for the engagement of the specific chemical blends. Also, several chemical suppliers are seen under the heavy usage of the cloud reports while refilling the subscriptions.
Trade Analysis of the Europe Water Treatment Chemicals Market:
- Import, Export, Consumption, and Production Statistics
- The United Kingdom exported 24 shipments of water treatment chemicals from 2024 to 2025.
Value Chain Analysis of the Europe Water Treatment Chemicals Market:
- Distribution to Industrial Users : The distribution of water treatment chemicals to industrial users in Europe has a close association with direct sales, as per the provided information.
- Chemical Synthesis and Processing: The chemical synthesis and processing of water treatment chemicals in the European market involve large-scale industrial manufacturing processes and are driven by stringent EU regulations.
- Regulatory Compliance and Safety Monitoring : Regulatory compliance and safety monitoring in the European water treatment chemicals market are governed by a robust framework of interconnected EU Directives and Regulations, as per the published report.
Europe Water Treatment Chemicals Market Regulatory Landscape: Global Regulations
| Country / Region | Regulatory Body | Key Regulations | Focus Areas | Notable Notes |
| European Union | European Chemicals Agency (ECHA) | REACH Regulation (EC No 1907/2006) | Protecting human health and the environment from hazardous chemicals | This is an EU agency that manages the technical and administrative aspects of the Registration, Evaluation, Authorization and Restriction of Chemicals (REACH) regulation. |
Country / Region Regulatory Body Key Regulations Focus Areas Notable Notes
European Union
- European Chemicals Agency (ECHA) REACH Regulation (EC No 1907/2006) Protecting human health and the environment from hazardous chemicals This is an EU agency that manages the technical and administrative aspects of the Registration, Evaluation, Authorization and Restriction of Chemicals (REACH) regulation.
Segmental Insights:
Product Type Insights
How did the Coagulants & Flocculants Segment Dominate the Europe Water Treatment Chemicals Market in 2024?
- The coagulants & flocculants segment dominated the market with 32% industry share in 2024 due to increasing need or the affordable and fast solids removal in the current period. Moreover, by helping plants to meet discharge rules without any new equipment, the coagulants and flocculants have gained major industry attention in recent years.
- The corrosion & scale inhibitors segment is expected to grow at a significant rate owing to the shift towards the reuse of systems that concentrate salts. Also, several manufacturers are actively focusing on the zero liquid discharge and hardness and salinity rise, the corrosion and inhibitors are likely to crucial role in the coming years.
- The biocides & disinfectants segment is also notably growing, akin to the threat of biofilms, which is seen in reducing the output and shortening membrane life. Furthermore, sectors like pharma, food, and electronics are increasingly providing a sophisticated consumer base to the biocide and disinfectant manufacturers in the current period.
Application Insights
Why does the Wastewater Treatment Segment Dominate the Europe Water Treatment Chemicals Market?
- The wastewater treatment segment dominated the market with a 41%industry share in 2024 because most industries and cities must clean used water before releasing or reusing it. This process needs many types of chemicals like coagulants, pH adjusters, and defoamers. Europe has strict wastewater rules, so factories spend more on these treatments. Industrial zones often share one treatment plant to reduce costs, creating a large chemical demand.
- The boiler & cooling water treatment segment is expected to grow at a rapid rate because clean water is key to energy efficiency. If scaling or rust builds up, it wastes energy and damages equipment. With Europe focusing on low-carbon power, industries are investing more in advanced treatment systems to save energy.
- The raw water treatment segment is also notably growing because Europe is running low on clean freshwater.
- Many factories now use rivers or reused water which contain impurities. Chemicals like coagulants and antiscalants help remove these impurities before water is used in processes
End User Insights
How did the Municipal Water Utilities Segment Dominate the Europe Water Treatment Chemicals Market in 2024?
- The municipal water utilities segment dominated the market with 35% industry share in 2024 market because they handle huge amounts of water for cities and towns. They buy treatment chemicals regularly in large quantities and have long-term contracts with suppliers. Their main goal is to provide safe, clean water to people and industries. Many
- European utilities are now adopting greener and safer chemical blends to reduce environmental impact.
The power generation segment is expected to grow at a significant rate because clean water is essential for running turbines and boilers efficiently. Even small impurities can cause serious equipment damage. As Europe moves to renewable and cleaner energy systems, modern plants are using advanced water treatment chemicals to prevent downtime. - The food and beverages segment is also notably growing, because clean and safe water is necessary for product quality. Companies are reusing water to cut costs and meet sustainability goals. They need gentle, food-safe chemicals that don't affect taste or safety. Breweries, dairies, and juice plants are adopting biocides that are non-toxic and easy to rinse out.
Source Insights
How did the Wastewater & Effluent Treatment Segment Dominate the Europe Water Treatment Chemicals Market in 2024?
- The wastewater & effluent treatment segment dominated the market with 58% industry share in the 2024 market, because these streams contain the most dirt, oil, and heavy metals. They need multiple treatment steps, which use a lot of chemicals. Industrial areas with shared effluent treatment plants buy chemicals in bulk, keeping the market strong.
- The freshwater treatment segment is expected to grow at a significant rate because Europe's clean water sources are becoming more polluted. Many factories must treat water before use to remove microplastics, minerals, and organic matter. Companies are now using eco-friendly oxidants and carbon-based adsorbents for better purification.
Technology Insights
Why does the Manual Dosing Segment Dominate the Europe Water Treatment Chemicals Market?
- The manual dosing segment dominated the market with 63% industry share in 2024 because it's simple, affordable, and easy to control. Many small factories in Europe still prefer adjusting chemical levels by hand, as it doesn't require automation systems or expensive sensors. Operators can make quick changes based on water quality tests.
- The automated/smart dosing segment is expected to grow at a rapid rate because it's more accurate and efficient than manual control. These systems automatically adjust chemical levels using real-time sensors. This helps reduce waste, save money, and ensure water quality stays stable.
Country Insights
Germany Water Treatment Chemicals Market Trends
Germany dominated the Europe water treatment chemicals market with a 26% industry share, owing to the presence of a greater manufacturing base, strong chemical industry, and implementation of the sustainability standards. Moreover, the German manufacturers have heavily associated with retrofit, which has maintained demand for the water treatment chemicals in recent years. Moreover, the German cluster models and small suppliers near the industrial hubs have received immense attention to the country in the past few years.
France Water Treatment Chemicals Market Analysis
France is expected to capture a major share of the Europe water treatment chemicals market because it's investing heavily in new industries like semiconductors, pharmaceuticals, and renewable energy - all of which need pure water. The French government supports green chemical manufacturing and water reuse projects through incentives. Many local companies are developing smart, ready-to-use treatment kits for export.
Recent Developments
- In September 2025, CTECH Europe introduced its latest technology for water purification, which is called PFAS purification. Moreover, this technology has been produced in collaboration with AA Environmental, as per the published report.(Source: www.ctech-europe.com)
Top Vendors in the Europe Water Treatment Chemicals Market & Their Offerings:
Kemira Oyj
Corporate Information
- Name: Kemira Oyj (listed on Nasdaq Helsinki)
- Headquarters: Helsinki, Finland
- Industry focus: Chemicals for water-intensive industries, including water treatment, pulp & paper, fiber, packaging & hygiene.
- Recent scale: In 2024, revenue around EUR 2.9 billion and over 5,000 employees.
History and Background
- Founded: 1920, and over time evolved from broader chemicals/fertilizer business into specialized industrial chemicals.
- Over the years shifted increasingly into water-intensive industries and sustainable solutions.
- Historically part of Finnish industrial chemicals heritage; has transformed business units and strategy in recent years.
Key Developments and Strategic Initiatives
- In August 2024 Kemira announced a major renewal of its operating model and Management Board, to accelerate growth strategy, increase customer centricity, speed of delivery and value creation.
- In October 2024 they started change negotiations in Finland wrt the new organization, targeting more streamlined structure and better strategic focus.
Mergers & Acquisitions
- In the Q3 2025 interim report, Kemira announced acquisition of Water Engineering, Inc. (US-based industrial water treatment services company) to expand Water Solutions business into industrial water treatment services.
(Earlier) Investment/expansion of capacities (e.g., chlorate production) and R&D facility expansion: Eg. 2018 loan for chlorate and R&D EUR 90 million.
Partnerships & Collaborations
- Partnership with International Flavors & Fragrances Inc. (IFF) to produce biobased materials via their DEB™ (Designed Enzymatic Biomaterial) platform. Joint investment ~EUR 130 million for a production facility in Finland.
- Collaboration with Bluepha Co., Ltd. on PHA (polyhydroxyalkanoate) in sustainable packaging coatings for APAC region; push into PFAS-free, renewable barrier coatings.
Product Launches / Innovations
- Completed an industrial-scale polymer plant in Finland based on the DEB™ technology (with IFF) in Sept 2024, producing renewable polymers for paper, board and water treatment applications.
- Innovation in digital water treatment services: Eg. “KemConnect® Raw Water Treatment” service offering real-time monitoring and dynamic chemical dosing for pulp & paper/water treatment operations.
Key Technology Focus Areas
- Water treatment chemistry and services (coagulants, polymers, antiscalants, digital dosing etc) for industries and municipal markets.
- Renewable/biobased materials: building alternatives to fossil-based chemicals via DEB™ platform, PHA coatings, etc.
- Digital services and analytics: Using real-time data, AI, and digital tools to optimise chemical dosage, water quality monitoring, etc.
R&D Organisation & Investment
- Kemira has significant R&D investment: For example, a EUR 50 million loan from Nordic Investment Bank (NIB) to finance R&D investments during 2023-2026 in Espoo, Finland; focused on pulp & paper and water treatment industry solutions.
- Kemira’s R&D organisation: According to their innovation story, in 2023 they filed 55 new inventions, and led their industry reference group in patent filings in Finland.
SWOT Analysis
Strengths
- Strong specialization in water-intensive industries and water treatment chemistry, which is increasingly critical globally.
- Proven track record of innovation (patents, R&D investment) and strategic repositioning towards sustainability/renewables.
- Global footprint with strong European presence and growth ambitions.
- Clear strategic focus on growth areas: water solutions, renewables, digital services.
Weaknesses
- Exposure to cyclical industries (e.g., pulp & paper) which may face slowdowns or structural changes.
- Transition to new operating model and business units may involve execution risk (restructuring, cost, organizational change).
- Dependency on raw materials and chemicals markets which face volatility (commodities, regulation, supply chain).
Opportunities
- Growth in demand for water treatment chemicals and services (municipal, industrial) due to regulation, sustainability pressure, climate change.
- Expanding into renewable/biobased material markets (e.g., packaging, molded fiber, barrier coatings) offers new growth vectors.
- Digital services and AI/analytics in water and chemical dosing present value-added service opportunities beyond traditional product sales.
- M&A and geographic expansion in emerging markets, service businesses (industrial water services) could add scale and diversify revenue.
Threats
- Regulatory risks: chemical industry increasingly subject to stringent environmental, health & safety, and chemical substance regulations (e.g., PFAS restrictions).
Commodity input cost volatility and energy cost pressure, especially given chemical production’s high energy intensity. - Competitive pressure from large global chemical players and potential new entrants in specialty water / renewable chemistry space.
- Market softness in key end-markets (e.g., paper/pulp) could reduce demand or margin pressure.
Recent News & Strategic Updates
- October 2025: Kemira secured a EUR 50 million loan from NIB to build a new biomaterials production facility in Finland in partnership with IFF, as part of its renewable solutions strategy.
- January-September 2025 Interim Report: Kemira reported improved operative EBITDA margin of 13.6% driven by sales mix and cost management. Acquired Water Engineering, Inc. to expand industrial water treatment services; partnership with CuspAI announced; investment approved for activated carbon reactivation plant in Sweden.
Other Key Players
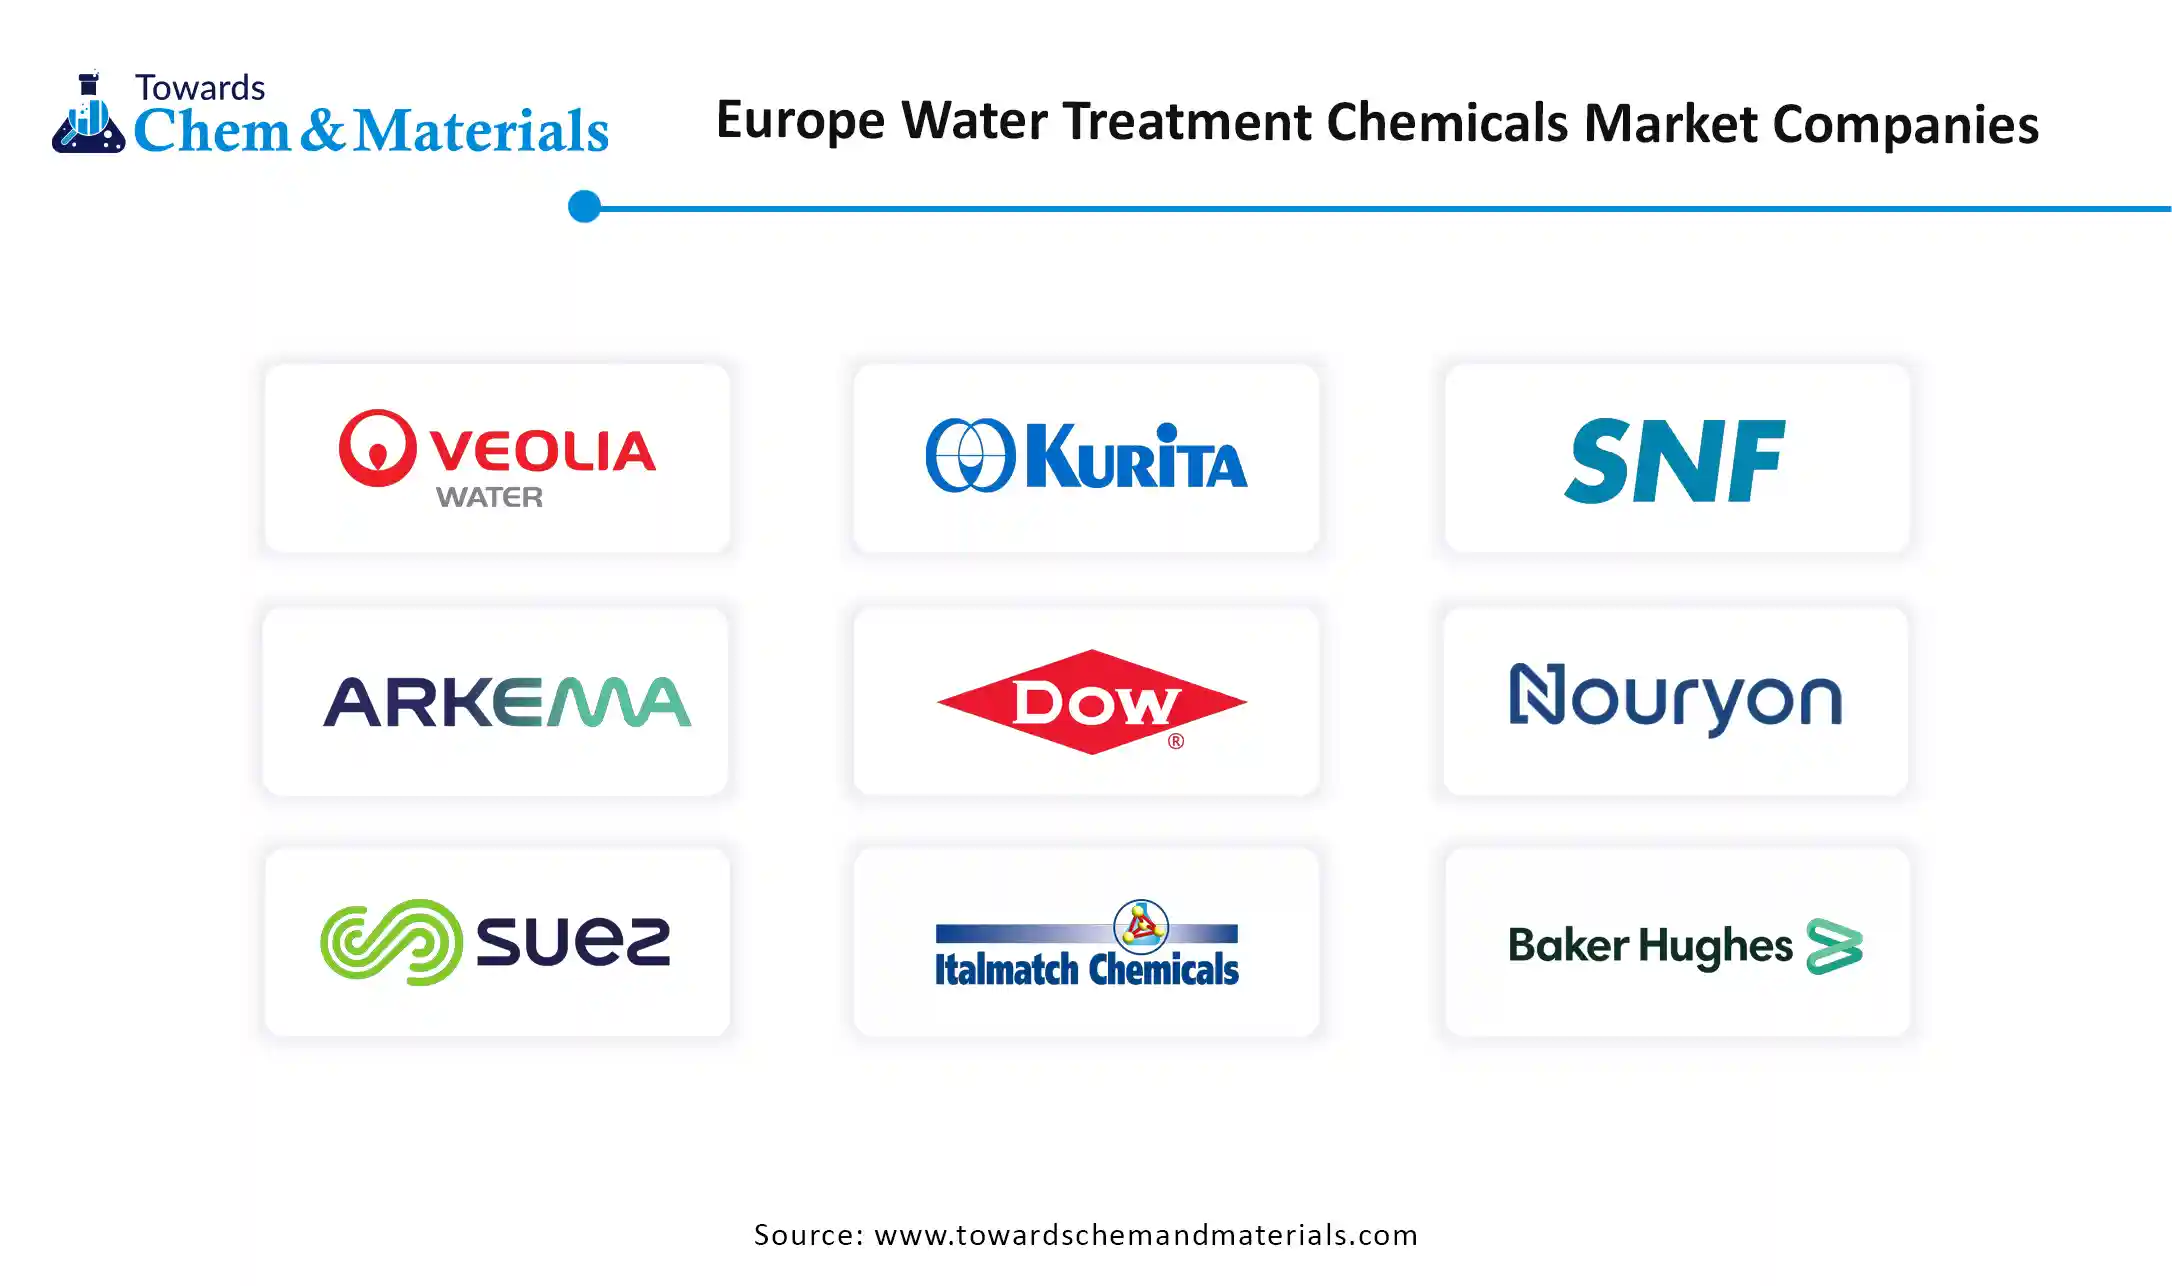
- BASF SE: s a leading chemical company, BASF provides a range of water treatment chemicals, including flocculants and antiscalants, to municipal and industrial customers throughout Europe.
- Ecolab: Through its Nalco Water division, Ecolab is a significant player in the global water treatment chemical market with a strong European presence, providing specialized solutions to a wide array of industries.
- Solenis LLC: A global provider of water and hygiene solutions, offering a broad portfolio of water treatment chemistries and technologies to industries throughout Europe.
- Veolia Water Technologies
- Kurita Europe GmbH
- SNF Floerger
- Arkema S.A.
- Dow Chemical Company
- Nouryon
- SUEZ Group
- Baker Hughes Company
- Italmatch Chemicals S.p.A.
- Solvay S.A.
- Lenntech B.V.
Segments Covered in the Report
By Product Type
- Coagulants & Flocculants
- Aluminum sulfate, ferric chloride, PAC
- Polyacrylamide and cationic polymers
- Corrosion & Scale Inhibitors
- Phosphonates and organophosphates
- Polycarboxylates and azoles
- Biocides & Disinfectants
- Chlorine and chlorine dioxide
- Non-oxidizing biocides and quaternary ammonium compounds
- pH Adjusters & Softeners
- Acids, alkalis, and lime formulations
- Chelating agents (EDTA, NTA)
- Others (Defoamers, oxygen scavengers)
By Application
- Raw Water Treatment
- Clarification and sedimentation aids
- Pre-filtration conditioning chemicals
- Boiler & Cooling Water Treatment
- Scale and corrosion control additives
- Condensate polishing and oxygen scavenging
- Wastewater Treatment
- Coagulation–flocculation and sludge thickening
- Odor control and nutrient removal agents
- Process Water Treatment
- Food-grade and pharmaceutical-grade applications
- CIP (Clean-in-Place) sanitation
By End-Use Industry
- Municipal Water Utilities
- Drinking water and sewage treatment
- Urban wastewater reclamation
- Power Generation
- Thermal plant boiler feedwater
- Cooling tower and condensate systems
- Oil & Gas / Petrochemical
- Refining and produced-water treatment
- Downstream cooling and injection systems
- Food & Beverage
- Ingredient and process water purification
- Effluent management
- Pulp & Paper
- Fiber washing and bleaching stages
- Effluent clarification and reuse
By Source Type
- Freshwater Treatment Chemicals
- Groundwater and surface water conditioning
- Pre-filtration and disinfection systems
- Wastewater & Effluent Treatment Chemicals
- Sludge management and odor control
- Heavy-metal precipitation and flocculation
By Technology Integration
- Manual Chemical Dosing
- Conventional pump and batch dosing systems
- Operator-monitored chemical adjustments
- Automated / Smart Dosing Systems
- Real-time pH and turbidity feedback
- AI-based dosing optimization and leak detection
A Seven-Phase Framework
Our methodology is designed to be universally applicable across commodity chemicals, specialty chemicals, petrochemicals, construction chemicals, coatings, electronic chemicals, industrial gases, agrochemicals, water treatment chemicals, and performance materials. Each phase builds upon the last, creating a layered validation structure that minimizes estimation error and maximizes analytical confidence.
The framework ensures comprehensive market coverage, robust cross-validation, and reliable long-term forecasting — producing market estimates that withstand scrutiny from investors, regulators, and corporate strategy teams.

Seven-Phase Framework — Analytical Effort Distribution
Relative analytical effort allocated across each phase of the Chemicals & Materials research framework

Phase 1 - Secondary Research: Establishing the Foundation
Secondary research collects and evaluates publicly available information from authoritative sources, establishing the foundational understanding of market structure, value chain dynamics, competitive landscape, and end-use demand patterns. Every source is evaluated for credibility, recency, geographic relevance, and methodological soundness before inclusion.
Industry Associations
Sources include ACC, CEFIC, ICCA, JCIA, CPCIF, and SOCMA providing production volumes, consumption trends, capacity developments, and sustainability initiatives.
Company Disclosures
Annual reports, investor presentations, earnings transcripts, and regulatory filings reveal product portfolios, manufacturing footprints, capacity expansions, and revenue segmentation.
Government Databases
National statistical offices, customs authorities, environmental agencies, and industrial production databases provide verified statistics on output, trade flows, and regulatory compliance.
Trade Databases
UN Comtrade, ITC, Eurostat, and national customs authorities enable assessment of global product movement, import dependency, and export competitiveness across regions.
Our Secondary Research Sources
- Ministry of Chemicals and Fertilizers
- European Chemicals Agency
- United States Department of Energy
- Ministry of Industry and Information Technology
- Ministry of Economy Trade and Industry
- Ministry of Trade Industry and Energy
- National Institute of Standards and Technology
- Council of Scientific and Industrial Research
- Fraunhofer Society
- National Institute for Materials Science
Phase 2 — Supply-Side Assessment: Mapping Production Capabilities
Production Capacity Analysis
All major manufacturers are assessed for existing installed capacity, planned additions, expansions, new plant announcements, and technology adoption — mapped at global, regional, and country levels.
Capacity Utilization Adjustment
Installed capacity is adjusted using utilization rates based on demand conditions, feedstock availability, plant operating rates, maintenance schedules, and regulatory restrictions.
Manufacturer Revenue Analysis
Product-specific revenues, segment-level performance, regional distribution, average selling prices, and margin trends are evaluated to establish market value estimates.
Supply-Side Assessment — Capacity vs. Effective Production by Region
Illustrative comparison of installed capacity vs. effective production volume (after utilization rate adjustment) across major regions

Phase 3 — Demand-Side Assessment: Quantifying Chemical Consumption
Demand-side analysis quantifies chemical consumption across industries, applications, and geographies — identifying where and how chemicals are consumed throughout the value chain with precision.
End-Use Industry Analysis
Chemical demand is evaluated across automotive, construction, packaging, electronics, agriculture, healthcare, consumer goods, industrial manufacturing, energy and utilities, and water treatment. Industry output, production trends, and consumption intensity are analyzed to determine demand patterns.
Consumption Modeling
Demand is estimated using measurable indicators: kilograms per vehicle, kilograms per square meter of construction, dosage per cubic meter of water treated, kilograms per hectare of agricultural land, and kilograms per ton of manufactured products. Consumption factors are validated through industry publications and primary interviews.
Application Analysis
The market is segmented by application area to understand product performance requirements, formulation trends, technology adoption, customer preferences, and regulatory requirements improving demand accuracy and segmentation granularity.
Demand-Side Assessment — End-Use Industry Demand Distribution
Illustrative distribution of chemical & materials demand across key end-use industries

Phase 4 - Trade Flow Analysis: Balancing Regional Supply and Demand
Trade flow analysis reconciles regional supply and demand estimates through import and export data, identifying net supply positions, regional dependencies, and market imbalances. It serves as an independent validation layer that tests the consistency of supply-side and demand-side estimates.
Import Analysis
Import data is evaluated to determine volumes, source countries, product dependency, regional supply gaps, and pricing trends — identifying markets that rely heavily on external supply and where domestic production is insufficient to meet demand.
Export Analysis
Export assessments reveal production surplus, export competitiveness, regional manufacturing strength, and global market participation. Export patterns also help validate domestic production estimates and identify net exporting regions.
Apparent Consumption Model
Regional consumption is assessed using the standard apparent consumption formula:
Results identify net importing regions, net exporting regions, regional deficits, and surpluses — serving as an independent validation of supply and demand estimates.
Trade Flow Analysis — Net Supply Position by Region
Illustrative apparent consumption vs. domestic production across major regions — positive gap indicates net import dependency

Phase 5 — Primary Research: The Critical Validation Layer
Primary research tests and refines findings from secondary research through direct engagement with industry participants across the supply chain, demand side, and expert community. It captures intelligence that no database or published report can provide — the real-world experience of manufacturers, buyers, and specialists operating in the market.

Supply-Side Interviews
Conversations with chemical manufacturers, raw material suppliers, contract manufacturers, technology providers, and plant operators cover production trends, capacity utilization, pricing developments, technology shifts, and competitive dynamics.

Demand-Side Interviews
Engagement with OEMs, industrial consumers, procurement managers, distributors, formulators, and end-use manufacturers focuses on consumption trends, purchasing behavior, product substitution, demand outlook, and emerging applications.

Industry Expert Consultations
Additional interviews with industry consultants, independent experts, regulatory specialists, technical professionals, and research institutions provide deeper market context and validate key analytical assumptions.
Focus Areas of Primary Research:
Market Size & Forecast Validation
Revenue estimates, volume consumption, growth rates, forecast assumptions, regional demand.Supply Chain & Value Chain Assessment
Raw material sourcing, supply chain challenges, distribution networks, procurement practices.Production & Capacity Analysis
Manufacturing capacity, utilization rates, expansion projects, plant investments.Pricing & Cost Structure Analysis
Product pricing trends, feedstock costs, energy costs, margin pressures, pricing outlook.Competitive Landscape Assessment
Volume and value estimates confirmed to be fully consistent with one another before publicationInterview Volume by Market Scope
| Study Scope | Number of Interviews |
|---|---|
| Niche Market | 20 – 30 |
| Mid-Sized Market | 30 – 50 |
| Global Market | 50 – 80 |
| Highly Fragmented Market | 80 – 120 |
Interview Details:
Category : Manufacturers, Suppliers, Distributors, End Users, Experts/Associations
Average Duration : 30–60 Minutes
Interview Mode : Video calls, telephonic interviews, expert consultations
Interview Format : Structured / Semi-Structured questionnaire
Focus Areas of Primary Research:
Market Size & Forecast Validation :
Revenue estimates, volume consumption, growth rates, forecast assumptions, regional demand.
Supply Chain & Value Chain Assessment :
Raw material sourcing, supply chain challenges, distribution networks, procurement practices.
Production & Capacity Analysis :
Manufacturing capacity, utilization rates, expansion projects, plant investments.
Pricing & Cost Structure Analysis :
Product pricing trends, feedstock costs, energy costs, margin pressures, pricing outlook.
Competitive Landscape Assessment :
Market share, competitor positioning, strategic initiatives, partnerships, acquisitions.
Primary Research — Stakeholder Coverage by Category
Distribution of interview respondents across stakeholder categories (% share from PPT data)

Primary Research — Respondent Designation Profile
Seniority breakdown of interview respondents (% share from PPT data)

Primary Research — Geographic Coverage of Interviews
Regional distribution of primary research engagement (% share from PPT data)

Phase 6 — Data Triangulation and Market Validation
No single methodology is relied upon in isolation. Multiple independent estimation approaches are combined and reconciled to ensure consistency, accuracy, and analytical defensibility. Any material deviations between approaches are investigated and adjusted through additional validation cycles.
The final market size is derived through weighted triangulation of all validated methodologies. Any material deviations between approaches are investigated and adjusted through additional validation cycles. The outcome represents the most realistic assessment of the market based on available evidence and expert confirmation ensuring that volume and value estimates are fully consistent with one another.
Triangulation Framework — Input Contribution Weight
Relative weight each sizing input contributes to the final reconciled market estimate

Phase 7 — Forecast Modeling: Projecting Future Market Evolution
Forecasting evaluates the future trajectory of the market using a combination of quantitative indicators and qualitative assessments across economic, industry, and regulatory dimensions. Rather than simple extrapolation, each driver is independently modeled and integrated into a composite forecast.
Macroeconomic Indicators
GDP growth, industrial production, manufacturing output, construction activity, consumer spending, and capital investment form the quantitative foundation of long-term demand projections. These are applied at country, regional, and global levels.
Industry Growth Drivers
Urbanization, infrastructure development, industrialization, technological innovation, sustainability initiatives, and evolving product performance requirements are assessed at regional and industry levels — capturing both structural and cyclical demand drivers.
Capacity Expansion Analysis
Announced plant expansions, new manufacturing facilities, technology upgrades, and strategic investments are evaluated to determine future supply-demand dynamics and potential market tightness or oversupply situations.
Regulatory & Sustainability
Environmental regulations, chemical safety standards, emission reduction targets, circular economy initiatives, and sustainability requirements are incorporated as they often influence product adoption rates and market growth trajectories.
Scenario Forecast Range — Indexed Market Growth (Year 1–10)
Illustrative indexed growth trajectories across Base, Optimistic, and Pessimistic scenarios over a 10-year forecast horizon

Forecast Drivers — Relative Impact Score by Category
Impact score (0–100) of each driver type on chemicals & materials market forecast




Comments
Share your thoughts, ask a question, or provide feedback about this report.