
Crop Protection Chemicals Market Size Analysis Report 2035
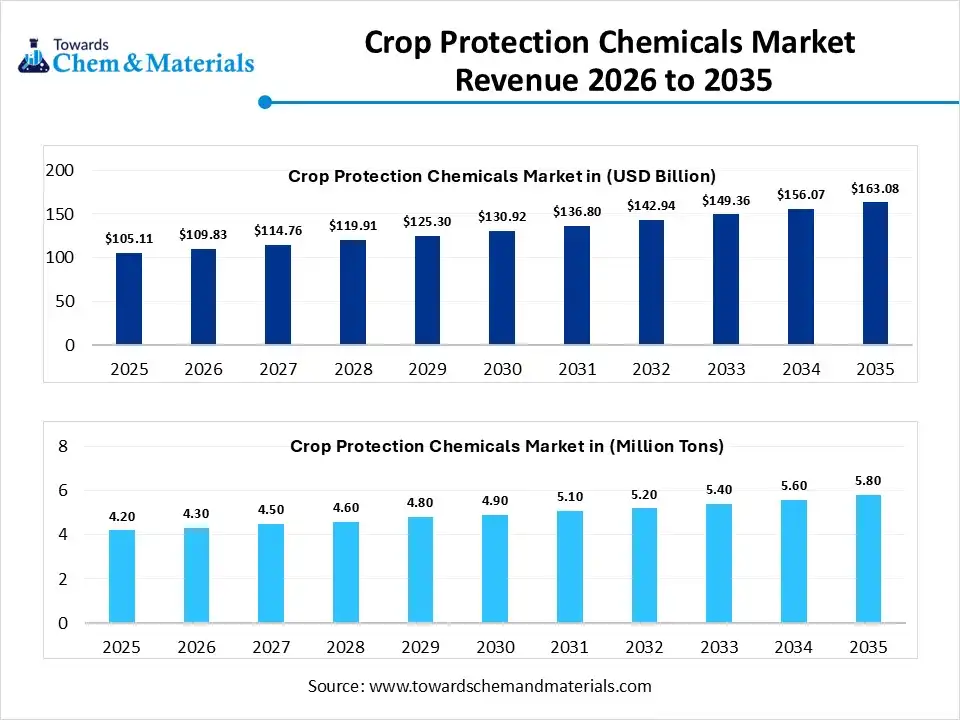
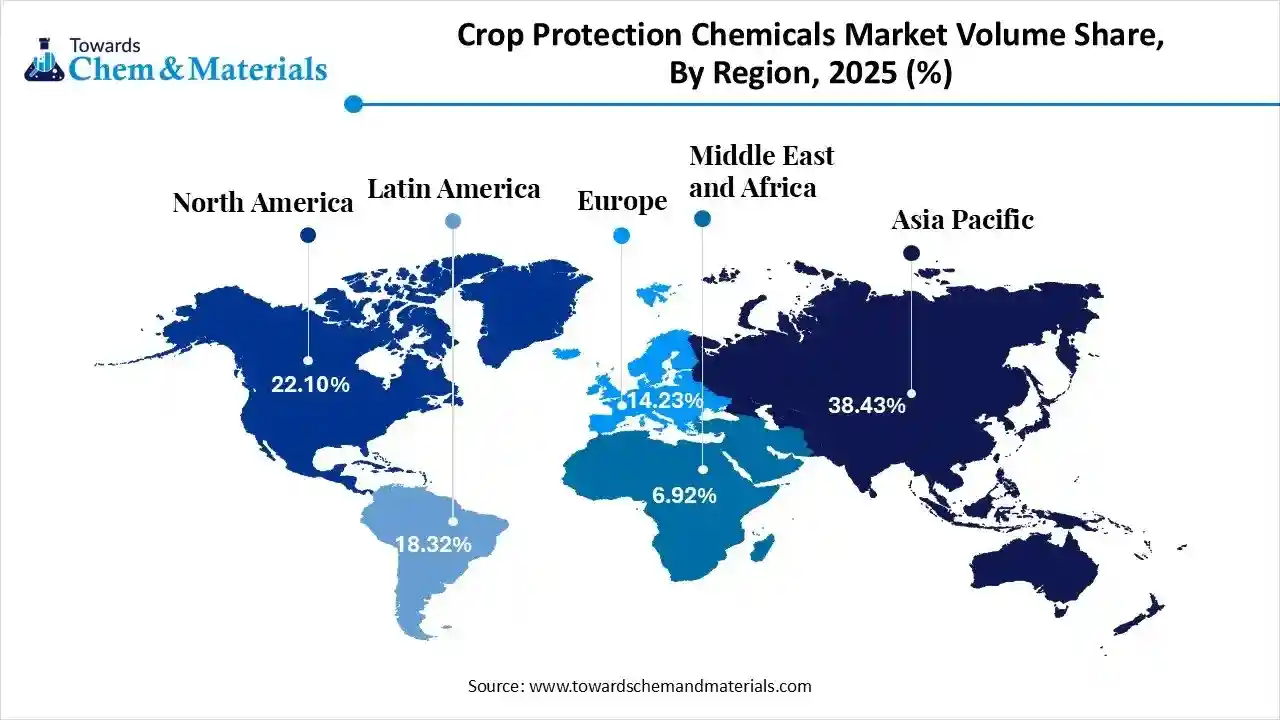
The global crop protection chemicals market size was estimated at USD 105.11 billion in 2025 and is expected to increase from USD 109.83 billion in 2026 to USD 163.08 billion by 2035, growing at a CAGR of 4.49% from 2026 to 2035. In terms of volume, the market is projected to grow from 4.20 million tons in 2025 to 5.80 million tons by 2035. growing at a CAGR of 3.21% from 2026 to 2035. Asia Pacific dominated the crop protection chemicals market with the largest volume share of 38.43% in 2025.
Market Highlights
- The Asia Pacific dominated the global crop protection chemicals market with the largest volume share of 38.43% in 2025.
- The crop protection chemicals market in North America is expected to grow at a substantial CAGR of 3.77% from 2026 to 2035.
- The Latin America polymer nanocomposites market segment accounted for the major volume share of 18.32% in 2025.
- By product type, the herbicide segment dominated the market and accounted for the largest volume share of 48.23% in 2025.
- By product type, the biopesticides segment is expected to grow at the fastest CAGR of 4.47% from 2026 to 2035 in terms of volume.
- By crop type, the cereals and grains segment led the market with the largest revenue volume share of 35.00% in 2025.
- By origin/source, the synthetic chemicals segment dominated the market and accounted for the largest volume share of 75.00% in 2025.
- By mode of application, the foliar spray segment led the market with the largest revenue volume share of 55.3% in 2025.
What are Crop Protection Chemicals?
Crop protection chemicals market growth is driven by a rise in the incidence of diseases & pests, the development of bio-based solutions, growing food demand, the use of modern farming technology, and the focus on maximizing crop yields.
Crop protection chemicals are substances used in agricultural activities to protect crops from weeds, pests, & diseases. They offer benefits like enhancing crop yields, improving the quality of the crop, extending the shelf life of agricultural products, lowering resource use, and helping in conservation. Crop protection chemicals are applied in areas like soil, plants, and storage by using methods like precision farming, spraying, & manual application.
Crop Protection Chemicals Market Trends:
- Sustainability Focus: Growing concern over environmental impact drives demand for bio-pesticides, Integrated Pest Management (IPM), and less toxic chemistries, challenging traditional chemical reliance.
- Precision Agriculture Adoption: Drones, GPS, and variable-rate applicators allow for targeted chemical use, cutting waste and improving efficacy.
- Climate Change Impact: Warmer, shifting weather patterns create new pest pressures, increasing the need for effective crop protection.
- Technological Innovation: New chemical formulations, biological treatments, and digital tools are reshaping the market.
- Rising Food Demand: The need to feed a growing global population and improve crop yields remains a primary market driver.
Report Scope
| Report Attribute | Details |
| Market Size and Volume in 2026 | USD 109.83 Billion / 4.3 Million Tons |
| Revenue Forecast in 2035 | USD 163.08 Billion / 5.8 Million Tons |
| Growth Rate | CAGR 4.49% |
| Forecast Period | 2026 - 2035 |
| Base Year | 2025 |
| Units Considered | Value (Billion / Million), Volume (Million Tons) |
| Dominant Region | Asia Pacific |
| Segment Covered | By Product Type, By Crop Type, By Origin/Source, By Mode of Application, By Regions |
| Key companies profiled | BASF SE, Dow Chemical, Sumitomo Chemical Co. Ltd,Bayer Cropscience AG, Nufarm Limited, Adama Agricultural Solutions Ltd., Arysta Lifesciences Corporation, America Vanguard Corporation, Jiangsu Yangnong Chemical Group Co. Ltd, Corteva, Syngenta Group, FMC Corporation |
Trade Analysis Of Crop Protection Chemicals Market: Import & Export Statistics
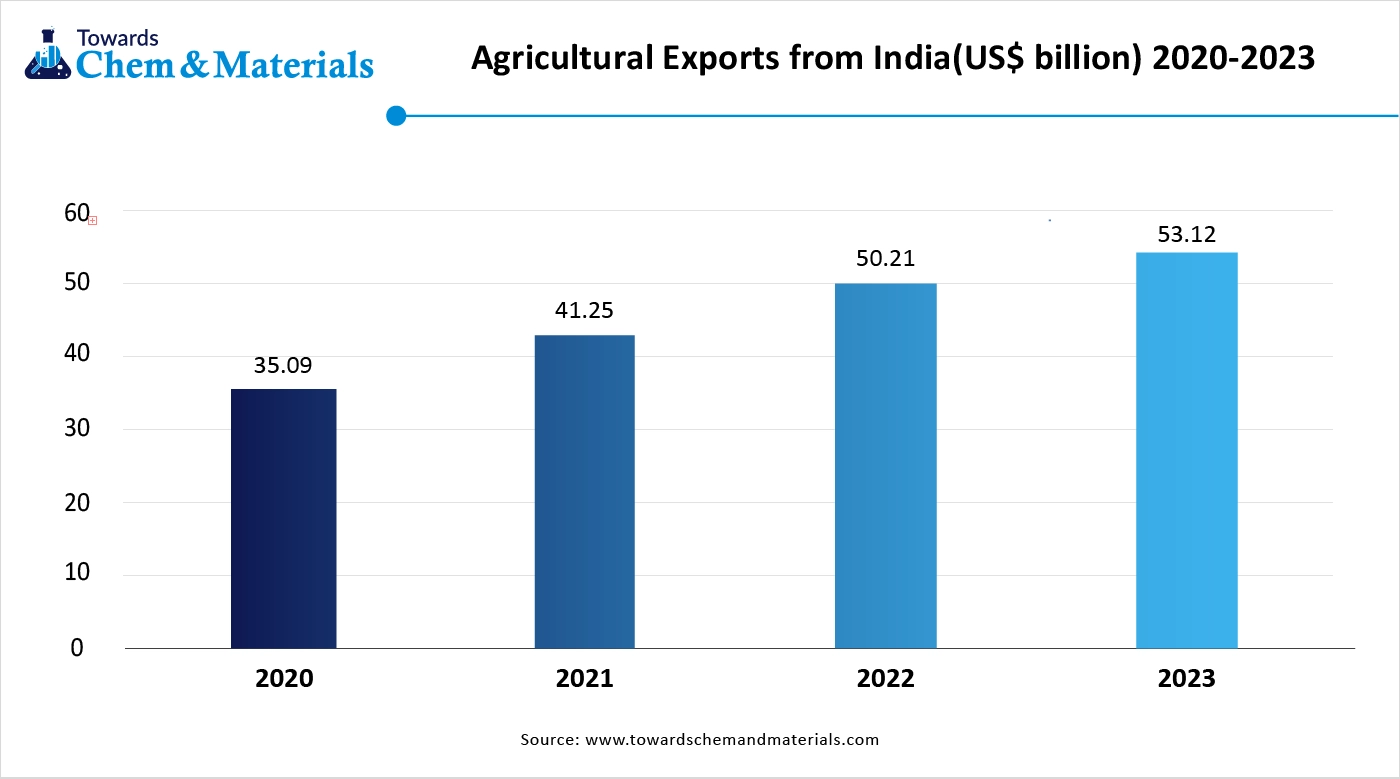
- According to India Export data, India shipped 40 units of Crop Protection from March 2024 to February 2025 (TTM). These shipments were sent by 11 Indian exporters to 15 buyers, reflecting a 90% increase compared to the previous twelve months.
- Most Indian Crop Protection exports go to Russia, Nigeria, and Vietnam.
- Globally, the top three Crop Protection exporters are the United States, China, and Russia. The United States leads with 1,075 shipments, followed by China with 950 shipments and Russia with 135 shipments.
- Based on Global Export data, the world exported 3,573 shipments of Crop Protection. These were made by 387 exporters to 361 buyers.
- Most global Crop Protection exports go to Uzbekistan, Russia, and Brazil.
Crop Protection Chemicals Market Value Chain Analysis
- Chemical Formulation and Processing: Crop protection chemicals are developed through processes such as active ingredient synthesis, fermentation, formulation blending, granulation or emulsification, encapsulation, and packaging to produce herbicides, insecticides, fungicides, and bio-pesticides.
- Key players: Bayer AG, Syngenta Group, BASF SE, Corteva Agriscience
- Quality Testing and Certification: Crop protection chemicals require certifications ensuring efficacy, safety, environmental compliance, and regulatory approval. Key certifications include GLP compliance, ISO quality standards, EPA and EU regulatory registrations, FAO/WHO pesticide specifications, and residue testing standards.
- Key players: EPA (U.S. Environmental Protection Agency), FAO, WHO, ISO (International Organization for Standardization), TÜV SÜD.
- Distribution to Industrial Users: Crop protection chemicals are distributed to agricultural producers, commercial farming operations, agrochemical distributors, cooperatives, and government-supported agrarian programs.
- Key players: UPL Limited, FMC Corporation, Nufarm Limited
Crop Protection Chemicals Regulatory Landscape: Global Regulations
| Country / Region | Regulatory Body | Key Regulations | Focus Areas | Notable Notes |
| North America (USA & Canada) | U.S. Environmental Protection Agency (EPA) Health Canada – PMRA |
FIFRA (Federal Insecticide, Fungicide, and Rodenticide Act) FFDCA (Food, Drug & Cosmetic Act) Canadian Pest Control Products Act (PCPA) |
Pesticide registration & re-registration Residue limits (MRLs) Environmental & human health risk assessment |
EPA conducts periodic re-evaluation of active ingredients, a data-intensive registration process. Canada’s PMRA closely aligns with U.S. and OECD risk assessment frameworks. |
| Europe | European Commission European Food Safety Authority (EFSA) ECHA |
Regulation (EC) No 1107/2009 Regulation (EC) No 396/2005 (MRLs) REACH & CLP (for co-formulants) |
Active substance approval Residue control & food safety Hazard-based cut-off criteria |
The EU applies hazard-based bans (e.g., endocrine disruptors). One of the strictest regimes globally; several active ingredients face non-renewal. |
| Asia Pacific | China ICAMA / MEE India CIBRC Japan MAFF Australia APVMA |
China Pesticide Administration Regulation Insecticides Act, 1968 (India) Agricultural Chemicals Regulation (Japan) Agvet Code (Australia) |
Product registration & labeling Import/export control Environmental and residue safety |
China has strengthened environmental compliance and data requirements. India is transitioning to stricter pesticide management rules with digital registration systems. |
| South America | Brazil ANVISA / IBAMA / MAPA Argentina SENASA Mexico COFEPRIS |
Brazil Pesticide Law (Law No. 7,802) National pesticide registration laws |
Product approval & toxicology review Environmental impact assessment Worker and consumer safety |
Brazil is one of the fastest-growing markets, but under increased scrutiny for environmental and health risks. Regulatory reforms are ongoing. |
| Middle East & Africa | Saudi SFDA UAE MOCCAE South Africa DALRRD |
National pesticide registration frameworks FAO/WHO Codex alignment |
Import approval & registration Residue limits & labeling Environmental safety |
Many countries rely on the FAO/WHO Codex standards. Registration timelines vary widely; import permits are critical for market access. |
Market Opportunity
Growing Agriculture Sector Drives Expansion of the Market
The growing population and expansion of the agriculture sector across various regions increase demand for crop protection chemicals. The higher demand for food and focus on the maximization of crop yields requires fungicides, insecticides, & herbicides. The increasing rate of diseases, pests, & weeds on crops, and the adoption of modern agricultural practices, require crop protection chemicals.
The increasing preference for high-value crops like vegetables & fruits and modernization in agricultural practices require crop protection chemicals. The changing dietary preferences and strong government support for sustainable agricultural practices increase demand for crop protection chemicals. The growing agriculture sector creates an opportunity for the growth of the crop protection chemicals market.
Market Challenge
High R&D Cost Creates Hurdles in Market Growth
Despite several benefits of crop protection chemicals in agricultural practices, the high R&D costs restrict market growth. Factors like complex regulatory processes, focus on product safety, discovery of new active ingredients, and comprehensive testing increase the cost.
The extensive safety evaluations and lengthy regulatory processes require a high cost. The long development process and manufacturing of environmentally friendly products require a high cost. The complex process for the development of active ingredients increases the cost. The high R&D cost hampers the growth of the crop protection chemicals market.
Segmental Insights
Product Type Insights
How Did The Product Type Segment Dominate The Crop Protection Chemicals Market In 2025?
The herbicides segment volume was valued at 2.0 million tons in 2025 and is projected to reach 2.7 million tons by 2035, expanding at a CAGR of 3.06% during the forecast period from 2025 to 2035. the herbicides segment dominated the market with a share of 48.23% in 2025. Herbicides account for a significant share of the market due to their widespread use in controlling weeds that compete with crops for nutrients, water, and sunlight. Both selective and non-selective herbicides are increasingly used across cereals, oilseeds, and plantation crops.
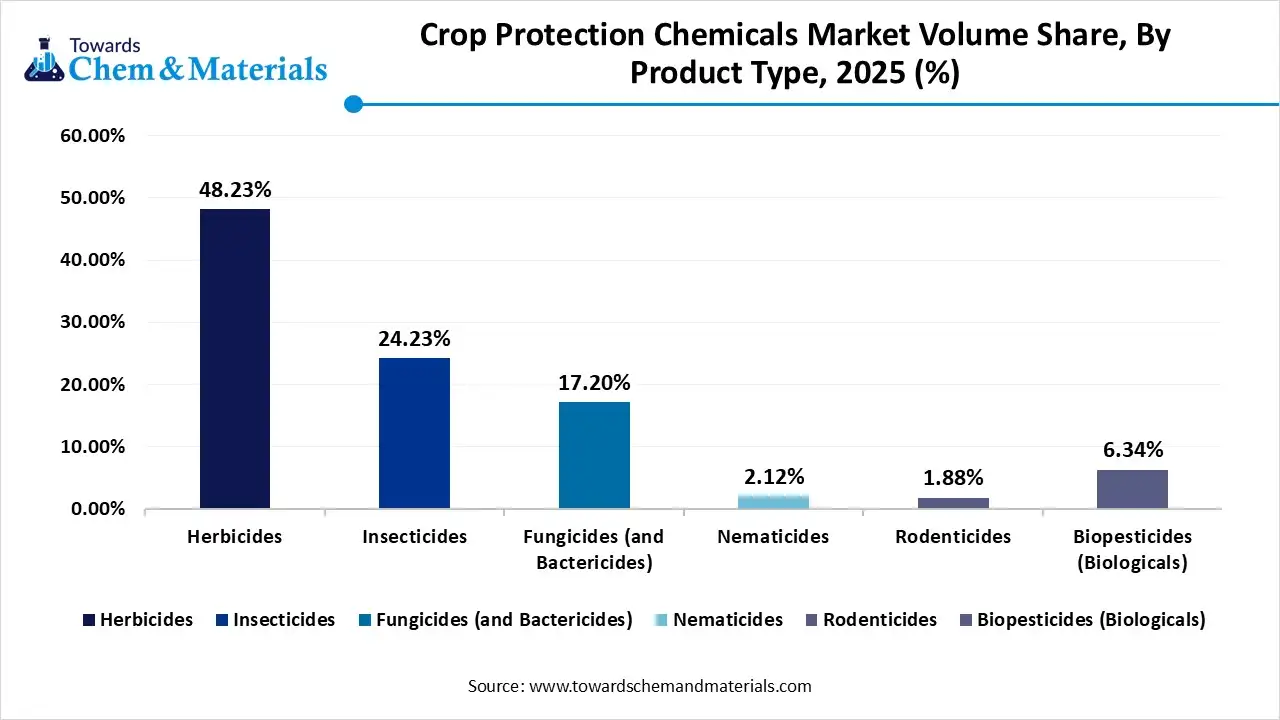
The biopesticides segment volume was valued at 0.3 million tons in 2025 and is expected to surpass around 0.4 million tons by 2035, and it is anticipated to expand to 4.47% of CAGR during 2026 to 2035. the Bio pesticides are gaining strong traction as sustainable alternatives to conventional chemical pesticides, driven by regulatory restrictions, residue concerns, and growing demand for organic and residue-free food. Derived from natural sources are increasingly used in integrated pest management programs. Adoption is particularly strong in horticulture and high-value crop cultivation.
Crop Protection Chemicals Market Volume and Share, By Product Type, 2025-2035
| By Product Type | Market Volume Share (%), 2025 | Market Volume (Million Tons)2025 | Market Volume (Million Tons)2035 | CAGR(%) 2026-2035 | Market Volume Share (%), 2035 |
| Herbicides | 48.23% | 2.0 | 2.7 | 3.06% | 46.11% |
| Insecticides | 24.23% | 1.0 | 1.4 | 3.87% | 24.87% |
| Fungicides (and Bactericides) | 17.20% | 0.7 | 1.0 | 4.10% | 18.01% |
| Nematicides | 2.12% | 0.1 | 0.1 | 4.05% | 2.21% |
| Rodenticides | 1.88% | 0.1 | 0.1 | 3.99% | 1.95% |
| Biopesticides (Biologicals) | 6.34% | 0.3 | 0.4 | 4.47% | 6.85% |
Crop Type Insights
Which Crop Type Segment Dominates The Crop Protection Chemicals Market In 2025?
The cereals & grains segment dominated the market with a share of 35% in 2025. Cereals and grains represent a major application segment for crop protection chemicals due to their large cultivated area and critical role in global food security. Herbicides, fungicides, and insecticides are extensively used to protect crops from weeds, pests, and diseases. Yield optimization and resistance management are key factors influencing chemical usage in this segment.
The fruits & vegetables segment is projected to grow at the fastest CAGR between 2026 and 2035 in the market. The fruits and vegetables segment relies heavily on crop protection chemicals to maintain quality, appearance, and shelf life. High susceptibility to pests and diseases, combined with strict quality standards for export markets, drives demand for both synthetic and biological solutions. Growers increasingly adopt targeted and low-residue products to meet food safety regulations and consumer expectations.
Origin/Source Insights
How Did the Synthetic Chemicals Segment Dominate The Crop Protection Chemicals Market In 2025?
The synthetic chemicals segment dominated the market with a share of 75% in 2025. Synthetic chemicals continue to dominate the market due to their high efficacy, broad-spectrum action, and cost-effectiveness. These products offer reliable pest and weed control across diverse climatic and agronomic conditions. Despite regulatory pressure, synthetic solutions remain widely used, particularly in large-scale farming, where consistent performance and scalability are critical.
The biologicals segment is projected to grow at the fastest CAGR between 2026 and 2035 in the market. Biological crop protection products are witnessing rapid growth owing to increasing environmental awareness and regulatory support for eco-friendly agricultural inputs. Adoption is rising in sustainable farming systems, greenhouse cultivation, and export-oriented agriculture, supported by advancements in formulation and shelf-life stability.
Mode of Application Insights
Which Mode Of Application Segment Dominates the Crop Protection Chemicals Market In 2025?
The foliar spray segment dominated the market with a share of 55.3 % in 2025. Foliar spray is the most widely used mode of application in the crop protection chemicals market, offering direct and rapid action against pests, weeds, and diseases. It allows precise targeting of affected plant parts and is compatible with a wide range of chemical and biological products. Technological advancements in spraying equipment are improving efficiency and reducing chemical wastage.
The seed treatment segment is projected to grow at the fastest CAGR between 2026 and 2035 in the market. Seed treatment is an increasingly important application method, providing early-stage protection against soil-borne pests and diseases. This method enhances seed vigor, improves germination rates, and reduces the need for multiple foliar applications later in the crop cycle. Growing awareness of cost efficiency and environmental benefits is driving adoption among farmers and seed companies.
Regional Insights
The Asia Pacific crop protection chemicals market size was valued at USD 40.39 billion in 2025 and is expected to be worth around USD 62.67 billion by 2035, exhibiting at a compound annual growth rate (CAGR) of 4.51% over the forecast period from 2026 to 2035.
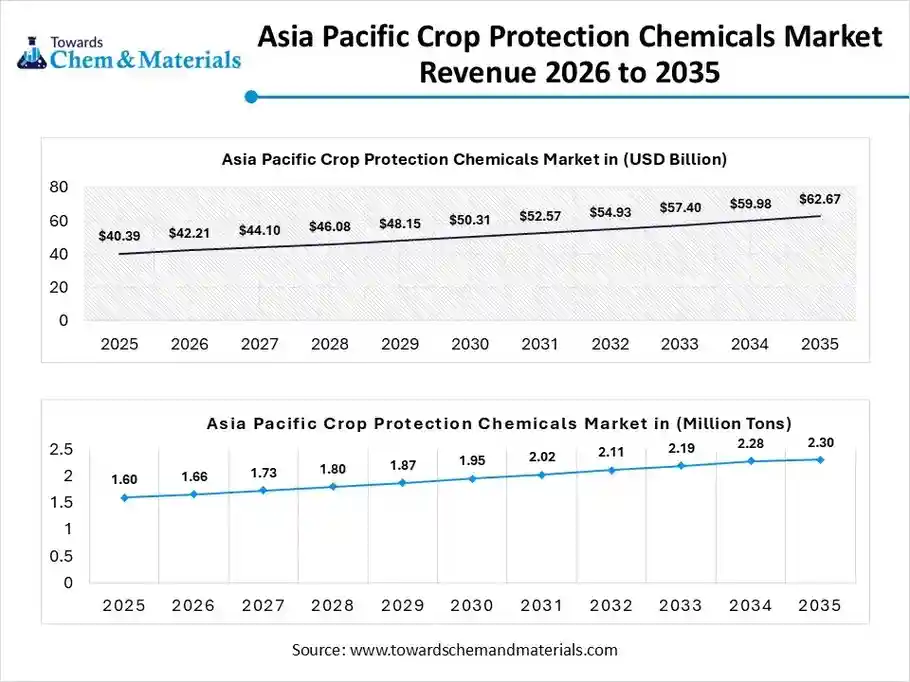
The Asia Pacific crop protection chemicals market volume was estimated at 1.6 million tons in 2025 and is projected to reach 2.3 million tons by 2035, growing at a CAGR of 4.00% from 2026 to 2035. Asia Pacific dominated the market with a share of 38.43% in 2025. The Asia Pacific market is driven by intensive agricultural practices, rising food demand from a large population base, and increasing adoption of modern farming inputs. Rapid commercialization of agriculture, growing use of herbicides and insecticides, and government initiatives supporting crop yield enhancement continue to support strong regional demand across cereals, fruits, and cash crops.
India: Crop Protection Chemicals Market
India represents a key market within Asia Pacific due to its vast agricultural land, dependence on monsoon-driven farming, and high pest pressure across crop cycles. Increasing awareness among farmers, expanding use of fungicides and bio-based crop protection products, and supportive government schemes for agricultural productivity are steadily driving market growth in the country.
North America's Growing Adoption Drives The Growth Of The Market
The North America crop protection chemicals market volume was estimated at 0.9 million tons in 2025 and is projected to reach 1.3 million tons by 2035, growing at a CAGR of 3.77% from 2026 to 2035. North America is a mature and technologically advanced market, characterized by high adoption of precision farming and integrated pest management practices. Strong demand for herbicides and fungicides in large-scale commercial farming, along with continuous innovation in formulation technologies and regulatory-approved active ingredients, supports stable market expansion across the region.
Crop Protection Chemicals Market Volume and Share, By Region, 2025-2035
| By Region | Market Volume Share (%), 2025 | Market Volume (Million Tons)2025 | Market Volume (Million Tons)2035 | CAGR(%) 2026-2035 | Market Volume Share (%), 2035 |
| North America | 22.10% | 0.9 | 1.3 | 3.77% | 22.48% |
| Europe | 14.23% | 0.6 | 0.8 | 2.89% | 13.41% |
| Asia Pacific | 38.43% | 1.6 | 2.3 | 4.00% | 39.89% |
| Latin America | 18.32% | 0.8 | 1.1 | 3.73% | 18.57% |
| Middle East & Africa | 6.92% | 0.3 | 0.3 | 1.27% | 5.65% |
United States: Crop Protection Chemicals Market
The United States dominates the North American market due to the large-scale cultivation of corn, soybeans, and wheat. High mechanization levels, strong presence of leading agrochemical manufacturers, and widespread use of advanced chemical and biological crop protection solutions drive consistent demand across conventional and genetically modified crop systems.
Europe's Growth Of The Crop Protection Chemicals Market Is Driven By Sustainability Initiatives
The Europe crop protection chemicals market volume was estimated at 0.6 million tons in 2025 and is projected to reach 0.8 million tons by 2035, growing at a CAGR of 2.89% from 2026 to 2035. Europe’s crop protection chemicals market is shaped by stringent environmental regulations and a growing shift toward sustainable and low-toxicity solutions. While regulatory pressure limits certain chemical actives, demand remains steady due to intensive farming, high crop value, and increasing adoption of integrated pest management and bio-based crop protection products.
Germany: Crop Protection Chemicals Market
Germany plays a significant role in the European market, supported by advanced agricultural practices and a strong emphasis on regulatory compliance. The country demonstrates growing demand for fungicides and specialty crop protection chemicals, particularly in cereals and horticulture, alongside increasing adoption of environmentally safer and precision-applied formulations.
Latin America's Growth In The Market Is Driven By The Strong Demand For The Product
The Latin America crop protection chemicals market volume was estimated at 0.8 million tons in 2025 and is projected to reach 1.1 million tons by 2035, growing at a CAGR of 3.73% from 2026 to 2035. Latin America is a high-growth region for crop protection chemicals, driven by large-scale cultivation of soybeans, maize, and sugarcane. Favorable climatic conditions, high pest incidence, and export-oriented agriculture fuel strong demand for herbicides, insecticides, and fungicides, making the region strategically important for global agrochemical suppliers.
Brazil: Crop Protection Chemicals Market
Brazil is the largest crop protection chemicals market in South America, supported by expansive farmland and intensive row-crop farming. High pest resistance challenges, multiple crop cycles per year, and strong adoption of chemical and biological crop protection products continue to drive sustained market growth across major agricultural states.
Middle East & Africa: Rising Farming Practices Drive Growth Of The Market
The Middle East & Africa crop protection chemicals market volume was estimated at 0.3 million tons in 2025 and is projected to reach 0.3 million tons by 2035, growing at a CAGR of 1.27% from 2026 to 2035.The Middle East & Africa crop protection chemicals market is developing steadily, supported by improving agricultural infrastructure and increasing focus on food security. Demand is driven by pest management needs in arid and semi-arid climates, rising commercial farming, and the gradual adoption of modern crop protection inputs across key producing regions.
South Africa: Crop Protection Chemicals Market
South Africa serves as a key market within the MEA region, with well-developed commercial agriculture and diversified crop production. Demand for herbicides and fungicides remains strong, particularly in grains, fruits, and vineyards, supported by modern farming practices and increasing awareness of crop yield optimization.
Recent Developments
- In December 2025, Corteva Agriscience and Hexagon Bio announced a multi-million-dollar joint venture aimed at accelerating the discovery and development of nature-inspired crop protection solutions.(Source: www.indianchemicalnews.com)
- In May 2025, BASF India introduced Valexio® Insecticide and Mibelya® Fungicide in India, marking the global debut of these crop protection products designed for Indian rice farmers. These solutions aim to enhance national food security and boost rice productivity. (Source: chemindigest.com)
- In October 2025, Sumitomo Chemical announced a reorganization of its U.S. group companies, Valent BioSciences LLC (VBS), McLaughlin Gormley King Company (MGK), and Valent North America LLC (VNA) into Sumitomo Biorational Company LLC (SBC) to create a global hub for its biorational business. This initiative aims to enhance sustainable agriculture by streamlining the research, manufacturing, and sales of biorational products into a unified global structure.(Source: fareasternagriculture.com)
Market Companies
- BASF SE: The largest producer of chemicals consists of a product portfolio including herbicides, seed treatment, biosolutions, fungicides, and insecticides.
- Dow Chemical: The multinational material science company focuses on formulators & specialty additives for agrochemical products, and the company's product portfolio consists of more than 35 crop protection products.
- Sumitomo Chemical Co. Ltd: The Japan-based chemical company offers biological & chemical fungicides, plant growth regulators, insecticides, & herbicides.
- Bayer Cropscience AG: The global life science company offers biological and chemical crop protection solutions.
- Nufarm Limited: The Australian Company offers a product portfolio of insecticides, seed treatments, herbicides, and fungicides.
- Adama Agricultural Solutions Ltd.
- Arysta Lifesciences Corporation
- America Vanguard Corporation
- Jiangsu Yangnong Chemical Group Co. Ltd
- Corteva
- Syngenta Group
- FMC Corporation
Segments Covered
By Product Type
- Herbicides
- Insecticides
- Fungicides (and Bactericides)
- Nematicides
- Rodenticides
- Biopesticides (Biologicals)
- Bioherbicides
- Bioinsecticides
- Biofungicides
By Crop Type
- Cereals & Grains
- Fruits & Vegetables
- Oilseeds & Pulses
- Commercial Crops (e.g., Cotton, Sugarcane)
- Turf & Ornamental
By Origin/Source
- Synthetic Chemicals
- Biologicals (Bio-based)
By Mode of Application
- Foliar Spray
- Seed Treatment
- Soil Treatment
- Others (e.g., Fumigation, Chemigation)
By Region
- North America
- U.S.
- Canada
- Europe
- Germany
- UK
- France
- Italy
- Spain
- Sweden
- Denmark
- Norway
- Asia Pacific
- China
- Japan
- India
- South Korea
- Thailand
- Latin America
- Brazil
- Mexico
- Argentina
- Middle East & Africa
- South Africa
- UAE
- Saudi Arabia
- Kuwait
A Seven-Phase Framework
Our methodology is designed to be universally applicable across commodity chemicals, specialty chemicals, petrochemicals, construction chemicals, coatings, electronic chemicals, industrial gases, agrochemicals, water treatment chemicals, and performance materials. Each phase builds upon the last, creating a layered validation structure that minimizes estimation error and maximizes analytical confidence.
The framework ensures comprehensive market coverage, robust cross-validation, and reliable long-term forecasting — producing market estimates that withstand scrutiny from investors, regulators, and corporate strategy teams.

Seven-Phase Framework — Analytical Effort Distribution
Relative analytical effort allocated across each phase of the Chemicals & Materials research framework

Phase 1 - Secondary Research: Establishing the Foundation
Secondary research collects and evaluates publicly available information from authoritative sources, establishing the foundational understanding of market structure, value chain dynamics, competitive landscape, and end-use demand patterns. Every source is evaluated for credibility, recency, geographic relevance, and methodological soundness before inclusion.
Industry Associations
Sources include ACC, CEFIC, ICCA, JCIA, CPCIF, and SOCMA providing production volumes, consumption trends, capacity developments, and sustainability initiatives.
Company Disclosures
Annual reports, investor presentations, earnings transcripts, and regulatory filings reveal product portfolios, manufacturing footprints, capacity expansions, and revenue segmentation.
Government Databases
National statistical offices, customs authorities, environmental agencies, and industrial production databases provide verified statistics on output, trade flows, and regulatory compliance.
Trade Databases
UN Comtrade, ITC, Eurostat, and national customs authorities enable assessment of global product movement, import dependency, and export competitiveness across regions.
Our Secondary Research Sources
- Ministry of Chemicals and Fertilizers
- European Chemicals Agency
- United States Department of Energy
- Ministry of Industry and Information Technology
- Ministry of Economy Trade and Industry
- Ministry of Trade Industry and Energy
- National Institute of Standards and Technology
- Council of Scientific and Industrial Research
- Fraunhofer Society
- National Institute for Materials Science
Phase 2 — Supply-Side Assessment: Mapping Production Capabilities
Production Capacity Analysis
All major manufacturers are assessed for existing installed capacity, planned additions, expansions, new plant announcements, and technology adoption — mapped at global, regional, and country levels.
Capacity Utilization Adjustment
Installed capacity is adjusted using utilization rates based on demand conditions, feedstock availability, plant operating rates, maintenance schedules, and regulatory restrictions.
Manufacturer Revenue Analysis
Product-specific revenues, segment-level performance, regional distribution, average selling prices, and margin trends are evaluated to establish market value estimates.
Supply-Side Assessment — Capacity vs. Effective Production by Region
Illustrative comparison of installed capacity vs. effective production volume (after utilization rate adjustment) across major regions

Phase 3 — Demand-Side Assessment: Quantifying Chemical Consumption
Demand-side analysis quantifies chemical consumption across industries, applications, and geographies — identifying where and how chemicals are consumed throughout the value chain with precision.
End-Use Industry Analysis
Chemical demand is evaluated across automotive, construction, packaging, electronics, agriculture, healthcare, consumer goods, industrial manufacturing, energy and utilities, and water treatment. Industry output, production trends, and consumption intensity are analyzed to determine demand patterns.
Consumption Modeling
Demand is estimated using measurable indicators: kilograms per vehicle, kilograms per square meter of construction, dosage per cubic meter of water treated, kilograms per hectare of agricultural land, and kilograms per ton of manufactured products. Consumption factors are validated through industry publications and primary interviews.
Application Analysis
The market is segmented by application area to understand product performance requirements, formulation trends, technology adoption, customer preferences, and regulatory requirements improving demand accuracy and segmentation granularity.
Demand-Side Assessment — End-Use Industry Demand Distribution
Illustrative distribution of chemical & materials demand across key end-use industries

Phase 4 - Trade Flow Analysis: Balancing Regional Supply and Demand
Trade flow analysis reconciles regional supply and demand estimates through import and export data, identifying net supply positions, regional dependencies, and market imbalances. It serves as an independent validation layer that tests the consistency of supply-side and demand-side estimates.
Import Analysis
Import data is evaluated to determine volumes, source countries, product dependency, regional supply gaps, and pricing trends — identifying markets that rely heavily on external supply and where domestic production is insufficient to meet demand.
Export Analysis
Export assessments reveal production surplus, export competitiveness, regional manufacturing strength, and global market participation. Export patterns also help validate domestic production estimates and identify net exporting regions.
Apparent Consumption Model
Regional consumption is assessed using the standard apparent consumption formula:
Results identify net importing regions, net exporting regions, regional deficits, and surpluses — serving as an independent validation of supply and demand estimates.
Trade Flow Analysis — Net Supply Position by Region
Illustrative apparent consumption vs. domestic production across major regions — positive gap indicates net import dependency

Phase 5 — Primary Research: The Critical Validation Layer
Primary research tests and refines findings from secondary research through direct engagement with industry participants across the supply chain, demand side, and expert community. It captures intelligence that no database or published report can provide — the real-world experience of manufacturers, buyers, and specialists operating in the market.

Supply-Side Interviews
Conversations with chemical manufacturers, raw material suppliers, contract manufacturers, technology providers, and plant operators cover production trends, capacity utilization, pricing developments, technology shifts, and competitive dynamics.

Demand-Side Interviews
Engagement with OEMs, industrial consumers, procurement managers, distributors, formulators, and end-use manufacturers focuses on consumption trends, purchasing behavior, product substitution, demand outlook, and emerging applications.

Industry Expert Consultations
Additional interviews with industry consultants, independent experts, regulatory specialists, technical professionals, and research institutions provide deeper market context and validate key analytical assumptions.
Focus Areas of Primary Research:
Market Size & Forecast Validation
Revenue estimates, volume consumption, growth rates, forecast assumptions, regional demand.Supply Chain & Value Chain Assessment
Raw material sourcing, supply chain challenges, distribution networks, procurement practices.Production & Capacity Analysis
Manufacturing capacity, utilization rates, expansion projects, plant investments.Pricing & Cost Structure Analysis
Product pricing trends, feedstock costs, energy costs, margin pressures, pricing outlook.Competitive Landscape Assessment
Volume and value estimates confirmed to be fully consistent with one another before publicationInterview Volume by Market Scope
| Study Scope | Number of Interviews |
|---|---|
| Niche Market | 20 – 30 |
| Mid-Sized Market | 30 – 50 |
| Global Market | 50 – 80 |
| Highly Fragmented Market | 80 – 120 |
Interview Details:
Category : Manufacturers, Suppliers, Distributors, End Users, Experts/Associations
Average Duration : 30–60 Minutes
Interview Mode : Video calls, telephonic interviews, expert consultations
Interview Format : Structured / Semi-Structured questionnaire
Focus Areas of Primary Research:
Market Size & Forecast Validation :
Revenue estimates, volume consumption, growth rates, forecast assumptions, regional demand.
Supply Chain & Value Chain Assessment :
Raw material sourcing, supply chain challenges, distribution networks, procurement practices.
Production & Capacity Analysis :
Manufacturing capacity, utilization rates, expansion projects, plant investments.
Pricing & Cost Structure Analysis :
Product pricing trends, feedstock costs, energy costs, margin pressures, pricing outlook.
Competitive Landscape Assessment :
Market share, competitor positioning, strategic initiatives, partnerships, acquisitions.
Primary Research — Stakeholder Coverage by Category
Distribution of interview respondents across stakeholder categories (% share from PPT data)

Primary Research — Respondent Designation Profile
Seniority breakdown of interview respondents (% share from PPT data)

Primary Research — Geographic Coverage of Interviews
Regional distribution of primary research engagement (% share from PPT data)

Phase 6 — Data Triangulation and Market Validation
No single methodology is relied upon in isolation. Multiple independent estimation approaches are combined and reconciled to ensure consistency, accuracy, and analytical defensibility. Any material deviations between approaches are investigated and adjusted through additional validation cycles.
The final market size is derived through weighted triangulation of all validated methodologies. Any material deviations between approaches are investigated and adjusted through additional validation cycles. The outcome represents the most realistic assessment of the market based on available evidence and expert confirmation ensuring that volume and value estimates are fully consistent with one another.
Triangulation Framework — Input Contribution Weight
Relative weight each sizing input contributes to the final reconciled market estimate

Phase 7 — Forecast Modeling: Projecting Future Market Evolution
Forecasting evaluates the future trajectory of the market using a combination of quantitative indicators and qualitative assessments across economic, industry, and regulatory dimensions. Rather than simple extrapolation, each driver is independently modeled and integrated into a composite forecast.
Macroeconomic Indicators
GDP growth, industrial production, manufacturing output, construction activity, consumer spending, and capital investment form the quantitative foundation of long-term demand projections. These are applied at country, regional, and global levels.
Industry Growth Drivers
Urbanization, infrastructure development, industrialization, technological innovation, sustainability initiatives, and evolving product performance requirements are assessed at regional and industry levels — capturing both structural and cyclical demand drivers.
Capacity Expansion Analysis
Announced plant expansions, new manufacturing facilities, technology upgrades, and strategic investments are evaluated to determine future supply-demand dynamics and potential market tightness or oversupply situations.
Regulatory & Sustainability
Environmental regulations, chemical safety standards, emission reduction targets, circular economy initiatives, and sustainability requirements are incorporated as they often influence product adoption rates and market growth trajectories.
Scenario Forecast Range — Indexed Market Growth (Year 1–10)
Illustrative indexed growth trajectories across Base, Optimistic, and Pessimistic scenarios over a 10-year forecast horizon

Forecast Drivers — Relative Impact Score by Category
Impact score (0–100) of each driver type on chemicals & materials market forecast




Comments
Share your thoughts, ask a question, or provide feedback about this report.