
Asia Pacific Sustainable Chemicals Market Size Analysis Report 2035
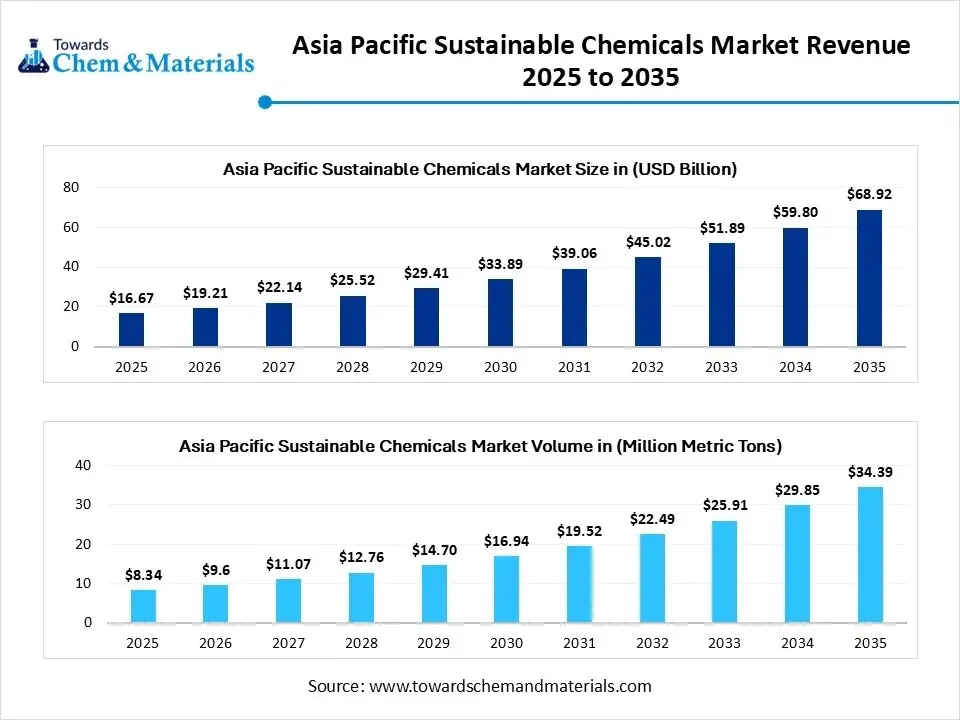
The Asia Pacific sustainable chemicals market size was estimated at USD 16.67 billion in 2025 and is expected to be worth around USD 68.92 billion by 2035, growing at a CAGR of 15.25% from 2026 to 2035. In terms of volume, the Asia Pacific sustainable chemicals market is projected to grow from 8.34 million metric tons in 2025 to 34.39 million metric tons by 2035. growing at a CAGR of 15.22% from 2026 to 2035. Growing consumer demand for sustainable products is the key factor driving market growth. Also, rapid industrialization and urbanization, coupled with the innovations in bio-based chemicals and sustainable solvents, can fuel market growth further.
Key Takeaways
- By product, the bio-alcohols segment dominated the market with approximately 35% share in 2025.
- By product, the bio-polymers segment is expected to grow at the fastest CAGR over the forecast period.
- By feedstock, the food-crop sugars segment held the largest market share in 2025
- By feedstock, the renewable energy-derived feedstocks segment is expected to grow at the fastest CAGR over the forecast period.
- By technology, the fermentation segment dominated the market with the largest share in 2025
- By technology, the chemical recycling segment is expected to grow at the fastest CAGR during the forecast period.
- By application, the packaging segment held the largest market share in 2025
- By application, the personal care & cosmetics segment is expected to grow at the fastest CAGR during the study period.
Market Size and Volume Forecast:
- Market Estimated Size (2025): USD 16.67 Billion | CAGR (2026–2035): 15.25%
- Market Projected Size (2035): USD 68.92 Billion
- Market Volume (2025): 8.34 Million Metric Tons | Volume CAGR (2026–2035): 15.22%
- Market Projected Volume (2035): 34.39 Million Metric Tons
- Market Pricing (2025):
- Average Manufacturing Price: USD 2.00/MT
- Average Selling Price: USD 2.00/MT
What are Sustainable Chemicals?
The market is driven by stringent environmental regulations, growing corporate sustainability targets, advancements in green chemistry technologies, and increasing consumer preference for eco-friendly products.
The Asia-Pacific sustainable chemicals market comprises chemicals that are produced or processed using environmentally friendly, low-carbon, or renewable feedstocks. These include bio-based, recycled, and circular-economy-derived chemicals designed to replace conventional fossil-based products across various industries such as packaging, textiles, automotive, construction, agriculture, and personal care. The Asia-Pacific region is emerging as both the largest and fastest-growing market due to strong policy support, abundant biomass resources, and rapid industrial investment.
Asia Pacific Sustainable Chemicals Market Outlook:
- Industry Growth Overview: Between 2025-2034, the market is expected to witness substantial growth due to ongoing investment in bio-refineries along with the availability of abundant biomass resources. Also, the shift towards circular economy principles, especially in countries such as Japan and India, is driving market growth soon.
- Sustainability Trends: Companies are heavily investing in cutting-edge green technologies and growing manufacturing capacities for sustainable solutions. Major players are also adopting circular economy initiatives to reduce waste and create more sustainable product lifespans.
- Global Expansion: Major players such as Evonik and Mitsubishi Chemical Group are expanding their market presence in the region, boosted by the increasing need for sustainable products in sectors such as automotive, electronics, and agriculture, further supported by regional industrial expansion.
Report Scope
| Report Attributes | Details |
| Market Size in 2025 | USD 19.21 Billion/ 9.61 Million Metric Tons |
| Expected Size by 2035 | USD 68.92 Billion / 34.39 Million Metric Tons |
| Growth Rate from 2025 to 2035 | CAGR 15.25% |
| Base Year of Estimation | 2025 |
| Forecast Period | 2025 - 2035 |
| Segment Covered | By Product / Chemistry, By Feedstock / Source, By Technology / Production Route, By Application / End-use |
| Key Companies Profiled | Evonik Industries, Clariant AG, Mitsubishi Chemical Group (Japan), Sumitomo Chemical (Japan), Toray Industries (Japan), LG Chem (South Korea), Lotte Chemical (South Korea) Indorama Ventures (Thailand), Braskem Siam (Thailand JV), Corbion N.V. (Netherlands – APAC operations), NatureWorks LLC, Neste Oyj (Finland – APAC renewable feedstock partnerships), Wanhua Chemical Group (China), Sinopec (China), Formosa Plastics Group (Taiwan), Reliance Industries (India), Genomatica Inc. (U.S. – APAC collaborations), Avantium N.V. (Netherlands – APAC partnerships) |
Key Technological Shifts in the Asia Pacific Sustainable Chemicals Market:
Key technological shifts in the market are fuelled by advanced recycling techniques, biorefining, and other green chemistry advances. These shifts are facilitated by increasing consumer demand for eco-friendly products, government policies, and the need to minimize dependence on fossil fuels.
Trade Analysis of the Asia Pacific Sustainable Chemicals Market: Import & Export Statistics
- India: India's chemical imports were $75 billion in 2023, compared to $44 billion in exports, resulting in a $31 billion trade deficit.
- China: China's chemical exports are rising. Major exports include certain organic and inorganic chemicals, with countries like the US, Japan, and other Northeast Asian countries as key markets. (Source: www.manoramayearbook.in)
Value Chain Analysis of the Asia Pacific Sustainable Chemicals Market
- Feedstock Procurement : It is a process of acquiring raw materials to produce chemicals with a focus on social, environmental, and economic sustainability.
Chemical Synthesis and Processing : It is a method used to create chemicals in a resource-efficient and environmentally friendly manner. - Packaging and Labelling : This stage involves utilizing sustainable materials by combining smart technology for traceability to ensure clear, compliant, sustainable labelling.
- Regulatory Compliance and Safety Monitoring : It refers to the processes and frameworks that ensure the production of chemical products and their adherence to legal, safety, health, and environmental standards.
Asia Pacific Sustainable Chemicals Market's Regulatory Landscape: Global Regulations
| Country/Region | Key Regulations |
| China | A new, comprehensive environmental code is being developed, which incorporates "green chemistry substitutions" and promotes the use of safer, less hazardous materials. |
| India | Chemicals (Management and Safety) Rules (CMSR)is anticipated for full enforcement by 2026; these rules are India's proposed REACH-like framework for registering and restricting chemicals. |
| Japan | Japan's regulatory landscape for chemicals includes the Chemical Substance Control Law (CSCL) for managing industrial chemicals and preventing environmental pollution. |
Market Opportunity
Increasing Adoption of Bio-Based Materials
The ongoing trend towards bio-based materials in the region represents significant market opportunities over the forecast period. These materials are derived from renewable biological resources like algae, plants, and agricultural waste. Furthermore, bio-based materials give several benefits, such as less greenhouse gas emissions, a lower carbon footprint, and reduced reliance on finite resources.
Market Challenge
Regulatory Complexity
Navigating an extensive and changing set of regulations across different countries in the region can be challenging, causing fluctuations in product approvals and market emergence. Moreover, stringent regulations such as those on hazardous substances increase overall administrative burden for market players, hindering market growth further.
Segmental Insights
Product Insight
How Much Share Did the Bio-Alcohols Segment Held in 2025?
The bio-alcohols segment dominated the market with approximately 35% share in 2025 The dominance of the segment can be attributed to the stringent government regulations and increasing consumer demand for sustainable products. The region also benefits from plentiful biomass feedstocks such as sugarcane and agricultural residues, which are used to manufacture bio-alcohols.
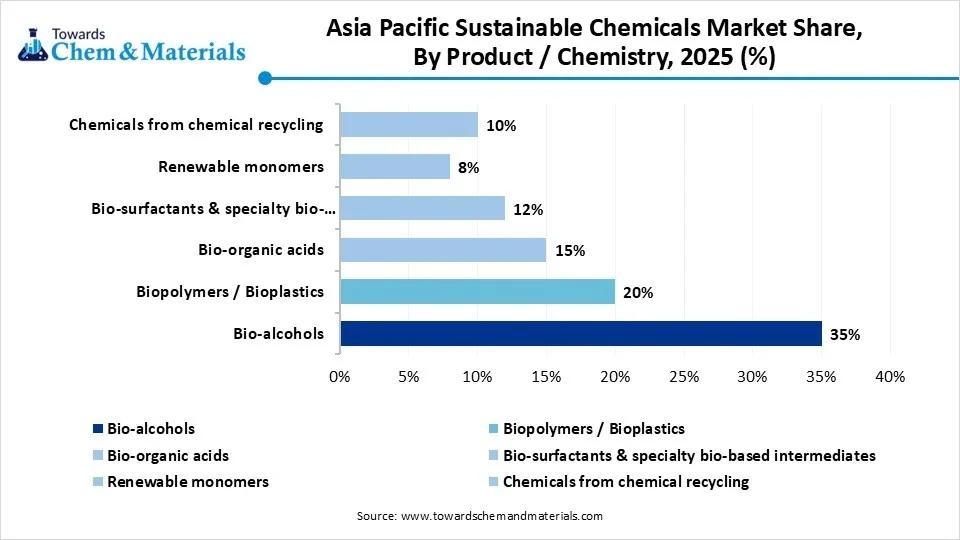
The biopolymers segment is expected to grow at the fastest CAGR over the forecast period. The growth of the segment can be credited to the growing adoption of supportive government policies along with a shift away from fossil fuels. Technological innovations are also enhancing biopolymer performance by reducing production costs, which makes them more competitive.
Asia Pacific Sustainable Chemicals Market Share, By Product/ Chemistry, 2025(%)
| By Product / Chemistry | Revenue Share, 2025 (%) |
| Bio-alcohols | 35% |
| Biopolymers / Bioplastics | 20% |
| Bio-organic acids | 15% |
| Bio-surfactants & specialty bio-based intermediates | 12% |
| Renewable monomers | 8% |
| Chemicals from chemical recycling | 10% |
- Bio-alcohols hold 35% of the market share in 2025. Bio-alcohols are the leading product in the sustainable chemicals market, driven by their widespread use as renewable solvents and fuels.
- Biopolymers / Bioplastics account for 20% of the market share. The demand for sustainable, biodegradable plastics is rising, making biopolymers a key segment in the market.
- Bio-organic acids contribute 15% to the market share. These acids, derived from renewable feedstocks, are essential in the production of various bio-based chemicals.
- Bio-surfactants & specialty bio-based intermediates make up 12% of the market share. These bio-based products are increasingly used in cleaning, cosmetic, and industrial applications for their eco-friendly properties.
- Renewable monomers represent 8% of the market share. Renewable monomers are crucial for producing sustainable plastics and polymers, supporting the growing shift toward green materials.
- Chemicals from chemical recycling hold 10% of the market share. Chemical recycling technologies are enabling the production of sustainable chemicals from waste materials, contributing to circular economy efforts.
Feedstock Insight
Which Feedstock Type Segment Dominated the Asia Pacific Sustainable Chemicals Market in 2024?
The food-crop sugars segment held the largest market share 55.14% in 2025.The dominance of the segment can be linked to the growing consumer demand for sustainable products and rising regulatory pressure against traditional synthetic chemicals. Also, eco-friendly chemicals derived from food-crop sugars are crucial feedstocks for the manufacturing of bioplastics like polylactic acid (PLA).
The renewable energy-derived feedstocks segment is expected to grow at the fastest CAGR over the forecast period. The growth of the segment can be driven by technological innovation, strong government support, and changing consumer demand. Moreover, Research is increasing the use of abundant and diverse renewable feedstocks, such as agricultural and forestry residues.
Asia Pacific Sustainable Chemicals Market Share,By Feedstock / Source, 2025(%)
| By Feedstock / Source | Revenue Share, 2025 (%) |
| 1st-Generation / Food-crop sugars | 55.14% |
| Agricultural residues & lignocellulosic biomass | 20% |
| Industrial & municipal waste / waste oils | 12% |
| Renewable energy-derived feedstocks | 12.86% |
- 1st-Generation / Food-crop sugars holds 55.14% of the market share in 2025. These sugars, derived from food crops, remain the dominant feedstock for sustainable chemical production.
- Agricultural residues & lignocellulosic biomass account for 20% of the market share. This feedstock is increasingly used for sustainable chemical production, providing an eco-friendly alternative to food crops.
- Industrial & municipal waste / waste oils contribute 12% to the market share. Waste materials such as oils and municipal waste are being utilized to produce sustainable chemicals, promoting circular economy practices.
- Renewable energy-derived feedstocks make up 12.86% of the market share. These feedstocks, derived from renewable energy sources, support the growing demand for sustainable and green chemicals.
Technology Insight
Which Technology Segment Dominated the Asia Pacific Sustainable Chemicals Market in 2025?
The fermentation segment dominated the market with the largest share 49.00% in 2025. The dominance of the segment can be linked to the growing product demand from the food and beverage industry, coupled with the favourable government policies. Additionally, ongoing advancements in fermentation techniques such as microbial engineering and precision fermentation are driving segment growth shortly.
The chemical recycling segment is expected to grow at the fastest CAGR during the forecast period. The growth of the segment can be driven by a surge in plastic waste generation and growing demand for high-grade recycled content in various sectors. The chemical recycling process creates recycled materials with the same quality as virgin plastics.
Asia Pacific Sustainable Chemicals Market Share, By Technology / Production Route, 2025(%)
| By Technology / Production Route | Revenue Share, 2025 (%) |
| Fermentation / Industrial biotechnology | 49.00% |
| Catalytic conversion of bio-oils / hydroprocessing | 15% |
| Chemical recycling / Depolymerization & advanced pyrolysis | 12% |
| Electrosynthesis / e-chemicals | 10% |
| Hybrid bio-catalytic processes | 14% |
- Fermentation / Industrial biotechnology holds 49.00% of the market share in 2025. This production route leads the market, driven by its ability to produce sustainable chemicals through biological processes.
- Catalytic conversion of bio-oils / hydroprocessing accounts for 15% of the market share. This method is widely used for transforming bio-oils into valuable sustainable chemicals via catalytic reactions.
- Chemical recycling / Depolymerization & advanced pyrolysis contributes 12% to the market share. These advanced techniques are essential for recycling and converting waste plastics and polymers into sustainable chemicals.
- Electrosynthesis / e-chemicals makes up 10% of the market share. This innovative technology uses electricity to synthesize chemicals, offering a cleaner, more sustainable alternative.
- Hybrid bio-catalytic processes hold 14% of the market share. Hybrid processes that combine biological and catalytic methods are gaining ground for producing sustainable chemicals efficiently.
Application Insight
How Much Share Did the Packaging Segment Held in 2025?
The packaging segment held the largest market share 65.33% in 2025. The dominance of the segment is owed to the increasing environmental concerns and regulations, along with the surge in urbanization and e-commerce activities. Furthermore, the cost-effectiveness and recyclability of paper and paperboard are growing their demand for sustainable packaging solutions.
The personal care & cosmetics segment is expected to grow at the fastest CAGR during the study period. The growth of the segment is due to growing consumer awareness of organic and natural products and the growth of e-commerce platforms. Moreover, consumers are becoming more knowledgeable regarding product ingredients and focusing on safe and effective formulations.
Asia Pacific Sustainable Chemicals Market Share, By Application / End-use, 2025(%)
| By Application / End-use | Revenue Share, 2025 (%) |
| Packaging | 65.33% |
| Textiles & Fibers | 12% |
| Automotive & Transportation | 8% |
| Construction & Building materials | 7% |
| Personal Care & Cosmetics | 7.67% |
- Packaging holds 65.33% of the market share in 2025. Sustainable chemicals are primarily driven by the growing demand for eco-friendly packaging solutions in the region.
- Textiles & Fibers account for 12% of the market share. The textile industry is increasingly adopting sustainable chemicals for more eco-conscious fabric production.
- Automotive & Transportation contributes 8% to the market share. Sustainable chemicals are gaining traction in the automotive and transportation sectors for producing greener components and materials.
- Construction & Building materials make up 7% of the market share. The use of sustainable chemicals in construction materials supports the growing trend of green building practices.
- Personal Care & Cosmetics holds 7.67% of the market share. Sustainable chemicals are playing a significant role in the personal care and cosmetics industry, driven by consumer demand for eco-friendly products.
Country Insights
China Asia Pacific Sustainable Chemicals Market Trends
The market growth in China is majorly driven by robust domestic demand for sustainable products and rapid investments in green innovation. Also, the governments offer financial support through mechanisms such as subsidies and green loans to optimize investment in sustainable projects and technologies.
India Asia Pacific Sustainable Chemicals Market Trends
The market expansion in India is primarily boosted by rapid economic expansion and industrialization, coupled with the growing consumer preference for green chemistry. Moreover, India's robust industrial growth, especially in sectors such as automotive, manufacturing, and textiles, creates a significant demand for specialty and sustainable chemicals.
Country-level Investments & Funding Trends for the Asia Pacific Sustainable Chemicals Market:
- India: Japan is co-investing in India's green chemicals sector. A $600 million India-Japan fund was launched in 2023 to invest in environmental sustainability.(Source: www.pib.gov.in)
- China: In 2024, China invested $940 billion in clean energy initiatives, closing the investment gap with global fossil fuels funding.(Source: www.rinnovabili.net)
Recent Development
- In August 2025, Singapore-based startup Prefer unveiled new soluble cocoa and bean-free coffee powders to help food and beverage market players negotiate limited supplies and higher prices of the sought-after commodities.(Source: agfundernews.com)
Top Vendors in the Asia Pacific Sustainable Chemicals Market & Their Offerings:
- BASF SE: BASF is a major player in the Asia Pacific sustainable chemicals market, with a strategy centered on regional innovation, circular economy principles, and enabling the "green transformation" of its customers.
- Dow Inc.: Dow Inc. is a major player in the Asia Pacific (APAC) sustainable chemicals market, focusing on developing a circular economy for plastics, reducing its carbon footprint, and innovating sustainable materials.
Other Players
- Evonik Industries
- Clariant AG
- Mitsubishi Chemical Group (Japan)
- Sumitomo Chemical (Japan)
- Toray Industries (Japan)
- LG Chem (South Korea)
- Lotte Chemical (South Korea)
- Indorama Ventures (Thailand)
- Braskem Siam (Thailand JV)
- Corbion N.V. (Netherlands – APAC operations)
- NatureWorks LLC
- Neste Oyj (Finland – APAC renewable feedstock partnerships)
- Wanhua Chemical Group (China)
- Sinopec (China)
- Formosa Plastics Group (Taiwan)
- Reliance Industries (India)
- Genomatica Inc. (U.S. – APAC collaborations)
- Avantium N.V. (Netherlands – APAC partnerships)
Segment Covered
By Product / Chemistry
- Bio-alcohols (methanol, ethanol, butanol)
- Biopolymers / Bioplastics (PLA, PHA, bio-PE, bio-PET)
- Bio-organic acids (succinic, lactic, citric, itaconic)
- Bio-surfactants & specialty bio-based intermediates
- Renewable monomers (bio-BTX, bio-PET intermediates)
- Chemicals from chemical recycling (monomers from depolymerization, pyrolysis oils)
By Feedstock / Source
- 1st-Generation / Food-crop sugars (corn, sugarcane)
- Agricultural residues & lignocellulosic biomass
- Industrial & municipal waste / waste oils
- Renewable energy-derived feedstocks (COâ‚‚ + green hydrogen)
By Technology / Production Route
- Fermentation / Industrial biotechnology
- Catalytic conversion of bio-oils / hydroprocessing
- Chemical recycling / Depolymerization & advanced pyrolysis
- Electrosynthesis / e-chemicals (COâ‚‚ + renewable Hâ‚‚ routes)
- Hybrid bio-catalytic processes
By Application / End-use
- Packaging
- Textiles & Fibers
- Automotive & Transportation
- Construction & Building materials
- Personal Care & Cosmetics
A Seven-Phase Framework
Our methodology is designed to be universally applicable across commodity chemicals, specialty chemicals, petrochemicals, construction chemicals, coatings, electronic chemicals, industrial gases, agrochemicals, water treatment chemicals, and performance materials. Each phase builds upon the last, creating a layered validation structure that minimizes estimation error and maximizes analytical confidence.
The framework ensures comprehensive market coverage, robust cross-validation, and reliable long-term forecasting — producing market estimates that withstand scrutiny from investors, regulators, and corporate strategy teams.

Seven-Phase Framework — Analytical Effort Distribution
Relative analytical effort allocated across each phase of the Chemicals & Materials research framework

Phase 1 - Secondary Research: Establishing the Foundation
Secondary research collects and evaluates publicly available information from authoritative sources, establishing the foundational understanding of market structure, value chain dynamics, competitive landscape, and end-use demand patterns. Every source is evaluated for credibility, recency, geographic relevance, and methodological soundness before inclusion.
Industry Associations
Sources include ACC, CEFIC, ICCA, JCIA, CPCIF, and SOCMA providing production volumes, consumption trends, capacity developments, and sustainability initiatives.
Company Disclosures
Annual reports, investor presentations, earnings transcripts, and regulatory filings reveal product portfolios, manufacturing footprints, capacity expansions, and revenue segmentation.
Government Databases
National statistical offices, customs authorities, environmental agencies, and industrial production databases provide verified statistics on output, trade flows, and regulatory compliance.
Trade Databases
UN Comtrade, ITC, Eurostat, and national customs authorities enable assessment of global product movement, import dependency, and export competitiveness across regions.
Our Secondary Research Sources
- Ministry of Chemicals and Fertilizers
- European Chemicals Agency
- United States Department of Energy
- Ministry of Industry and Information Technology
- Ministry of Economy Trade and Industry
- Ministry of Trade Industry and Energy
- National Institute of Standards and Technology
- Council of Scientific and Industrial Research
- Fraunhofer Society
- National Institute for Materials Science
Phase 2 — Supply-Side Assessment: Mapping Production Capabilities
Production Capacity Analysis
All major manufacturers are assessed for existing installed capacity, planned additions, expansions, new plant announcements, and technology adoption — mapped at global, regional, and country levels.
Capacity Utilization Adjustment
Installed capacity is adjusted using utilization rates based on demand conditions, feedstock availability, plant operating rates, maintenance schedules, and regulatory restrictions.
Manufacturer Revenue Analysis
Product-specific revenues, segment-level performance, regional distribution, average selling prices, and margin trends are evaluated to establish market value estimates.
Supply-Side Assessment — Capacity vs. Effective Production by Region
Illustrative comparison of installed capacity vs. effective production volume (after utilization rate adjustment) across major regions

Phase 3 — Demand-Side Assessment: Quantifying Chemical Consumption
Demand-side analysis quantifies chemical consumption across industries, applications, and geographies — identifying where and how chemicals are consumed throughout the value chain with precision.
End-Use Industry Analysis
Chemical demand is evaluated across automotive, construction, packaging, electronics, agriculture, healthcare, consumer goods, industrial manufacturing, energy and utilities, and water treatment. Industry output, production trends, and consumption intensity are analyzed to determine demand patterns.
Consumption Modeling
Demand is estimated using measurable indicators: kilograms per vehicle, kilograms per square meter of construction, dosage per cubic meter of water treated, kilograms per hectare of agricultural land, and kilograms per ton of manufactured products. Consumption factors are validated through industry publications and primary interviews.
Application Analysis
The market is segmented by application area to understand product performance requirements, formulation trends, technology adoption, customer preferences, and regulatory requirements improving demand accuracy and segmentation granularity.
Demand-Side Assessment — End-Use Industry Demand Distribution
Illustrative distribution of chemical & materials demand across key end-use industries

Phase 4 - Trade Flow Analysis: Balancing Regional Supply and Demand
Trade flow analysis reconciles regional supply and demand estimates through import and export data, identifying net supply positions, regional dependencies, and market imbalances. It serves as an independent validation layer that tests the consistency of supply-side and demand-side estimates.
Import Analysis
Import data is evaluated to determine volumes, source countries, product dependency, regional supply gaps, and pricing trends — identifying markets that rely heavily on external supply and where domestic production is insufficient to meet demand.
Export Analysis
Export assessments reveal production surplus, export competitiveness, regional manufacturing strength, and global market participation. Export patterns also help validate domestic production estimates and identify net exporting regions.
Apparent Consumption Model
Regional consumption is assessed using the standard apparent consumption formula:
Results identify net importing regions, net exporting regions, regional deficits, and surpluses — serving as an independent validation of supply and demand estimates.
Trade Flow Analysis — Net Supply Position by Region
Illustrative apparent consumption vs. domestic production across major regions — positive gap indicates net import dependency

Phase 5 — Primary Research: The Critical Validation Layer
Primary research tests and refines findings from secondary research through direct engagement with industry participants across the supply chain, demand side, and expert community. It captures intelligence that no database or published report can provide — the real-world experience of manufacturers, buyers, and specialists operating in the market.

Supply-Side Interviews
Conversations with chemical manufacturers, raw material suppliers, contract manufacturers, technology providers, and plant operators cover production trends, capacity utilization, pricing developments, technology shifts, and competitive dynamics.

Demand-Side Interviews
Engagement with OEMs, industrial consumers, procurement managers, distributors, formulators, and end-use manufacturers focuses on consumption trends, purchasing behavior, product substitution, demand outlook, and emerging applications.

Industry Expert Consultations
Additional interviews with industry consultants, independent experts, regulatory specialists, technical professionals, and research institutions provide deeper market context and validate key analytical assumptions.
Focus Areas of Primary Research:
Market Size & Forecast Validation
Revenue estimates, volume consumption, growth rates, forecast assumptions, regional demand.Supply Chain & Value Chain Assessment
Raw material sourcing, supply chain challenges, distribution networks, procurement practices.Production & Capacity Analysis
Manufacturing capacity, utilization rates, expansion projects, plant investments.Pricing & Cost Structure Analysis
Product pricing trends, feedstock costs, energy costs, margin pressures, pricing outlook.Competitive Landscape Assessment
Volume and value estimates confirmed to be fully consistent with one another before publicationInterview Volume by Market Scope
| Study Scope | Number of Interviews |
|---|---|
| Niche Market | 20 – 30 |
| Mid-Sized Market | 30 – 50 |
| Global Market | 50 – 80 |
| Highly Fragmented Market | 80 – 120 |
Interview Details:
Category : Manufacturers, Suppliers, Distributors, End Users, Experts/Associations
Average Duration : 30–60 Minutes
Interview Mode : Video calls, telephonic interviews, expert consultations
Interview Format : Structured / Semi-Structured questionnaire
Focus Areas of Primary Research:
Market Size & Forecast Validation :
Revenue estimates, volume consumption, growth rates, forecast assumptions, regional demand.
Supply Chain & Value Chain Assessment :
Raw material sourcing, supply chain challenges, distribution networks, procurement practices.
Production & Capacity Analysis :
Manufacturing capacity, utilization rates, expansion projects, plant investments.
Pricing & Cost Structure Analysis :
Product pricing trends, feedstock costs, energy costs, margin pressures, pricing outlook.
Competitive Landscape Assessment :
Market share, competitor positioning, strategic initiatives, partnerships, acquisitions.
Primary Research — Stakeholder Coverage by Category
Distribution of interview respondents across stakeholder categories (% share from PPT data)

Primary Research — Respondent Designation Profile
Seniority breakdown of interview respondents (% share from PPT data)

Primary Research — Geographic Coverage of Interviews
Regional distribution of primary research engagement (% share from PPT data)

Phase 6 — Data Triangulation and Market Validation
No single methodology is relied upon in isolation. Multiple independent estimation approaches are combined and reconciled to ensure consistency, accuracy, and analytical defensibility. Any material deviations between approaches are investigated and adjusted through additional validation cycles.
The final market size is derived through weighted triangulation of all validated methodologies. Any material deviations between approaches are investigated and adjusted through additional validation cycles. The outcome represents the most realistic assessment of the market based on available evidence and expert confirmation ensuring that volume and value estimates are fully consistent with one another.
Triangulation Framework — Input Contribution Weight
Relative weight each sizing input contributes to the final reconciled market estimate

Phase 7 — Forecast Modeling: Projecting Future Market Evolution
Forecasting evaluates the future trajectory of the market using a combination of quantitative indicators and qualitative assessments across economic, industry, and regulatory dimensions. Rather than simple extrapolation, each driver is independently modeled and integrated into a composite forecast.
Macroeconomic Indicators
GDP growth, industrial production, manufacturing output, construction activity, consumer spending, and capital investment form the quantitative foundation of long-term demand projections. These are applied at country, regional, and global levels.
Industry Growth Drivers
Urbanization, infrastructure development, industrialization, technological innovation, sustainability initiatives, and evolving product performance requirements are assessed at regional and industry levels — capturing both structural and cyclical demand drivers.
Capacity Expansion Analysis
Announced plant expansions, new manufacturing facilities, technology upgrades, and strategic investments are evaluated to determine future supply-demand dynamics and potential market tightness or oversupply situations.
Regulatory & Sustainability
Environmental regulations, chemical safety standards, emission reduction targets, circular economy initiatives, and sustainability requirements are incorporated as they often influence product adoption rates and market growth trajectories.
Scenario Forecast Range — Indexed Market Growth (Year 1–10)
Illustrative indexed growth trajectories across Base, Optimistic, and Pessimistic scenarios over a 10-year forecast horizon

Forecast Drivers — Relative Impact Score by Category
Impact score (0–100) of each driver type on chemicals & materials market forecast




Comments
Share your thoughts, ask a question, or provide feedback about this report.