
Sulfuric Acid Market Size and Forecast 2026 to 2035
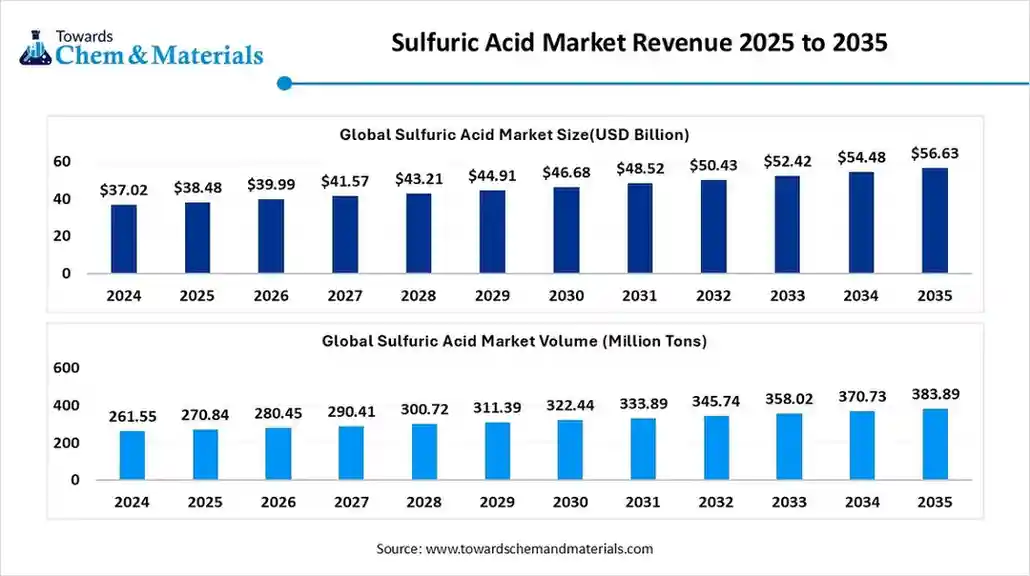
The global sulfuric acid market has expanded to reach approximately 270.84 million tones in 2025 is projected to reach 383.89 million tons by 2035, growing at a CAGR of 3.55% from 2025 to 2035.
The global sulfuric acid market size is calculated at USD 38.48 billion in 2025 and is predicted to increase from USD 39.99 billion in 2026 and is projected to reach around USD 56.63 billion by 2035, The market is expanding at a CAGR of 3.94% between 2025 and 2035. The growth of the market is driven by the growing demand from various industries due to its applications, which fuel the growth.
Key Takeaways
- By region, Asia Pacific dominated the market in 2024.
- By region, Europe is expected to have significant growth in the market in the forecast period.
- By raw material/feedstock, the elemental sulfur segment dominated the market with approximate share of 61.3% in 2024.
- By raw material/feedstock, the base metal smelters segment is expected to grow significantly in the market during the forecast period.
- By manufacturing process, the contact process segment dominated the market with approximate share of 87.4% in 2024.
- By manufacturing process, the lead chamber process segment is expected to grow in the forecast period.
- By grade/purity, the standard commercial grade segment dominated the market with approximate share of 82.5% in 2024.
- By grade/purity, the ultra-pure grade segment is expected to grow in the forecast period.
- By end-use industry, the agriculture segment dominated the market with approximate share of 53.4% in 2024.
- By end-use industry, the chemical & pharmaceutical segment is expected to grow in the forecast period.
- By distribution channel, the direct sales segment dominated the market with approximate share of 67.8% in 2024.
- By distribution channel, the online & e-procurement segment is expected to grow in the forecast period.
Market Overview
What Is The Significance Of The Sulfuric Acid Market?
- The global sulfuric acid market encompasses the production, distribution, and consumption of sulfuric acid (Hâ‚‚SOâ‚„), one of the most widely used industrial chemicals globally. It serves as a critical raw material for fertilisers, chemicals, petroleum refining, metal processing, and wastewater treatment.
- Sulfuric acid is primarily produced through the contact process using elemental sulfur, base metal smelters, or pyrite ores as feedstock. The market is driven by growing phosphate fertiliser demand, increased industrialisation in developing economies, and the expansion of metal refining and chemical synthesis applications.
- Technological advancements in sulfur capture, emission reduction, and circular acid regeneration further support sustainable growth. Asia-Pacific dominates global demand, while North America and Europe focus increasingly on process efficiency and recycling.
Sulfuric Acid Market Outlook:
- Industry Growth Overview: Between 2025 and 2034, the global sulfuric acid market is projected to grow steadily, driven by rising demand from fertiliser, chemical, and metal processing industries. Increasing phosphate fertilizer production, growth in industrial manufacturing, and expanding base metal smelting operations are supporting market expansion.
- Sustainability Trends: Sustainability initiatives are influencing the market as producers adopt cleaner production technologies and circular sulfur recovery systems. Refineries and smelters are increasingly investing in sulfur capture and conversion units to reduce SOâ‚‚ emissions and produce high-purity acid from industrial by-products.
- Global Expansion & Innovation: Key market players are expanding production capacities and modernising plants to meet rising demand while adhering to stricter environmental standards. Strategic collaborations between fertiliser producers, metal refiners, and chemical manufacturers are optimising supply chain integration and feedstock utilisation.
Report Scope
| Report Attributes | Details |
| Market Size in 2026 | USD 39.99 Billion |
| Expected Size by 2035 | USD 56.63 Billion |
| Growth Rate from 2025 to 2035 | CAGR 3.94% |
| Market Volume in 2026 | 280.45 Million Tons |
| Expected Volume by 2035 | 383.89 Million Tons |
| Growth Rate from 2025 to 2035 | CAGR 3.55% |
| Base Year of Estimation | 2024 |
| Forecast Period | 2025 - 2035 |
| Leading Region | Asia Pacific |
| Fastest Growing Region | Europe |
| Segment Covered | By Raw Material / Feedstock, By Manufacturing Process, By Grade / Purity, By End-Use Industry, By Distribution Channe, lBy Region |
| Key Companies Profiled | BASF SE, The Mosaic Company, INEOS Group Holdings S.A., DuPont de Nemours, Inc., Boliden Group , Aurubis AG , PVS Chemicals Inc. , Koch Industries, Inc. , Chemtrade Logistics Income Fund , Trident Group , Sumitomo Chemical Co., Ltd. , Acide Sulfurique et Dérivés , Kronos Worldwide, Inc. , Nutrien Ltd., Veolia , Aarti Industries Ltd., Hindustan Zinc Ltd., Jubilant Industries, Kiri Industries Ltd., Dharamsi Morarji Chemical Co. Ltd., Korea Zinc Co. Ltd., Linde Group, Sumitomo Chemical, Oriental Carbon & Chemicals |
Key Technological Shifts In The Sulfuric Acid Market:
Key technological shifts in the market include the adoption of advanced recovery and recycling technologies, a move toward sustainable production methods, and the development of specialised, high-purity grades for emerging industries.
Other significant trends are the use of improved catalysts for higher yields, the integration of smart controls for quality assurance, and the recovery of metals from spent batteries to create a circular economy for resources.
Trade Analysis Of Sulfuric Acid Market: Import & Export Statistics
- The World exported 1,098 shipments of Sulphuric Acid from Nov 2023 to Oct 2024. These exports done by 174 Exporters to 88 Buyers, marking a growth rate of 28% compared to the previous twelve months.
Most of the Sulphuric Acid exports from the World go to the United States, Taiwan, and South Korea. - India exported 33 shipments of Sulphuric Acid from Oct 2023 to Sep 2024. These exports done by 6 Indian Exporters to 6 Buyers, marking a growth rate of 175% compared to the previous twelve months
majority of the Sulphuric Acid exports from India goes to the United States. - Globally, the top three exporters of Sulphuric Acid are the United States, China, and Belgium. The United States leads the world in Sulphuric Acid exports with 2,772 shipments, China with 767 shipments, and Belgium with 288 shipments.
Sulfuric Acid Market Value Chain Analysis
- Chemical Synthesis and Processing : Sulfuric acid is produced primarily through the contact process, which involves burning sulfur or sulfide ores to form sulfur dioxide, followed by catalytic oxidation and absorption in water to yield concentrated Hâ‚‚SOâ‚„.
- Key players BASF SE, DuPont de Nemours Inc., The Mosaic Company, OCP Group, PVS Chemicals Inc.
- Quality Testing and Certification : Sulfuric acid is tested for purity, concentration, specific gravity, and contaminant levels under standards such as ISO 9001, ASTM E223, and REACH compliance for chemical safety.
- Key players: SGS, Intertek, Bureau Veritas, TÜV SÜD.
- Distribution to Industrial Users : Sulfuric acid is distributed to fertiliser, chemical manufacturing, metal processing, and petroleum refining industries via bulk transport and specialised chemical distributors.
- Key players: BASF SE, OCP Group, The Mosaic Company, Chemtrade Logistics
Sulfuric Acid Regulatory Landscape: Global Regulations
| Country / Region | Regulatory Body | Key Regulations / Standards | Focus Areas | Notable Notes |
| United States | U.S. Environmental Protection Agency (EPA) Occupational Safety and Health Administration (OSHA) Department of Transportation (DOT) |
- Clean Air Act (CAA) - Emergency Planning and Community Right-to-Know Act (EPCRA) - OSHA HAZCOM Standard (29 CFR 1910.1200) - Hazardous Materials Regulations (49 CFR Parts 171–180) |
- Air emission limits (SOâ‚‚, particulates) - Chemical storage, labelling, and worker safety - Transportation of hazardous materials |
Sulfuric acid facilities are subject to Title V air permits and Risk Management Plans (RMPs). Strict OSHA standards apply to handling and labelling. DOT classifies sulfuric acid as a Class 8 corrosive material. |
| European Union | European Chemicals Agency (ECHA) European Environment Agency (EEA) |
- REACH Regulation (EC No. 1907/2006) - CLP Regulation (EC No. 1272/2008) - Industrial Emissions Directive (IED, 2010/75/EU) - Seveso III Directive (2012/18/EU) |
- Registration and safe use of sulfuric acid - Emission control and process safety - Major accident hazard management |
Sulfuric acid is registered under REACH with a harmonised classification as corrosive. The IED regulates emission limits from smelters and acid plants. Seveso III applies due to high toxicity and storage volume thresholds. |
| China | Ministry of Ecology and Environment (MEE) State Administration for Market Regulation (SAMR) |
- MEE Order No. 12 – New Chemical Substance Registration - Hazardous Chemical Management Regulation (2011) - GB 30000 Series – GHS Implementation Standards |
- Environmental risk management - Hazard labelling and workplace safety - Air and wastewater discharge norms |
Sulfuric acid is on the Catalogue of Hazardous Chemicals, requiring hazardous chemical registration and local licensing for production, transport, and storage. Strict discharge standards for SOâ‚‚ emissions from sulfur-burning units. |
| India | Ministry of Environment, Forest and Climate Change (MoEFCC) Central Pollution Control Board (CPCB) Department of Chemicals & Petrochemicals (DCPC) |
- Manufacture, Storage and Import of Hazardous Chemicals (MSIHC) Rules, 1989 (amended 2020) - Environment Protection Act, 1986 - Chemical Accidents Rules, 1996 |
- Safe handling and storage - Air and effluent emissions - Accident prevention and reporting |
Sulfuric acid production units require Environmental Clearance and are covered under the Red Category Industries. CPCB regulates stack emissions (SOâ‚‚ ≤ 40 mg/Nm³) and mandates acid mist control technologies. |
| Middle East (Saudi Arabia, UAE) | Saudi Standards, Metrology and Quality Org. (SASO) Environment Agency – Abu Dhabi (EAD) |
- GCC Standardisation Organisation (GSO) GHS-based chemical classification - Local environmental permitting standards |
- Industrial safety and waste acid disposal - Emission controls for smelters and refineries |
The region enforces GHS-aligned labelling and requires Environmental Impact Assessments (EIA) for new sulfuric acid or fertiliser plants. |
Segmental Insights
Raw Material / Feedstock Insights
Which Raw Material/Feedstock Segment Dominated The Sulfuric Acid Market In 2024?
- The elemental sulfur segment dominated the market with approximate share of 61.3% in 2024. The increasing recovery of sulfur from oil refineries and natural gas desulfurization processes has strengthened supply security and sustainability. Its use aligns with circular economy goals as recovered sulfur is utilised from industrial waste gases, making it a vital feedstock for modern large-scale sulfuric acid plants, supporting growth.
- The base metal smelters segment expects significant growth in the market during the forecast period. Base metal smelters act as a key secondary source of sulfur dioxide gas, which can be captured and converted into sulfuric acid.
- Many integrated mining and metallurgical facilities utilise this feedstock route to optimise waste utilisation. This approach supports sustainability and compliance with tightening emission regulations, which drives the growth.
- The pyrite ores segment has seen notable growth in the market. Pyrite ores, though less common today, historically served as a major source of sulfur for acid production. The method involves roasting pyrite to release sulfur dioxide for conversion into sulfuric acid. While elemental sulfur-based production is more cost-efficient, pyrite remains relevant in countries with strong mineral bases, such as China and India, supporting growth.
The Manufacturing Process Insights
How Did Contact Process Segment Dominated The Sulfuric Acid Market In 2024?
- The contact process segment dominated the market with approximate share of 87.4% in 2024. The contact process is the industry standard for producing high-purity sulfuric acid, known for its superior efficiency and minimal environmental footprint. It involves catalytic oxidation of sulfur dioxide to sulfur trioxide, followed by absorption in concentrated acid. The method offers high conversion rates, scalability, and suitability for continuous operation. This increases the demand.
- The lead chamber process segment expects significant growth in the market during the forecast period. The lead chamber process, one of the oldest production methods, is now largely phased out but still used for small-scale and low-concentration acid applications. It involves the oxidation of sulfur dioxide in the presence of nitrogen oxides as catalysts within large lead-lined chambers.
Grade / Purity Insights
Which Grade/Purity Segment Dominated The Sulfuric Acid Market In 2024?
- The standard commercial grade segment dominated the market with approximate share of 82.5% in 2024. Standard commercial-grade sulfuric acid, typically ranging between 93–98% concentration, is widely used in the manufacture of fertilisers, detergents, and general chemicals. It serves as an essential reagent for industrial neutralisation, drying, and catalytic applications. The steady demand from developing economies ensures long-term growth prospects for this segment.
- The ultra-pure grade segment expects significant growth in the market during the forecast period. Ultra-pure sulfuric acid is a highly refined grade used predominantly in electronics, semiconductor manufacturing, and pharmaceutical synthesis. The demand for ultra-pure acid is increasing rapidly due to the global expansion of the semiconductor and microelectronics industries.
- The dilute acid segment has seen notable growth in the market. Dilute sulfuric acid is employed across a wide range of secondary applications such as effluent treatment, battery maintenance, and industrial cleaning. Its lower concentration improves safety during handling while still offering sufficient reactivity for neutralisation and cleaning processes.
End-Use Industry Insights
How Did Agriculture Segment Dominated The Sulfuric Acid Market In 2024?
- The agriculture segment dominated the market with approximate share of 53.4% in 2024. The agriculture industry is the single largest consumer of sulfuric acid, primarily for manufacturing phosphate fertilisers such as superphosphate and ammonium sulfate. Rising food demand and declining arable land have increased fertiliser consumption worldwide.
- The chemical & pharmaceutical segment expects significant growth in the market during the forecast period. Sulfuric acid serves as a critical intermediate in producing numerous chemicals such as hydrochloric acid, nitric acid, and synthetic resins. In the pharmaceutical industry, it is used for pH control, dehydration, and reagent preparation.
- Continuous growth in speciality chemicals and API manufacturing, particularly in Europe and Asia, fuels demand in this segment.
- The oil & gas segment has seen notable growth in the sulfuric acid market. In the oil and gas industry, sulfuric acid is used in alkylation units for refining high-octane fuels and in desulfurization processes for cleaner fuel production. Its catalytic properties enhance efficiency and product quality. Demand in this segment is supported by refinery expansions and the enforcement of low-sulfur fuel mandates globally.
Distribution Channel Insights
Which Distribution Channel Segment Dominated The Sulfuric Acid Market In 2024?
- The direct sales segment dominated the market with approximate share of 67.8% in 2024. Direct sales remain the dominant distribution channel, favoured by large manufacturers who supply bulk volumes directly to fertiliser, chemical, and refinery industries. This model ensures consistent quality, reliable logistics, and long-term supply contracts.
- The online & e-procurement segment expects significant growth in the sulfuric acid market during the forecast period. Online and e-procurement platforms are transforming how sulfuric acid is sourced, offering transparency and faster procurement cycles. Digital marketplaces enable mid-scale industrial buyers to compare prices, verify suppliers, and optimise logistics.
- The distributors & traders segment has seen notable growth in the market. Regional distributors and trading companies play a critical role in bridging the supply between large manufacturers and smaller industrial buyers. They offer flexible volumes, on-demand delivery, and localised services. Their role is particularly important in emerging economies, where diverse end-use sectors require tailored logistic support.
Regional Analysis
How Did Asia Pacific Dominate The Sulfuric Acid Market In 2024?
Asia Pacific dominated the market in 2024. Asia Pacific remains the largest and fastest-growing region in the market, driven by agricultural fertiliser demand, metal smelting, and chemical manufacturing. Expanding refinery capacities and industrial projects across China, India, and Southeast Asia further support regional growth. Government initiatives toward agricultural productivity and industrial self-sufficiency strengthen long-term demand prospects.
India: Sulfuric Acid Market Growth Trends
India’s sulfuric acid market growth is primarily influenced by fertiliser manufacturing, metal processing, and the chemical sector. Rising demand for phosphate fertilisers, coupled with investments in refineries and smelting plants, drives consumption. Domestic producers are increasingly focusing on sulfur recovery from industrial waste to meet sustainability goals and reduce dependence on imported raw materials.
Europe: Sulfuric Acid Market Sustainability Trends Support Growth
Europe has seen significant growth in the market in the forecast period. Europe’s sulfuric acid market is mature yet evolving, supported by consistent demand from fertilisers, automotive batteries, and chemical industries. Stringent environmental regulations and energy-efficiency goals drive the adoption of advanced sulfur recovery and recycling technologies. The focus on sustainability and closed-loop manufacturing systems enhances competitiveness and production reliability across the continent.
Germany: Sulfuric Acid Market Industrial Base Support Growth
Germany’s sulfuric acid market benefits from a diversified industrial base, advanced technology, and strong environmental compliance frameworks. The country’s emphasis on circular economy practices promotes sulfur recovery and reuse across refineries and chemical plants. Stable demand from the battery, fertiliser, and manufacturing sectors ensures steady consumption with minimal environmental impact.
North America: The Sulfuric Acid Market Has Seen Growth Due To Widespread Use Of The Product
North American sulfuric acid market continues to expand due to its widespread use in fertilisers, chemical synthesis, and metal processing. Demand from the automotive and industrial sectors remains high. Ongoing investments in cleaner technologies, recycling methods, and stringent emission control standards are helping regional manufacturers reduce production costs and environmental impact.
United States: Sulfuric Acid Market Analysis
In the United States, sulfuric acid production is supported by large-scale phosphate fertiliser manufacturing, petroleum refining, and battery industries. The presence of advanced chemical infrastructure and established industrial players sustains market stability. Moreover, the transition toward green manufacturing practices and sulfur recovery technologies is enhancing domestic production efficiency and competitiveness in export markets.
South America Has Seen Growth With Government Support
The South American sulfuric acid market benefits from robust agricultural activity, particularly in phosphate fertiliser production, and significant mining operations. The region’s rich mineral resources and growing industrial base ensure steady consumption. Expansion of infrastructure and government support for agribusiness development further drives demand for sulfuric acid across key economies.
Brazil: Sulfuric Acid Market Trends
Brazil dominates sulfuric acid consumption in South America, driven by its strong agricultural sector and mineral refining activities. The nation’s large-scale fertiliser industry is the primary consumer, while increasing mining and metal extraction projects further contribute to growth. Local production is expanding with improved logistics and modernised facilities to reduce reliance on imports.
Middle East & Africa (MEA): Sulfuric Acid Market Has Seen Growth Due To Increasing Demand For Its Application
The MEA sulfuric acid market is witnessing significant growth due to rising investments in petrochemicals, fertilisers, and metal refining. New industrial and infrastructure projects in oil-rich economies are spurring demand for sulfuric acid in both upstream and downstream applications. The region is increasingly adopting modern technologies to enhance production efficiency and sustainability.
GCC Countries: Sulfuric Acid Market Trends
In GCC countries, sulfuric acid demand is expanding rapidly with diversification efforts in non-oil sectors such as fertilisers, chemicals, and refining. Saudi Arabia and the UAE lead production through integrated industrial hubs. Investments in eco-efficient sulfur recovery units and export-oriented production capacities are driving regional competitiveness and long-term market growth.
Recent Developments
- In May 2025, Sumitomo Corporation formed a joint venture with Thailand's NFC Public Company Limited to establish a sulfuric acid tank terminal business. This partnership aims to strengthen logistics infrastructure in Thailand and Asia to meet the growing demand for sulfuric acid in various industries.(Source: www.chemanalyst.com)
- In April 2025, Metso launched the Cu POX leaching process, a sustainable leaching solution designed for treating high-copper sulfide concentrates. This innovative technology aims to enhance efficiency and recovery rates for copper production while reducing the environmental impact compared to traditional smelting methods.(Source: www.panorama-minero.com)
Top Players In The Sulfuric Acid Market & Their Offerings:
OCP Group
Corporate Information
- Name: OCP Group (formerly Office Chérifien des Phosphates)
- Headquarters: Morocco; state owned entity (≈ 95% by Moroccan state, ≈ 5% by Banque Centrale Populaire investment funds)
- Sector: Mining (phosphate rock), fertilisers (phosphate based), chemicals, soil fertility & plant nutrition solutions.
- Global presence: Present on five continents; works with hundreds of customers worldwide.
History and Background
- Origins: Founded in 1920 in Morocco under the name “Office Chérifien des Phosphates”.
- Early years: Mining production began in 1921 at the Khouribga mine.
- Expansion: Over decades, the company expanded mining (Youssoufia in 1931, Benguerir in 1976) and chemical production (Safi in 1965, Jorf Lasfar in 1984)
Key Developments and Strategic Initiatives
- Green Investment Strategy (2023 2027): OCP has committed ~US$13 billion over the 2023 27 period to green projects aiming for 100% renewable energy by 2027, full carbon neutrality (Scopes 1 & 2 by 2030, Scope 3 by 2040).
- Water & desalination: Targeting water self sufficiency using non conventional water sources (desalination etc).
- Eg: plan to reach 560 million m³ per year desalination capacity by 2027.
Mergers & Acquisitions
- Acquisition example: In February 2025, OCP increased its stake in GlobalFeed (animal nutrition firm) to 75% (previously acquired in May 2023) to strengthen its feed phosphate solutions business.
Partnerships & Collaborations
- With ENGIE (energy transition company): Signed October 2024 a Joint Development Agreement to launch renewable energy, green hydrogen/ammonia, power infrastructure, desalination projects in Morocco.
- With Maersk (logistics giant): April 2025 MoU to develop sustainable, digitalized supply chain & logistics solutions via OCP’s Specialty Products & Solutions unit.
Product Launches / Innovations
- Customised fertiliser & soil nutrition solutions: OCP is moving from commodity fertiliser to “specialty products & solutions” tailored for soils, crops, agronomic services.
- Green fertilisers & green ammonia: As part of its decarbonisation strategy, OCP targets green ammonia production (mentioned ~1 Mt by 2027, 3 Mt by 2032) tied to fertiliser production.
Key Technology Focus Areas
- Renewable energy (solar, wind) + energy storage: To power their chemical/fertiliser facilities and reduce carbon footprint.
- Green hydrogen / ammonia production: To enable greener fertiliser manufacture and reduce fossil based feedstock.
- Logistics / supply chain digitalisation: Partnering to digitise and make global distribution more resilient and sustainable.
R&D Organisation & Investment
- OCP emphasises innovation at the core of its strategy. For instance, OCP claims to base its growth partly on “customised products, services and digital tools” for agriculture.
- Academic industry linkages: For example, within the Maersk agreement there is mention of joint academic training initiatives with Mohammed VI Polytechnic University (UM6P) for logistics & sustainability.
SWOT Analysis
Strengths
- Leader in phosphate/plant nutrition sector: strong resource base (access to > 70% of world’s phosphate reserves).
- Integrated value chain from rock to fertiliser, soil solutions, specialty products.
- Strong cost leadership & logistics optimisation (e.g., pipeline vs rail) in mining/transport
Ambitious sustainability strategy aligning with global decarbonisation and agriculture needs.
Weaknesses
- Heavy reliance on raw materials mining and chemical processing, which are energy and water intensive risks from climate/regulation.
- Concentration of operations in Morocco may expose to geopolitical, regulatory, environmental and social risks.
- Transition to value‑added/specialty products may require capability shifts, markets & partnerships (execution risk).
Opportunities
- Growing demand for fertilisers and soil‑nutrition solutions in Africa and globally especially as yields rise and agriculture modernises.
- Transition to green fertilisers, green ammonia, renewable‑powered chemical complexes new business model and competitive differentiation.
- Partnerships for logistics, digitalization, custom solutions open new service‑oriented revenue streams.
Threats
- Commodity price volatility (phosphate rock, fertilisers) and input costs (energy, water, logistics) could squeeze margins.
- Competitive pressures from other global fertiliser/chemical companies, as well as potential regulatory constraints (environment, mining, water).
- Social/environmental scrutiny (e.g., mining impact, water‑use, local communities) may impose reputational or regulatory burdens.
- Geopolitical risks: Dependence on global trade, export logistics, potential supply chain disruptions.
Recent News & Strategic Updates
- In May 2025: OCP & SACE (Italian export credit agency) agreed a €365 million green financing facility first under OCP’s “Green Finance Framework” reinforcing OCP’s sustainable growth drive.
- April 2025: OCP and Maersk signed an MoU to deliver global digitalized, sustainable supply chain solutions via OCP’s Specialty Products & Solutions unit.
Other Top Players Are

- BASF SE: A leading producer of sulfuric acid for industrial and chemical applications, BASF uses it in fertiliser manufacturing, metal processing, and chemical synthesis. The company emphasises efficiency and sustainability through energy recovery in acid production processes.
- The Mosaic Company: One of the largest integrated producers of phosphate fertilisers, Mosaic manufactures sulfuric acid as a key intermediate used in phosphate processing, supplying both captive and external industrial demand.
- INEOS Group Holdings S.A.: Produces sulfuric acid and oleum for chemical, refining, and metal processing industries. INEOS emphasises integrated supply chains and high-purity acid production across its European facilities.
- DuPont de Nemours, Inc.: Supplies high-quality sulfuric acid and regeneration services for refining, semiconductor, and speciality chemical industries, focusing on sustainability and process optimisation.
- Boliden Group
- Aurubis AG
- PVS Chemicals Inc.
- Koch Industries, Inc.
- Chemtrade Logistics Income Fund
- Trident Group
- Sumitomo Chemical Co., Ltd.
- Acide Sulfurique et Dérivés
- Kronos Worldwide, Inc.
- Nutrien Ltd.
- Veolia
- Aarti Industries Ltd.
- Hindustan Zinc Ltd.
- Jubilant Industries
- Kiri Industries Ltd.
- Dharamsi Morarji Chemical Co. Ltd.
- Korea Zinc Co. Ltd.
- Linde Group
- Sumitomo Chemical
- Oriental Carbon & Chemicals
Segments Covered:
By Raw Material / Feedstock
- elemental sulfur
- recovered sulfur from petroleum refineries
- sulfur from natural gas processing
- base metal smelters
- copper smelters
- zinc & lead smelters
- pyrite ores
- iron pyrite
- mixed sulfide ores
By Manufacturing Process
- contact process
- double absorption
- single absorption
- lead chamber process
- direct oxidation
- catalytic oxidation
By Grade / Purity
- standard commercial grade (93%–98%)
- fertilizer grade
- chemical grade
- ultra-pure grade (99%+)
- semiconductor grade
- laboratory grade
- dilute acid (<93%)
- wastewater treatment grade
- industrial cleaning
By End-Use Industry
- agriculture
- fertilizer plants
- agrochemical formulators
- chemical & pharmaceutical
- specialty chemicals
- pharma intermediates
- metal & mining
- copper, zinc, nickel refining
- ore leaching units
- oil & gas
- refineries
- petrochemical plants
- water & wastewater treatment
- municipal
- industrial
By Distribution Channel
- direct sales
- bulk industrial contracts
- long-term supply agreements
- distributors & traders
- regional chemical distributors
- acid resellers
- online & e-procurement
- digital trading platforms
- chemical marketplaces
By Region
- North America
- U.S.
- Canada
- Mexico
- Europe
- Germany
- UK
- France
- Italy
- Spain
- Asia Pacific
- China
- India
- Japan
- South Korea
- Latin America
- Brazil
- Argentina
- Middle East & Africa
- Saudi Arabia
- South Africa
A Seven-Phase Framework
Our methodology is designed to be universally applicable across commodity chemicals, specialty chemicals, petrochemicals, construction chemicals, coatings, electronic chemicals, industrial gases, agrochemicals, water treatment chemicals, and performance materials. Each phase builds upon the last, creating a layered validation structure that minimizes estimation error and maximizes analytical confidence.
The framework ensures comprehensive market coverage, robust cross-validation, and reliable long-term forecasting — producing market estimates that withstand scrutiny from investors, regulators, and corporate strategy teams.

Seven-Phase Framework — Analytical Effort Distribution
Relative analytical effort allocated across each phase of the Chemicals & Materials research framework

Phase 1 - Secondary Research: Establishing the Foundation
Secondary research collects and evaluates publicly available information from authoritative sources, establishing the foundational understanding of market structure, value chain dynamics, competitive landscape, and end-use demand patterns. Every source is evaluated for credibility, recency, geographic relevance, and methodological soundness before inclusion.
Industry Associations
Sources include ACC, CEFIC, ICCA, JCIA, CPCIF, and SOCMA providing production volumes, consumption trends, capacity developments, and sustainability initiatives.
Company Disclosures
Annual reports, investor presentations, earnings transcripts, and regulatory filings reveal product portfolios, manufacturing footprints, capacity expansions, and revenue segmentation.
Government Databases
National statistical offices, customs authorities, environmental agencies, and industrial production databases provide verified statistics on output, trade flows, and regulatory compliance.
Trade Databases
UN Comtrade, ITC, Eurostat, and national customs authorities enable assessment of global product movement, import dependency, and export competitiveness across regions.
Our Secondary Research Sources
- Ministry of Chemicals and Fertilizers
- European Chemicals Agency
- United States Department of Energy
- Ministry of Industry and Information Technology
- Ministry of Economy Trade and Industry
- Ministry of Trade Industry and Energy
- National Institute of Standards and Technology
- Council of Scientific and Industrial Research
- Fraunhofer Society
- National Institute for Materials Science
Phase 2 — Supply-Side Assessment: Mapping Production Capabilities
Production Capacity Analysis
All major manufacturers are assessed for existing installed capacity, planned additions, expansions, new plant announcements, and technology adoption — mapped at global, regional, and country levels.
Capacity Utilization Adjustment
Installed capacity is adjusted using utilization rates based on demand conditions, feedstock availability, plant operating rates, maintenance schedules, and regulatory restrictions.
Manufacturer Revenue Analysis
Product-specific revenues, segment-level performance, regional distribution, average selling prices, and margin trends are evaluated to establish market value estimates.
Supply-Side Assessment — Capacity vs. Effective Production by Region
Illustrative comparison of installed capacity vs. effective production volume (after utilization rate adjustment) across major regions

Phase 3 — Demand-Side Assessment: Quantifying Chemical Consumption
Demand-side analysis quantifies chemical consumption across industries, applications, and geographies — identifying where and how chemicals are consumed throughout the value chain with precision.
End-Use Industry Analysis
Chemical demand is evaluated across automotive, construction, packaging, electronics, agriculture, healthcare, consumer goods, industrial manufacturing, energy and utilities, and water treatment. Industry output, production trends, and consumption intensity are analyzed to determine demand patterns.
Consumption Modeling
Demand is estimated using measurable indicators: kilograms per vehicle, kilograms per square meter of construction, dosage per cubic meter of water treated, kilograms per hectare of agricultural land, and kilograms per ton of manufactured products. Consumption factors are validated through industry publications and primary interviews.
Application Analysis
The market is segmented by application area to understand product performance requirements, formulation trends, technology adoption, customer preferences, and regulatory requirements improving demand accuracy and segmentation granularity.
Demand-Side Assessment — End-Use Industry Demand Distribution
Illustrative distribution of chemical & materials demand across key end-use industries

Phase 4 - Trade Flow Analysis: Balancing Regional Supply and Demand
Trade flow analysis reconciles regional supply and demand estimates through import and export data, identifying net supply positions, regional dependencies, and market imbalances. It serves as an independent validation layer that tests the consistency of supply-side and demand-side estimates.
Import Analysis
Import data is evaluated to determine volumes, source countries, product dependency, regional supply gaps, and pricing trends — identifying markets that rely heavily on external supply and where domestic production is insufficient to meet demand.
Export Analysis
Export assessments reveal production surplus, export competitiveness, regional manufacturing strength, and global market participation. Export patterns also help validate domestic production estimates and identify net exporting regions.
Apparent Consumption Model
Regional consumption is assessed using the standard apparent consumption formula:
Results identify net importing regions, net exporting regions, regional deficits, and surpluses — serving as an independent validation of supply and demand estimates.
Trade Flow Analysis — Net Supply Position by Region
Illustrative apparent consumption vs. domestic production across major regions — positive gap indicates net import dependency

Phase 5 — Primary Research: The Critical Validation Layer
Primary research tests and refines findings from secondary research through direct engagement with industry participants across the supply chain, demand side, and expert community. It captures intelligence that no database or published report can provide — the real-world experience of manufacturers, buyers, and specialists operating in the market.

Supply-Side Interviews
Conversations with chemical manufacturers, raw material suppliers, contract manufacturers, technology providers, and plant operators cover production trends, capacity utilization, pricing developments, technology shifts, and competitive dynamics.

Demand-Side Interviews
Engagement with OEMs, industrial consumers, procurement managers, distributors, formulators, and end-use manufacturers focuses on consumption trends, purchasing behavior, product substitution, demand outlook, and emerging applications.

Industry Expert Consultations
Additional interviews with industry consultants, independent experts, regulatory specialists, technical professionals, and research institutions provide deeper market context and validate key analytical assumptions.
Focus Areas of Primary Research:
Market Size & Forecast Validation
Revenue estimates, volume consumption, growth rates, forecast assumptions, regional demand.Supply Chain & Value Chain Assessment
Raw material sourcing, supply chain challenges, distribution networks, procurement practices.Production & Capacity Analysis
Manufacturing capacity, utilization rates, expansion projects, plant investments.Pricing & Cost Structure Analysis
Product pricing trends, feedstock costs, energy costs, margin pressures, pricing outlook.Competitive Landscape Assessment
Volume and value estimates confirmed to be fully consistent with one another before publicationInterview Volume by Market Scope
| Study Scope | Number of Interviews |
|---|---|
| Niche Market | 20 – 30 |
| Mid-Sized Market | 30 – 50 |
| Global Market | 50 – 80 |
| Highly Fragmented Market | 80 – 120 |
Interview Details:
Category : Manufacturers, Suppliers, Distributors, End Users, Experts/Associations
Average Duration : 30–60 Minutes
Interview Mode : Video calls, telephonic interviews, expert consultations
Interview Format : Structured / Semi-Structured questionnaire
Focus Areas of Primary Research:
Market Size & Forecast Validation :
Revenue estimates, volume consumption, growth rates, forecast assumptions, regional demand.
Supply Chain & Value Chain Assessment :
Raw material sourcing, supply chain challenges, distribution networks, procurement practices.
Production & Capacity Analysis :
Manufacturing capacity, utilization rates, expansion projects, plant investments.
Pricing & Cost Structure Analysis :
Product pricing trends, feedstock costs, energy costs, margin pressures, pricing outlook.
Competitive Landscape Assessment :
Market share, competitor positioning, strategic initiatives, partnerships, acquisitions.
Primary Research — Stakeholder Coverage by Category
Distribution of interview respondents across stakeholder categories (% share from PPT data)

Primary Research — Respondent Designation Profile
Seniority breakdown of interview respondents (% share from PPT data)

Primary Research — Geographic Coverage of Interviews
Regional distribution of primary research engagement (% share from PPT data)

Phase 6 — Data Triangulation and Market Validation
No single methodology is relied upon in isolation. Multiple independent estimation approaches are combined and reconciled to ensure consistency, accuracy, and analytical defensibility. Any material deviations between approaches are investigated and adjusted through additional validation cycles.
The final market size is derived through weighted triangulation of all validated methodologies. Any material deviations between approaches are investigated and adjusted through additional validation cycles. The outcome represents the most realistic assessment of the market based on available evidence and expert confirmation ensuring that volume and value estimates are fully consistent with one another.
Triangulation Framework — Input Contribution Weight
Relative weight each sizing input contributes to the final reconciled market estimate

Phase 7 — Forecast Modeling: Projecting Future Market Evolution
Forecasting evaluates the future trajectory of the market using a combination of quantitative indicators and qualitative assessments across economic, industry, and regulatory dimensions. Rather than simple extrapolation, each driver is independently modeled and integrated into a composite forecast.
Macroeconomic Indicators
GDP growth, industrial production, manufacturing output, construction activity, consumer spending, and capital investment form the quantitative foundation of long-term demand projections. These are applied at country, regional, and global levels.
Industry Growth Drivers
Urbanization, infrastructure development, industrialization, technological innovation, sustainability initiatives, and evolving product performance requirements are assessed at regional and industry levels — capturing both structural and cyclical demand drivers.
Capacity Expansion Analysis
Announced plant expansions, new manufacturing facilities, technology upgrades, and strategic investments are evaluated to determine future supply-demand dynamics and potential market tightness or oversupply situations.
Regulatory & Sustainability
Environmental regulations, chemical safety standards, emission reduction targets, circular economy initiatives, and sustainability requirements are incorporated as they often influence product adoption rates and market growth trajectories.
Scenario Forecast Range — Indexed Market Growth (Year 1–10)
Illustrative indexed growth trajectories across Base, Optimistic, and Pessimistic scenarios over a 10-year forecast horizon

Forecast Drivers — Relative Impact Score by Category
Impact score (0–100) of each driver type on chemicals & materials market forecast




Comments
Share your thoughts, ask a question, or provide feedback about this report.