
Water Treatment Polymers Market Size, Competitive Landscape Analysis Report 2035
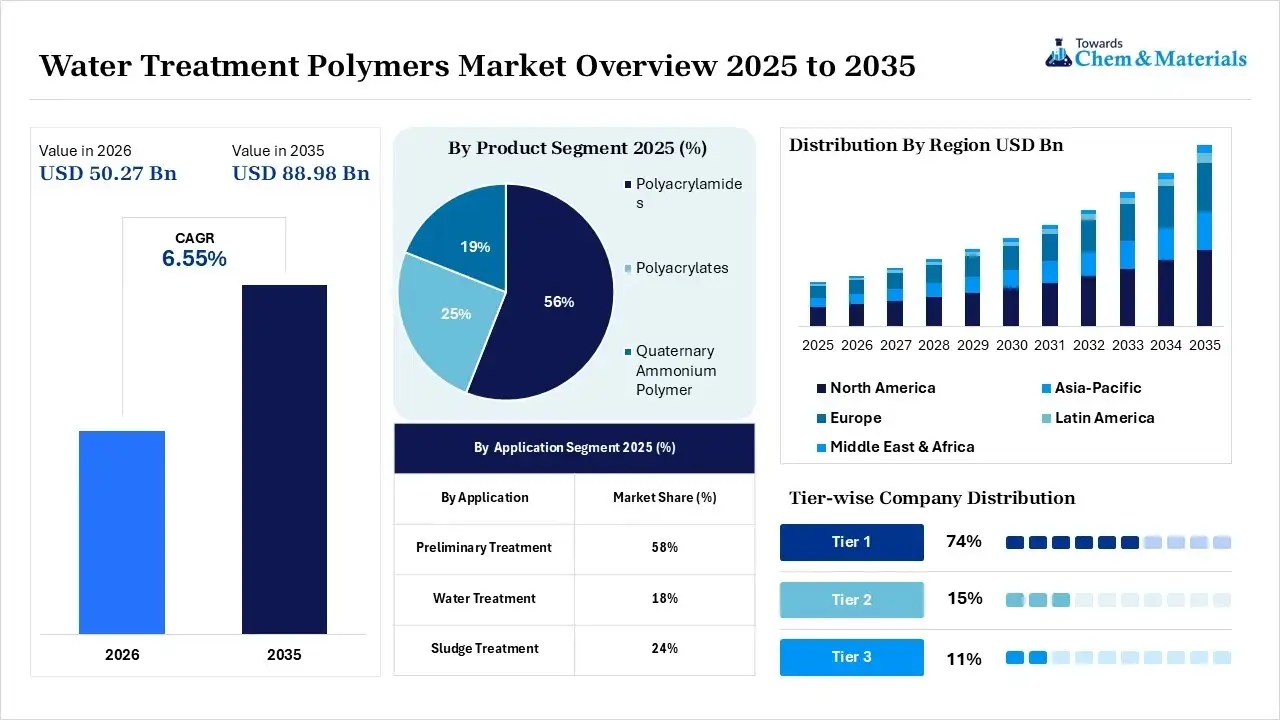
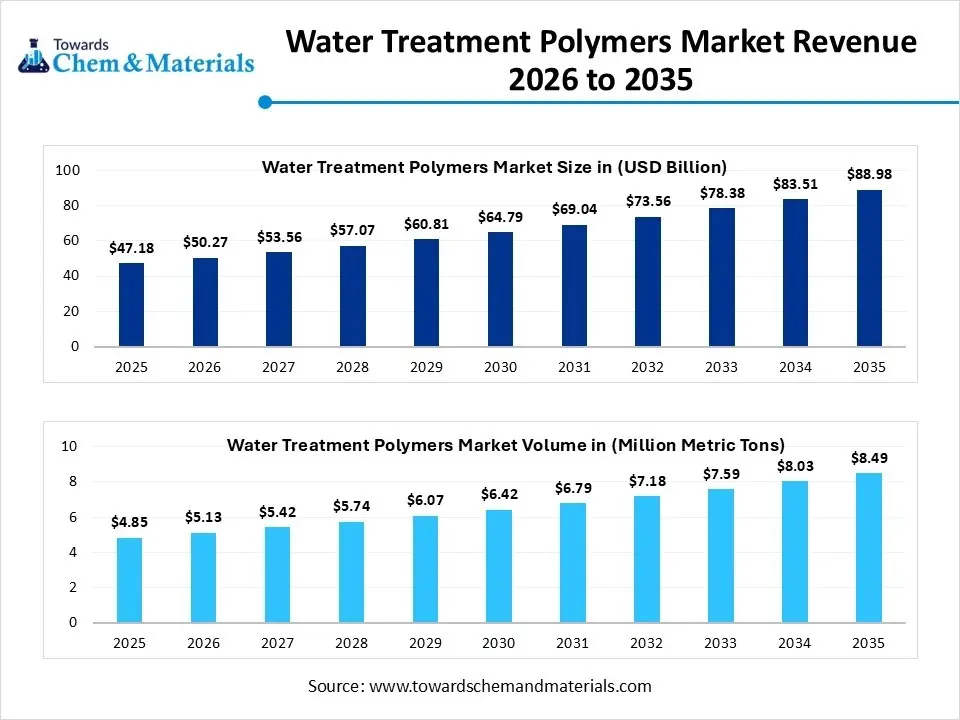
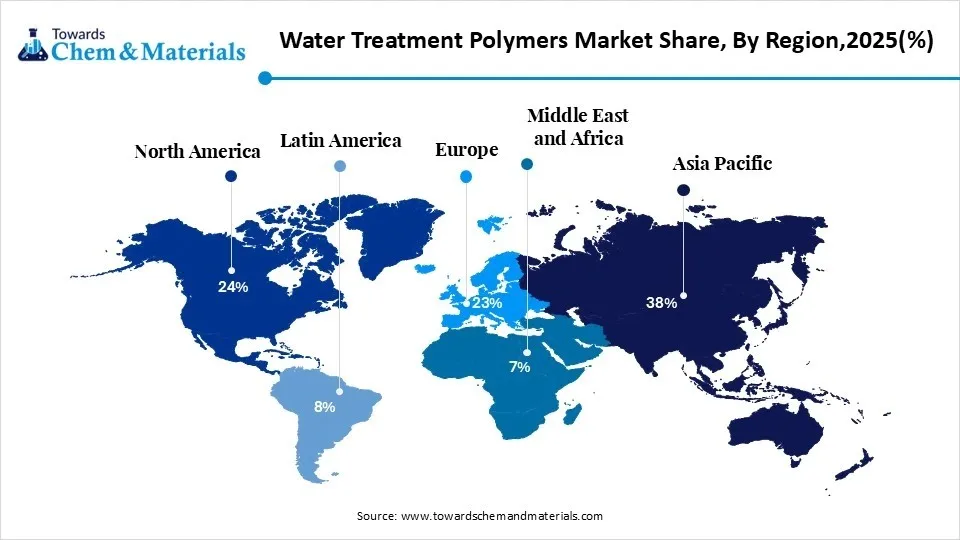
The global water treatment polymers market size was valued at USD 47.18 billion in 2025, is estimated to reach USD 50.27 billion in 2026, and is projected to reach USD 88.98 billion by 2035, exhibiting a compound annual growth rate (CAGR) of 6.55% over the forecast period from 2026 to 2035. Asia Pacific dominated the water treatment polymers market with the largest revenue share of 38% in 2025 and is expected to grow at the fastest CAGR of 6.69% during the forecast period. The growth of the market is driven by the strict laws that protect the environment, the need to reuse water due to scarcity, and rising industrial growth, fueling market expansion. Top players in the market, like BASF SE, Ecolab Inc., and SNF Group, are driving massive industry growth. Firms like Kemira Oyj, Dow Chemical, and Solenis LLC provide specialty chemical formulas to purify municipal and industrial water, according to the latest report.
Key Takeaway
- By region, Asia Pacific dominated the market with a share of 38% in 2025. Rapid industrialization, urbanization, and municipal water infrastructure investments fuel demand
- By region, North America held 24% market share in 2025 and is expected to experience the fastest growth with a CAGR of 8.12% in the forecast period. Aging water infrastructure and industrial wastewater regulations support polymer demand.
- By product type, the polyacrylamides segment dominated the market with 56% share in 2025. Widely used in municipal and industrial.
- By product type, the polyacrylates segment held 25% market share in 2025 and is expected to have the fastest growth with a CAGR of 8.18% in the forecast period. High dispersing efficiency improves industrial water treatment performance.
- By application, the preliminary treatment segment dominated the market with 58% share in 2025. Increasing use of coagulation and flocculation enhances primary treatment efficiency.
- By application, the water treatment segment held 18% market share in 2025 and is expected to have the fastest growth with a CAGR of 7.64% in the forecast period. Growing freshwater scarcity increases investment.
- By end use, the industrial segment dominated the market with 39% share in 2025. Industrial water reuse and zero-liquid-discharge projects expand rapidly.
- By end use, the municipality segment held 28% market share in 2025 and is expected to have the fastest growth with a CAGR of 7.81% in the forecast period. Governments expand drinking water and wastewater treatment infrastructure.
According to Towards Chemicals and Materials Analytics and Consulting, the global water treatment polymers market volume was valued at 4.85 million metric tons in 2025 and is expected to surpass around 8.49. million metric tons by 2035, accelerating a compound annual growth rate (CAGR) of 5.35% over the forecast period from 2026 to 2035.
Water Treatment Polymers Market: Why This Market Matters?
The water treatment polymers market is crucial because it supplies the key chemicals needed for water purification. These polymers help remove harmful waste and particles, protecting the environment, providing safe drinking water, and enabling industries to reuse water. They work by causing tiny, floating dirt particles to stick together into larger clumps, making filtration easier. Governments worldwide enforce strict regulations on what factories and cities can discharge into rivers, and polymers assist these entities in complying with laws by cleaning their wastewater.
As fresh water sources become scarcer globally, wastewater treatment and recycling are increasingly vital. Cities rely on these polymers to treat drinking water and pre-treat raw sewage before release. Industries like mining, oil and gas, and food production generate substantial wastewater; polymers help clean this water for safe disposal or reuse, representing about 40% of market demand.
The largest market is in the Asia Pacific, driven by rapid urban growth and government initiatives in countries like India to improve water systems. The demand for bio-based and biodegradable polymers is rising, supporting environmental protection while maintaining water quality.
- For instance, AVI Polymers Limited launched AVI Waste Management Private Limited, a wholly owned subsidiary focused on developing AI-based carbon intelligence, sustainability reporting, and carbon-credit enablement systems for small and medium enterprises and startups.(Source: www.constructionworld.in)
Market Trends
- Demand for eco-friendly and biodegradable polymers increases the demand and driving the growth of the market.
- Integration of smart technologies and incorporation of AI, the internet of things enhances the efficiency of the water treatment process.
- Stringent environmental regulation and imposing stricter standards by regulatory bodies compel industries to adopt advanced polymer-based treatment solutions.
- Investment in research and development, and focus on advanced polymer advancement, drives the growth.
Market Report Scope
| Report Attributes | Details |
| Market Volume in 2026 | USD 50.27 Billion / 5.13 Million Metric Tons |
| Expected Volume by 2035 | USD 88.98 Billion/ 8.49 Million Metric Tons |
| Growth Rate from 2025 to 2035 | CAGR 6.55% |
| Base Year of Estimation | 2025 |
| Forecast Period | 2025-2035 |
| Dominant Region | Asia Pacific |
| Segment Covered | By Product , By Application, By Region |
| Key Companies Profiled | Ashland, Arkema, BASF SE, CP Kelco US Inc., DuPont, Gantrade Corporation, Kemira, Kuraray Co. Ltd, Merck KGaA, Mitsubishi Chemical Corporation, Nouryon, Polysciences Inc., SNF Group, Sumitomo Seika Chemicals Company |
Supply Chain Analysis of Water Treatment Polymers Market
Polymer Production & Formulation
- Water treatment polymers are produced through polymerization and chemical modification processes to manufacture coagulants, flocculants, dispersants, and scale inhibitors that improve water and wastewater treatment efficiency.
- SNF Group manufactures a wide range of water-soluble polymers, including flocculants and coagulants, that improve solid-liquid separation and water purification in municipal and industrial treatment plants.
- Key Players: SNF Group, Kemira, BASF, Solenis.
Quality Testing & Certification
- Water treatment polymers must comply with standards for chemical purity, treatment efficiency, environmental safety, and potable water regulations before commercial use.
- Kemira provides specialty polymers and water treatment chemicals that meet global regulatory standards for municipal water treatment, wastewater recycling, and industrial process water applications.
- Key Authorities & Standards: International Organization for Standardization, NSF International, U.S. Environmental Protection Agency, European Chemicals Agency.
Distribution to End-Use Industries
- Water treatment polymers are supplied to municipal water utilities, wastewater treatment facilities, oil and gas companies, power plants, mining operations, and pulp and paper industries.
- Solenis supplies advanced water treatment polymers and process solutions for industrial and municipal customers, helping improve water quality, operational efficiency, and sustainability across multiple industries.
- Key Suppliers: SNF Group, Kemira, Solenis.
Market Opportunity
Rapid Urbanization And Growing Demand From Emerging Economies Create Growth Opportunities
One major opportunity in the water treatment polymers market lies in the growing demand from emerging economies. Rapid urbanization, expanding industrial sectors, and increasing awareness of waterborne diseases are driving the need for effective water and wastewater treatment solutions in these regions.
Governments are investing heavily in water infrastructure and sanitation projects, often backed by international funding and public-private partnerships. This creates a significant opportunity for polymer manufacturers to introduce cost-effective, efficient, and eco-friendly solutions tailored to local needs, thereby expanding their market footprint and addressing critical water challenges.
Water Treatment Polymers Market Challenge
Growing Environmental And Health Concerns Hinder The Growth Of The Market
One significant challenge in the water treatment polymers market is the environmental and health concerns associated with synthetic polymers, particularly those derived from petrochemicals. Many conventional polymers, such as polyacrylamides, can leave behind residual monomers like acrylamide, which are toxic and potentially carcinogenic.
The disposal of sludge containing these polymers can also lead to long-term environmental contamination. As regulatory scrutiny increases and demand for sustainable solutions grows, manufacturers face pressure to develop safer, biodegradable alternatives without compromising performance or significantly increasing costs, posing both a technological and economic hurdle.
Segmental Insights
Product Type Insights
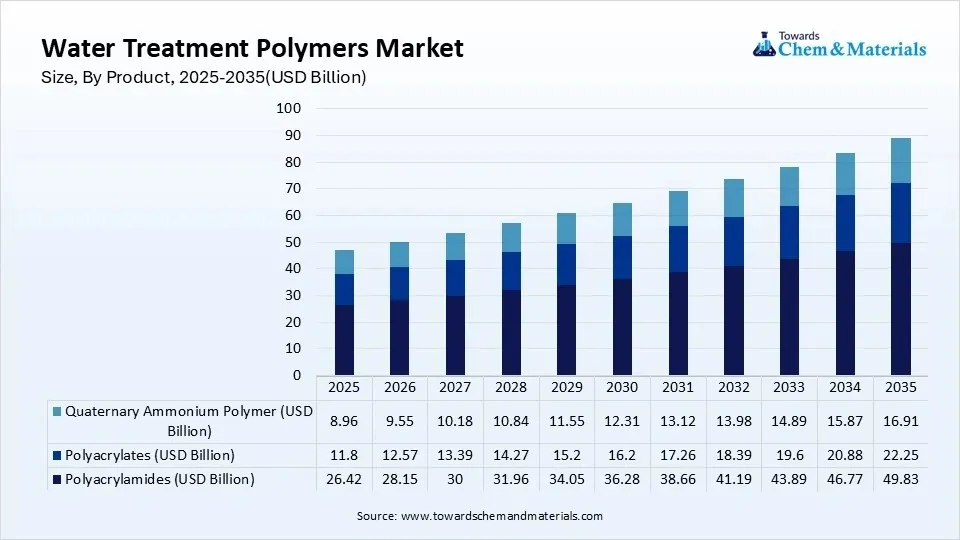
The polyacrylamides segment dominated the water treatment polymers market share 56% in 2025. Polyacrylamide is one of the most widely used polymers in water treatment, primarily due to its excellent flocculation and coagulation properties. It is commonly applied in both anionic and cationic forms to aggregate suspended particles in wastewater, making them easier to remove.
Industries such as municipal water treatment, oil and gas, paper manufacturing, and mining extensively rely on polyacrylamide to enhance sedimentation and improve sludge dewatering efficiency. Its versatility, effectiveness at low dosages, and adaptability to various water chemistries make it a preferred choice. Ongoing advancements in polymer chemistry are also leading to the development of more environmentally friendly and high-performance polyacrylamide variants, further strengthening its market presence.
The polyacrylates segment expects significant growth in the water treatment polymers market during the forecast period. Polyacrylate polymers are widely used in water treatment applications due to their ability to act as effective dispersants and flocculants. These polymers are particularly valuable in controlling scale formation, dispersing solids, and enhancing the efficiency of water purification processes.
Polyacrylate is commonly utilized in industries such as water treatment, textiles, paper, and detergents, where it helps prevent fouling and scaling in pipes and machinery. Its water-soluble nature and ability to adjust to various water conditions make it suitable for both municipal and industrial wastewater treatment. The growing demand for more efficient and cost-effective treatment solutions is driving the increased use of polyacrylate, especially in regions facing water scarcity and contamination issues.
Water Treatment Polymers Market Share, By Product,2025(%)
| By Product | Market Share (%) |
| Polyacrylamides | 56% |
| Polyacrylates | 25% |
| Quaternary Ammonium Polymer | 19% |
Application Insights
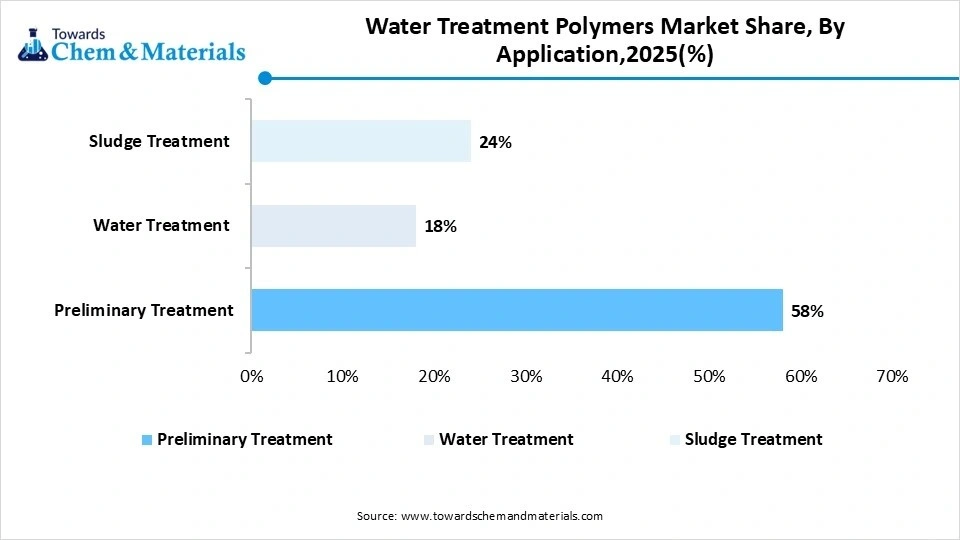
The preliminary treatment segment dominated the water treatment polymers market share 58% in 2025. Preliminary treatment refers to the initial stage in the water or wastewater treatment process, focusing on the removal of large debris, solids, and other materials that could damage equipment or hinder the efficiency of subsequent treatment stages. This phase typically includes processes such as screening, grit removal, and primary sedimentation.
The primary goal is to reduce the load on more advanced treatment systems, ensuring that finer filters and biological treatment processes can operate more effectively. In water treatment plants, preliminary treatment often involves the use of chemicals like coagulants and flocculants, such as polyacrylamide, to help remove larger particles and settle out solid waste. This stage is crucial for improving the efficiency of overall water treatment and ensuring the longevity and performance of treatment infrastructure.
The water treatment segment expects significant growth in the water treatment polymers market during the forecast period. Water treatment is a crucial process aimed at making water safe for human consumption, industrial use, and environmental discharge. It encompasses a series of physical, chemical, and biological processes designed to remove contaminants, pathogens, and undesirable chemicals from raw water sources.
The treatment process typically involves several stages, including coagulation and flocculation, sedimentation, filtration, and disinfection. In many cases, polymers like polyacrylamide, polyacrylate, and other coagulants and flocculants are used to enhance the removal of suspended solids and organic matter.
Advanced water treatment also includes technologies such as reverse osmosis, ultraviolet disinfection, and activated carbon filtration, which help in removing dissolved solids and improving the quality of water. As water scarcity and quality issues become more pressing globally, efficient water treatment is essential to ensure public health, environmental sustainability, and the reuse of water resources.
Water Treatment Polymers Market Share, By Application,2025(%)
| By Application | Market Share (%) |
| Preliminary Treatment | 58% |
| Water Treatment | 18% |
| Sludge Treatment | 24% |
End Use Insights
The industrial segment dominated the water treatment polymers market share 39% in 2025. Industrial water treatment is a specialized segment focused on addressing the unique water needs of various industries, including manufacturing, oil & gas, power generation, food and beverage, textiles, and pharmaceuticals. Water used in industrial processes often requires treatment to remove contaminants, control scaling and fouling, and ensure the safe discharge of effluents.
The use of water treatment polymers such as polyacrylamide, polyacrylate, and others is widespread in industrial applications to improve the efficiency of processes like cooling, boiler water treatment, and wastewater treatment. These polymers help in the flocculation and coagulation of suspended solids, control scale formation, and enhance the dewatering of sludge. Given the increasing regulatory pressure on industrial effluent management and the need for water reuse, industries are investing in advanced water treatment technologies and efficient polymers to reduce costs, comply with environmental standards, and improve operational efficiency.
The municipality segment expects significant growth in the water treatment polymers market during the forecast period. Municipal water treatment involves the treatment of water used by public systems to ensure it is safe for drinking, bathing, and other domestic purposes. This segment focuses on providing clean, potable water to communities and treating wastewater for safe disposal or reuse. The processes include coagulation, flocculation, sedimentation, filtration, and disinfection, often supported by polymers like polyacrylamide and polyacrylate to improve the removal of suspended solids and organic contaminants.
Municipal water treatment also plays a critical role in reducing the spread of waterborne diseases and meeting regulatory standards for water quality. As urban populations grow and water demand increases, municipalities are adopting more advanced treatment technologies and polymer solutions to address challenges such as aging infrastructure, water scarcity, and contamination control, ensuring sustainable and efficient water management for communities.
Water Treatment Polymers Market Share, By End Use,2025(%)
| By End Use | Market Share (%) |
| Residential Buildings | 14% |
| Commercial Buildings | 19% |
| Municipality | 28% |
| Industrial | 39% |
Regional Insights
How did Asia Pacific dominate the water treatment polymers market in 2025?
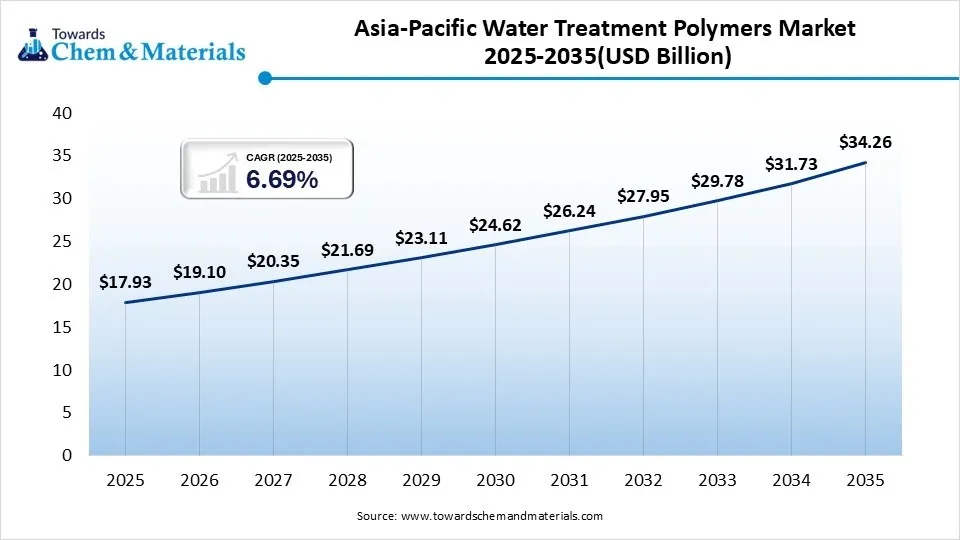
The Asia Pacific water treatment polymers market size was estimated at USD 17.93 billion in 2025 and is projected to reach USD 34.26 billion by 2035, growing at a CAGR of 6.69% from 2026 to 2035. Asia Pacific dominated the market with the largest share of 38% in 2025. This leadership position was driven by rapid industrialization, large-scale urban growth, and aggressive government investments in wastewater infrastructure. Expanding environmental mandates and strict limits on toxic effluent discharges forced manufacturing plants to treat and reuse their water. Massive water treatment plants, such as large-scale wastewater reclamation facilities in countries like South Korea, heavily drive the need for polymer purification and sludge-removal processes.
China
- The Chinese government forces industrial plants, especially in chemicals, textiles, and mining, to recycle up to 95% of their water. Strict rules require factories to treat all wastewater before it leaves the building.
- The government plans aim to build or update 80,000 kilometers of sewage pipes and expand daily sewage treatment capacity by 20 million cubic meters.
India
- The Indian government has tight rules for factories so they do not dump dirty water into nature. Programs like the Namami Gange Program and Swachh Bharat Mission force cities and companies to clean their sewage and waste.
- In India, big oil companies use water-soluble polymers to help pump oil out of the ground. This process uses a large amount of polymers and brings a lot of money to the market.
North America Water Treatment Polymers Market Growth Factor
North America held a market share of 24% in 2025 and is expected to grow at the fastest CAGR of 8.12% over the forecast period, driven by strict environmental laws, the booming shale gas and oil extraction industries, and a massive demand for clean municipal water. These polymers are essential for purifying water, removing waste, and aiding in hydraulic fracturing. Government regulations, such as the Clean Water Act in the U.S. and equivalent rules in
Canada, require safe and clean industrial and municipal wastewater before it is released back into the environment. This drives high demand for polymers to filter, clean, and manage waste sludge.
United States
- The U.S. government forces cities and businesses to clean their wastewater. Laws like the Clean Water Act demand that plants remove dangerous materials before releasing water back into nature. This means plants must buy more specialty polymers to filter out waste.
- As the U.S. population grows, there is less fresh water available. Cities and towns use polymers as flocculants and coagulants. Polymers are chemicals that stick tiny floating dirt particles together. These larger clumps sink to the bottom, so the water becomes clean and safe.
Canada
- Canada has large oil sands, mining, and manufacturing sectors. These industries use vast amounts of water and need chemical polymers for extraction, washing, and dealing with mining waste.
- There is a growing demand for bio-based polymers. People and governments want natural, renewable products (made from plants) instead of synthetic chemicals.
Europe Water Treatment Polymers Market Growth Factor
Europe held a market share of 23% in 2025, driven by strict environmental regulations, high demands for municipal wastewater treatment upgrades, and a growing shift toward bio-based, sustainable chemical alternatives. European countries must comply with strict rules like the EU Water Framework Directive. New limits on phosphorus, nitrogen, and toxic discharges force water plants to use more coagulants and flocculants to clean water effectively. Heavy financial investments like the AMP8 (Asset Management Plan) funding in the UK and the EU Cohesion Fund are funding large-scale upgrades for aging water networks.
Germany
- Laws like the German Drinking Water Ordinance and the EU Water Framework Directive force industries and cities to clean their water better.
- Environmentally friendly polymers are growing rapidly. These are made from natural things like plants. Germany is strongly focused on green chemistry. Many factories are switching to these safer polymers to meet strict rules.
France
- The European Union Water Framework Directive and local French laws require industries to clean their wastewater before releasing it. This forces factories to use specialized polymers to remove harmful materials safely.
- Many French industries are adopting ZLD systems. These systems recycle all water inside a facility, requiring high-performance polymers for advanced filtration.
Latin America Water Treatment Polymers Market Growth Factor
Latin America held a market share of 8% in 2025, due to strict environmental laws, rising industrial pollution, and the need for better wastewater treatment. Major industries like mining, pulp and paper, and food and beverage processing drive the majority of regional demand. Latin America is a global mining hub. Large amounts of water are used in extracting metals like copper and lithium. Polymers are vital for sludge dewatering, removing water from waste, and separating minerals.
Brazil
- National agencies, such as Brazils ANA, are enforcing stricter laws on industrial waste discharge. This forces factories to clean their water before throwing it away.
- Brazils massive food and beverage sector requires clean water for production. Polymers are heavily used here to treat runoff and wastewater.
Argentina
- Argentina’s large agricultural, mining, and oil sectors require vast amounts of pure water. These industries also produce heavy wastewater that must be cleaned for reuse.
- Government mandates force factories and municipalities to treat wastewater before discharging it into rivers. Polymers help facilities meet these limits.
Middle East & Africa Water Treatment Polymers Market Growth Factor
The Middle East & Africa held a market share of 7% in 2025. The main growth factors are extreme water scarcity, heavy reliance on desalination, and rising industrial wastewater from the oil and gas sector. Governments are investing heavily in water recycling to meet rising demand. The regions major industries, especially petrochemicals and oil extraction in countries like Saudi Arabia, the UAE, Iran, and Iraq, produce massive amounts of dirty wastewater. This water must be treated before it is safely reused or thrown away.
Saudi Arabia
- The Saudi Arabia water treatment polymers market is growing rapidly due to the countrys severe water scarcity and heavy reliance on seawater desalination
- Saudi Arabia produces about 70% of its drinking water from desalinated seawater. Plants like Ras Al Khair need polymers to remove impurities and stop mineral buildup.
- Government goals under Vision 2030 push for better water recycling. This drives the need for flocculants and coagulants to filter and clean waste.
Water Treatment Polymers Market Share, By Region,2025(%)
| Regional | Revenue Share, 2025 (%) |
| North America | 24% |
| Europe | 23% |
| Asia-Pacific | 38% |
| Latin America | 8% |
| Middle East & Africa | 7% |
UAE
- The UAE has a very dry climate and little rain. The country relies heavily on desalination, taking salt out of seawater and recycling wastewater. Water treatment polymers are essential for these purification processes.
- The UAE government strictly regulates water use and waste. National initiatives like UAE Vision 2030 require businesses to reuse water and prevent pollution.
Water Treatment Polymers Recent Developments
- In April 2026, Wyn Polymers, a manufacturer of polymer solutions, successfully commissioned a new reactor dedicated to water-based polymers at its production site in Mexico. This development represents a major milestone in the company’s efforts to address increasing market demand for sustainable coatings and adhesive technologies.(Source: www.european-coatings.com)
- In August 2025, DayOne is launching Malaysias first river water treatment system at its Kempas Tech Park facility in Johor to provide data center cooling, bypassing municipal potable water. Developed with the Johor State Water Company (JSW) and BM Tek, this initiative utilizes raw water from the Sungai Tebrau, aiming for zero-potable-water cooling in compliance with local sustainability policies.(Source: www.datacenterdynamics.com)
- In December 2025, Scientists at IIT Bhilai developed multi-arm star polymers made from industrial sulfur waste. These nanoscale structures act like microscopic sponges to remove over 80% of hydrophobic contaminants like oil, dyes, and pesticides from wastewater.(Source: www.pib.gov.in)
- In December 2025, KAIST researchers developed a filterless air purifier that removes 99.9% of ultrafine dust using nano-sized water droplets. The technology utilizes a self-watering nano-sponge structure to capture airborne particulates without traditional HEPA filters.(Source: dongascience.com)
Top Companies List
- Ashland
- Arkema
- BASF SE
- CP Kelco US Inc.
- DuPont
- Gantrade Corporation
- Kemira
- Kuraray Co. Ltd
- Merck KGaA
- Mitsubishi Chemical Corporation
- Nouryon
- Polysciences Inc.
- SNF Group
- Sumitomo Seika Chemicals Company
Segments Covered in the Report
By Product Type
- Polyacrylamides
- Anionic Polyacrylamide
- Cationic Polyacrylamide
- Nonionic Polyacrylamide
- Polyacrylates
- Sodium Polyacrylate
- Potassium Polyacrylate
- Cross-linked Polyacrylates
- Quaternary Ammonium Polymers
- PolyDADMAC
- Polyamine
- Epi-DMA Polymers
By Application
- Preliminary Treatment
- Coagulation
- Flocculation
- Water Treatment
- Drinking Water Treatment
- Industrial Water Treatment
- Wastewater Treatment
- Sludge Treatment
- Sludge Thickening
- Sludge Dewatering
- Sludge Conditioning
By End Use
- Residential Buildings
- Household Water Purification
- Community Water Systems
- Commercial Buildings
- Hotels
- Hospitals
- Office Buildings
- Educational Institutions
- Municipality
- Drinking Water Plants
- Municipal Wastewater Plants
- Industrial
- Power Generation
- Oil & Gas
- Food & Beverage
- Chemicals
- Mining
- Pulp & Paper
- Others
By Region
- North America
- U.S.
- Canada
- Europe
- Germany
- UK
- France
- Italy
- Spain
- Sweden
- Denmark
- Norway
- Asia Pacific
- China
- Japan
- India
- South Korea
- Thailand
- Latin America
- Brazil
- Mexico
- Argentina
- Middle East and Africa (MEA)
- South Africa
- UAE
- Saudi Arabia
- Kuwait
A Seven-Phase Framework
Our methodology is designed to be universally applicable across commodity chemicals, specialty chemicals, petrochemicals, construction chemicals, coatings, electronic chemicals, industrial gases, agrochemicals, water treatment chemicals, and performance materials. Each phase builds upon the last, creating a layered validation structure that minimizes estimation error and maximizes analytical confidence.
The framework ensures comprehensive market coverage, robust cross-validation, and reliable long-term forecasting — producing market estimates that withstand scrutiny from investors, regulators, and corporate strategy teams.

Seven-Phase Framework — Analytical Effort Distribution
Relative analytical effort allocated across each phase of the Chemicals & Materials research framework

Phase 1 - Secondary Research: Establishing the Foundation
Secondary research collects and evaluates publicly available information from authoritative sources, establishing the foundational understanding of market structure, value chain dynamics, competitive landscape, and end-use demand patterns. Every source is evaluated for credibility, recency, geographic relevance, and methodological soundness before inclusion.
Industry Associations
Sources include ACC, CEFIC, ICCA, JCIA, CPCIF, and SOCMA providing production volumes, consumption trends, capacity developments, and sustainability initiatives.
Company Disclosures
Annual reports, investor presentations, earnings transcripts, and regulatory filings reveal product portfolios, manufacturing footprints, capacity expansions, and revenue segmentation.
Government Databases
National statistical offices, customs authorities, environmental agencies, and industrial production databases provide verified statistics on output, trade flows, and regulatory compliance.
Trade Databases
UN Comtrade, ITC, Eurostat, and national customs authorities enable assessment of global product movement, import dependency, and export competitiveness across regions.
Our Secondary Research Sources
- Ministry of Chemicals and Fertilizers
- European Chemicals Agency
- United States Department of Energy
- Ministry of Industry and Information Technology
- Ministry of Economy Trade and Industry
- Ministry of Trade Industry and Energy
- National Institute of Standards and Technology
- Council of Scientific and Industrial Research
- Fraunhofer Society
- National Institute for Materials Science
Phase 2 — Supply-Side Assessment: Mapping Production Capabilities
Production Capacity Analysis
All major manufacturers are assessed for existing installed capacity, planned additions, expansions, new plant announcements, and technology adoption — mapped at global, regional, and country levels.
Capacity Utilization Adjustment
Installed capacity is adjusted using utilization rates based on demand conditions, feedstock availability, plant operating rates, maintenance schedules, and regulatory restrictions.
Manufacturer Revenue Analysis
Product-specific revenues, segment-level performance, regional distribution, average selling prices, and margin trends are evaluated to establish market value estimates.
Supply-Side Assessment — Capacity vs. Effective Production by Region
Illustrative comparison of installed capacity vs. effective production volume (after utilization rate adjustment) across major regions

Phase 3 — Demand-Side Assessment: Quantifying Chemical Consumption
Demand-side analysis quantifies chemical consumption across industries, applications, and geographies — identifying where and how chemicals are consumed throughout the value chain with precision.
End-Use Industry Analysis
Chemical demand is evaluated across automotive, construction, packaging, electronics, agriculture, healthcare, consumer goods, industrial manufacturing, energy and utilities, and water treatment. Industry output, production trends, and consumption intensity are analyzed to determine demand patterns.
Consumption Modeling
Demand is estimated using measurable indicators: kilograms per vehicle, kilograms per square meter of construction, dosage per cubic meter of water treated, kilograms per hectare of agricultural land, and kilograms per ton of manufactured products. Consumption factors are validated through industry publications and primary interviews.
Application Analysis
The market is segmented by application area to understand product performance requirements, formulation trends, technology adoption, customer preferences, and regulatory requirements improving demand accuracy and segmentation granularity.
Demand-Side Assessment — End-Use Industry Demand Distribution
Illustrative distribution of chemical & materials demand across key end-use industries

Phase 4 - Trade Flow Analysis: Balancing Regional Supply and Demand
Trade flow analysis reconciles regional supply and demand estimates through import and export data, identifying net supply positions, regional dependencies, and market imbalances. It serves as an independent validation layer that tests the consistency of supply-side and demand-side estimates.
Import Analysis
Import data is evaluated to determine volumes, source countries, product dependency, regional supply gaps, and pricing trends — identifying markets that rely heavily on external supply and where domestic production is insufficient to meet demand.
Export Analysis
Export assessments reveal production surplus, export competitiveness, regional manufacturing strength, and global market participation. Export patterns also help validate domestic production estimates and identify net exporting regions.
Apparent Consumption Model
Regional consumption is assessed using the standard apparent consumption formula:
Results identify net importing regions, net exporting regions, regional deficits, and surpluses — serving as an independent validation of supply and demand estimates.
Trade Flow Analysis — Net Supply Position by Region
Illustrative apparent consumption vs. domestic production across major regions — positive gap indicates net import dependency

Phase 5 — Primary Research: The Critical Validation Layer
Primary research tests and refines findings from secondary research through direct engagement with industry participants across the supply chain, demand side, and expert community. It captures intelligence that no database or published report can provide — the real-world experience of manufacturers, buyers, and specialists operating in the market.

Supply-Side Interviews
Conversations with chemical manufacturers, raw material suppliers, contract manufacturers, technology providers, and plant operators cover production trends, capacity utilization, pricing developments, technology shifts, and competitive dynamics.

Demand-Side Interviews
Engagement with OEMs, industrial consumers, procurement managers, distributors, formulators, and end-use manufacturers focuses on consumption trends, purchasing behavior, product substitution, demand outlook, and emerging applications.

Industry Expert Consultations
Additional interviews with industry consultants, independent experts, regulatory specialists, technical professionals, and research institutions provide deeper market context and validate key analytical assumptions.
Focus Areas of Primary Research:
Market Size & Forecast Validation
Revenue estimates, volume consumption, growth rates, forecast assumptions, regional demand.Supply Chain & Value Chain Assessment
Raw material sourcing, supply chain challenges, distribution networks, procurement practices.Production & Capacity Analysis
Manufacturing capacity, utilization rates, expansion projects, plant investments.Pricing & Cost Structure Analysis
Product pricing trends, feedstock costs, energy costs, margin pressures, pricing outlook.Competitive Landscape Assessment
Volume and value estimates confirmed to be fully consistent with one another before publicationInterview Volume by Market Scope
| Study Scope | Number of Interviews |
|---|---|
| Niche Market | 20 – 30 |
| Mid-Sized Market | 30 – 50 |
| Global Market | 50 – 80 |
| Highly Fragmented Market | 80 – 120 |
Interview Details:
Category : Manufacturers, Suppliers, Distributors, End Users, Experts/Associations
Average Duration : 30–60 Minutes
Interview Mode : Video calls, telephonic interviews, expert consultations
Interview Format : Structured / Semi-Structured questionnaire
Focus Areas of Primary Research:
Market Size & Forecast Validation :
Revenue estimates, volume consumption, growth rates, forecast assumptions, regional demand.
Supply Chain & Value Chain Assessment :
Raw material sourcing, supply chain challenges, distribution networks, procurement practices.
Production & Capacity Analysis :
Manufacturing capacity, utilization rates, expansion projects, plant investments.
Pricing & Cost Structure Analysis :
Product pricing trends, feedstock costs, energy costs, margin pressures, pricing outlook.
Competitive Landscape Assessment :
Market share, competitor positioning, strategic initiatives, partnerships, acquisitions.
Primary Research — Stakeholder Coverage by Category
Distribution of interview respondents across stakeholder categories (% share from PPT data)

Primary Research — Respondent Designation Profile
Seniority breakdown of interview respondents (% share from PPT data)

Primary Research — Geographic Coverage of Interviews
Regional distribution of primary research engagement (% share from PPT data)

Phase 6 — Data Triangulation and Market Validation
No single methodology is relied upon in isolation. Multiple independent estimation approaches are combined and reconciled to ensure consistency, accuracy, and analytical defensibility. Any material deviations between approaches are investigated and adjusted through additional validation cycles.
The final market size is derived through weighted triangulation of all validated methodologies. Any material deviations between approaches are investigated and adjusted through additional validation cycles. The outcome represents the most realistic assessment of the market based on available evidence and expert confirmation ensuring that volume and value estimates are fully consistent with one another.
Triangulation Framework — Input Contribution Weight
Relative weight each sizing input contributes to the final reconciled market estimate

Phase 7 — Forecast Modeling: Projecting Future Market Evolution
Forecasting evaluates the future trajectory of the market using a combination of quantitative indicators and qualitative assessments across economic, industry, and regulatory dimensions. Rather than simple extrapolation, each driver is independently modeled and integrated into a composite forecast.
Macroeconomic Indicators
GDP growth, industrial production, manufacturing output, construction activity, consumer spending, and capital investment form the quantitative foundation of long-term demand projections. These are applied at country, regional, and global levels.
Industry Growth Drivers
Urbanization, infrastructure development, industrialization, technological innovation, sustainability initiatives, and evolving product performance requirements are assessed at regional and industry levels — capturing both structural and cyclical demand drivers.
Capacity Expansion Analysis
Announced plant expansions, new manufacturing facilities, technology upgrades, and strategic investments are evaluated to determine future supply-demand dynamics and potential market tightness or oversupply situations.
Regulatory & Sustainability
Environmental regulations, chemical safety standards, emission reduction targets, circular economy initiatives, and sustainability requirements are incorporated as they often influence product adoption rates and market growth trajectories.
Scenario Forecast Range — Indexed Market Growth (Year 1–10)
Illustrative indexed growth trajectories across Base, Optimistic, and Pessimistic scenarios over a 10-year forecast horizon

Forecast Drivers — Relative Impact Score by Category
Impact score (0–100) of each driver type on chemicals & materials market forecast




Comments
Share your thoughts, ask a question, or provide feedback about this report.