
U.S. Recycled Polyester Market Size and Forecast 2026 to 2035
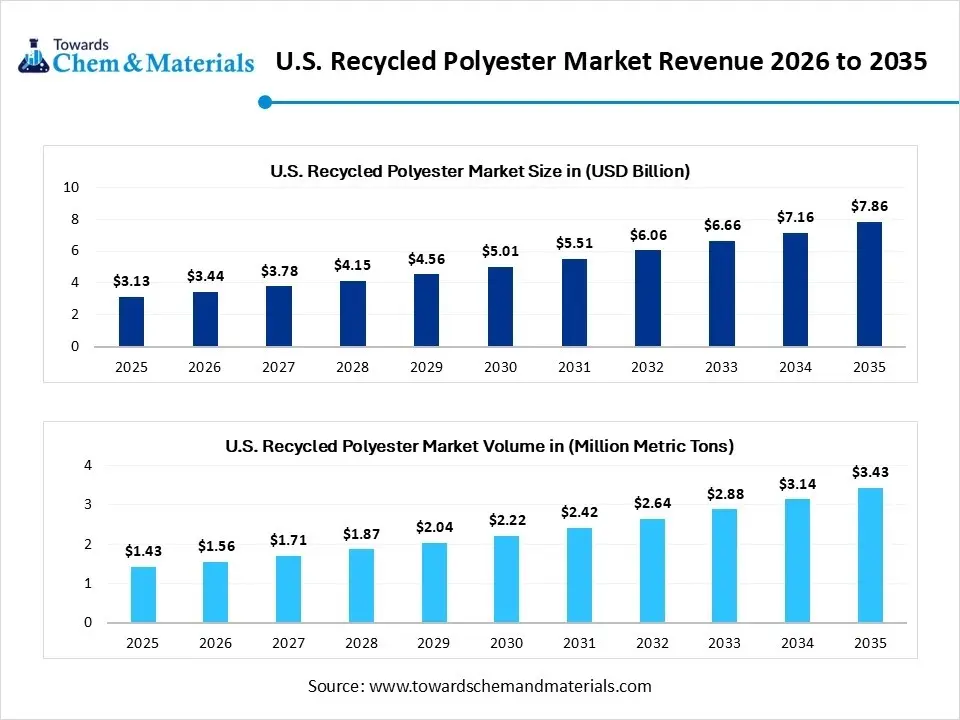
The U.S. recycled polyester market size was estimated at USD 3.13 billion in 2025 and is expected to be worth around USD 7.86 billion by 2035, growing at a CAGR of 9.69% from 2026 to 2035. In terms of volume, the U.S. recycled polyester market is projected to grow from 1.43 million metric tons in 2025 to 3.43 million metric tons by 2035. growing at a CAGR of 9.10% from 2026 to 2035.The global shift towards sustainability is set to create competitive advantages in the production spaces.
Key Takeaways
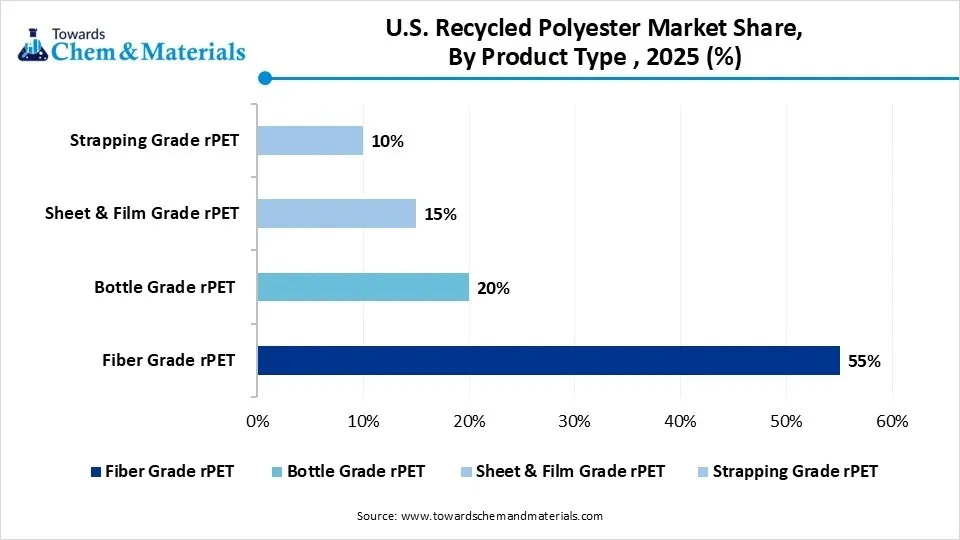
- By product type, the fiber grade segment dominated the market with approximately 55% industry share in 2025.
- By product type, the strapping grade segment is expected to grow at the fastest rate in the market during the forecast period.
- By recycling process type, the mechanical segment dominated the market with approximately 72.00% industry share in 2025.
- By recycling process type, the chemical segment is expected to grow at the fastest rate in the market during the forecast period.
- By application type, the textiles and apparel segment dominated the market with approximately 48.00% industry share in 2025
- By application type, the industrial segment is expected to grow at the fastest rate in the market during the forecast period.
- By form type, the flakes segment dominated the market with approximately 53.00% industry share in 2025.
- By form type, the pellets segment is expected to grow at the fastest rate in the market during the forecast period.
Market Size and Volume Forecast
- Market Estimated Size (2025): USD 3.13 Billion | CAGR (2026–2035): 9.69%
- Market Projected Size (2035): USD 7.86 Billion
- Market Volume (2025): 1.43 Million Metric Tons | Volume CAGR (2026–2035): 9.10%
- Market Projected Volume (2035): 3.43 Million Metric Tons
- Market Pricing for 2025:
- Average Manufacturing Price: USD 2,189/MT
- Average Selling Price: USD 2,189/MT
- Pricing CAGR (2025–2035): 9.69%
Turning Waste into Values: The Rise of Recycled Polyester in the United States
The U.S. recycled polyester market focuses on the production and utilization of polyester fibers, filaments, and resins made from post-consumer and post-industrial PET waste, primarily plastic bottles. Recycled polyester (rPET) offers equivalent strength, durability, and versatility to virgin polyester but with a lower carbon footprint and reduced energy consumption.
The market is expanding due to sustainability mandates, circular economy adoption, growing apparel brand commitments to recycled textiles, and advancements in chemical recycling technologies. Key application areas include textiles, packaging, automotive, construction, and consumer goods, positioning rPET as a central material in the U.S. sustainability landscape.
U.S. Recycled Polyester Market Outlook:
- Industry Growth Overview: Between 2025 and 2034, the emergence of greener clothing has resulted in enhanced brand positioning and product offerings in recent years. Moreover, the local manufacturers of the United States are actively involved under the establishment of the local production unit for the lower transport cost and traceable recycled products.
- Sustainability Trends: the major manufacturers are accepting the waste that has verified tags and lower carbon scores in the United States. Moreover, by choosing the concentrated supply chain that reuses water and heat between processes, the US brands have gained attention in the global sustainability industry in recent years.
- Global Expansion: The United States has seen heavy export of higher-grade recycled pellets with the same amount of cheaper feedstock imports in recent years. Moreover, several foreign investors are actively bringing new chemical recycling technology to the United States while boosting production facilities in the region.
Report Scope
| Report Attributes | Details |
| Market Size and Volume in 2026 | USD 3.44 Billion /1.56 Million Metric Tons |
| Expected Size and Volume by 2035 | USD 7.86 Billion/3.43 Million Metric Tons |
| Growth Rate from 2025 to 2035 | CAGR 9.69% |
| Base Year of Estimation | 2025 |
| Forecast Period | 2025 - 2035 |
| Segment Covered | By Product Type, By the Recycling Process, By Application, By Form |
| Key Companies Profiled | Indorama Ventures Public Company Ltd. (U.S. operations), Far Eastern New Century (FENC America), DAK Americas LLC (Alpek Polyester), Biffa Polymers (U.S. division) , Nan Ya Plastics Corporation America , Phoenix Technologies International, LLC , Placon Corporation , CarbonLite Industries (now merged into DAK Americas) , Loop Industries , Evergreen Plastics, Inc. , Mohawk Industries, Inc. , Avangard Innovative , PolyQuest, Inc. , Custom Polymers PET, LLC , Clean Tech Incorporated (Plastipak Packaging) , Perpetual Recycling Solutions, LLC , Peninsula Plastics Recycling, Inc. , Nextek, Inc. , Repreve Renewables LLC |
Intelligent Recycling: AI and Sensors Propel United States Polyester Evolution
The major manufacturer of recycled polyester in the United States has shifted towards the simple mechanical flake to fiber to mixed solutions in recent years, as per the observation. Furthermore, the increasing investment for the development of advanced tools like artificial intelligence sorting, sensors, and low-energy drying cuts contamination and energy use is anticipated to enable access to untapped or underserved markets during the forecast period.
Trade Analysis of the U.S. Recycled Polyester Market:
Import, Export, Consumption, and Production Statistics
- The United States exported a huge amount of recovered plastic around the globe in 2024, and it was worth 903 million pounds as per the published report.(Source: resource-recycling.com)
- The United States records a heavy amount of recycled polyester imports in 2024, with 10,036 shipments as per the record.(Source: www.volza.com)
Value Chain Analysis of the U.S. Recycled Polyester Market:
- Distribution to Industrial Users : Distribution of recycled polyester to industrial users in the United States primarily follows a business-to-business (B2B) model.
- Chemical Synthesis and Processing : In the United States recycled polyester (rPET) market, chemical synthesis and processing involve both widely established mechanical recycling methods and emerging advanced chemical technologies
- Regulatory Compliance and Safety Monitoring : Regulatory compliance and safety monitoring in the U.S. recycled polyester (rPET) market are managed by a combination of federal, state, and third-party standards.
U.S. Recycled Polyester Market Regulatory Landscape: Global Regulations
| Country / Region | Regulatory Body | Key Regulations | Focus Areas | Notable Notes |
| United States | Federal Trade Commission (FTC) | Green Guides for the Use of Environmental Marketing Claims (16 CFR Part 260) | Preventing greenwashing | The agency governs the safety of recycled polyester. |
Segmental Insights
Product Type Insights
How did the Fiber Grade Segment Dominate the U.S. Recycled Polyester Market in 2024?
The fiber grade segment dominated the market with approximately 54% of industry share in 2024 due to it being considered essential to produce footwear, home textiles, and clothing in the region. Furthermore, several major clothing brands are heavily promoting sustainability while using this recycled polyester as a major material.
The strapping grade segment is expected to grow at a significant rate owing to the sudden shift towards eco-friendly packaging in recent years. Also, with the surge of E-commerce and logistics, the eco-friendly strap is likely to gain major industry share in the coming years, as per the recent industry survey.
The bottle grade segment is also notably growing, akin to it offers high clarity, strength, and food-safe quality. Many beverage and food brands are switching to recycled materials to meet sustainability goals. Recycled bottle-grade polystyrene can be molded again into containers, trays, and packaging with the same look and durability as virgin plastic.
U.S. Recycled Polyester Market Share, By Product Type , 2025(%)
| By Product Type | Revenue Share, 2025 (%) |
| Fiber Grade rPET | 55% |
| Bottle Grade rPET | 20% |
| Sheet & Film Grade rPET | 15% |
| Strapping Grade rPET | 10% |
- Fiber Grade rPET: Accounting for 55% of the total market share, fiber grade rPET is the dominant product type in the U.S. recycled polyester market, commonly used in textile production for products like clothing and upholstery.
- Bottle Grade rPET: With a market share of 20%, bottle grade rPET is primarily used in the production of recycled plastic bottles, making it a significant contributor to the circular economy in packaging.
- Sheet & Film Grade rPET: Representing 15% of the market share, sheet & film grade rPET is widely utilized in manufacturing various plastic products such as packaging films and food containers.
- Strapping Grade rPET: Contributing 10% to the market, strapping grade rPET is used in the production of packaging straps, commonly used in industries like shipping and logistics to secure goods.
Recycling Process Insights
Why does the Mechanical Segment Dominate the U.S. Recycled Polyester Market?
The mechanical segment dominated the market with approximately 71% industry share in 2024, owing to the this process is known as the proven, simple, and cost-effective method. Furthermore, by turning collected PET bottles into fibers or flakes without any chemical use, the mechanical segment has gained major industry attention in recent years.
The chemical segment is expected to grow at a rapid rate owing to its offerings, like it can turn poor quality or mixed plastic into high-quality or pure recycled polyester. Moreover, the major recycling industries in the United States have seen under the heavy investment towards chemical depolymerization technologies which is likely to create lucrative opportunities in the coming years.
U.S. Recycled Polyester Market Share, By the Recycling Process , 2025(%)
| By the Recycling Process | Revenue Share, 2025 (%) |
| Mechanical Recycling | 72.00% |
| Chemical Recycling | 28.00% |
- Mechanical Recycling: Dominating the market with 72% of the total share, mechanical recycling is the most widely used method in the U.S., involving the physical processing of polyester waste into reusable fibers or pellets.
- Chemical Recycling: Accounting for 28% of the market share, chemical recycling involves breaking down polyester into its chemical components, allowing for the creation of high-quality recycled polyester, often used for more demanding applications
Application Insights
How did the Textiles & Apparel Segment Dominate the U.S. Recycled Polyester Market in 2024?
The textiles & apparel segment dominated the market with 47% of industry share in 2024 because recycled polyester is the most popular sustainable fabric choice for clothing brands. U.S. consumers love activewear, athleisure, and fast-fashion styles made from soft, durable recycled fibers. Fashion companies use recycled polyester to show environmental responsibility while keeping comfort and style.
The industrial segment is expected to grow at the fastest rate because recycled polyester is proving valuable beyond clothing, specifically in automotive interiors, construction materials, filtration, fabrics, and insulation. Industries are moving toward eco-friendly raw materials to meet corporate sustainability targets. Recycled polyester fibers offer strength, heat resistance, and durability, making them perfect for heavy-duty uses.
The packaging segment is notably growing owing to brands and consumers want eco-friendly, safe, and durable packaging options. Recycled polyester (rPET) is strong, lightweight, and transparent, making it ideal for bottles, food containers, and flexible films. Also, major beverage and food companies are pledging to use more recycled materials to meet sustainability goals and reduce plastic waste.
U.S. Recycled Polyester Market Share, By Application , 2025(%)
| By Application | Revenue Share, 2025 (%) |
| Textiles & Apparel | 48.00% |
| Packaging | 18.00% |
| Automotive | 12.00% |
| Construction | 8.00% |
| Industrial | 10.00% |
| Others | 4.00% |
- Textiles & Apparel: Holding the largest share of 48%, the textiles and apparel sector is the primary consumer of recycled polyester, used in clothing, upholstery, and other fabric-based products.
- Packaging: With 18% of the market share, the packaging industry uses recycled polyester primarily for bottles, containers, and films, contributing significantly to sustainable packaging solutions.
- Automotive: Representing 12% of the market, recycled polyester is utilized in automotive applications, including interior parts, seat covers, and insulation materials.
- Construction: Contributing 8% to the market, recycled polyester finds its application in the construction industry, particularly in materials like insulation and composite products.
- Industrial: Accounting for 10% of the market, recycled polyester is used in various industrial applications such as straps, textiles, and other products designed for heavy-duty use.
- Others: The remaining 4% of the market share is attributed to miscellaneous applications, including various niche industries where recycled polyester is used in specialized products.
Form Insights
Why does the Flakes Segment Dominate the U.S. Recycled Polyester Market?
The flakes segment dominated the market with approximately 52% industry share in 2024 because they are the starting point for nearly every recycling process. PET bottles are crushed and cleaned into flakes, which can then be used to make fibers, sheets, or straps. The process is simple, fast, and widely available.
The pellets segment is expected to grow at a rapid rate because they are more refined, higher-value, and easier to process for advanced applications. Pellets are made from melted and filtered flakes, offering better purity and consistency. They are ideal for producing strapping. films, and industrial-grade fibers. As chemical recycling grows, it will directly produce high-quality pellets ready for any use.
The fibers and filaments segment is notably growing, akin to polystyrene can be easily spun into strong, lightweight threads used in textiles, filters, and 3D printing. These fibers offer flexibility, strength, and resistance to wear, making them ideal for carpet backing, upholstery, and industrial fabrics.
U.S. Recycled Polyester Market Share, By Form, 2025(%)
| By Form | Revenue Share, 2025 (%) |
| Flakes | 53.00% |
| Pellets | 24.00% |
| Fibers & Filaments | 23.00% |
- Flakes: Representing 53% of the market share, flakes are the most common form of recycled polyester, typically used in the production of fibers, pellets, and other products across various industries.
- Pellets: Accounting for 24% of the market, recycled polyester pellets are often used in manufacturing products that require precise molding, such as containers, packaging materials, and automotive parts.
- Fibers & Filaments: Making up 23% of the market, fibers and filaments are widely used in the textile and apparel industry, serving as the raw material for making fabrics, threads, and other fiber-based products.
Recent Developments
- In September 2025, Selenis is likely to expand its production facility in the United States in the upcoming years. Also, the company introduced a sustainable textile brand called Texnascis, as per the published report.(Source: www.selenis.com)
Top U.S. Recycled Polyester Market Companies
Unifi, Inc.
Corporate Information
- Name: Unifi, Inc.
- Headquarters: Greensboro, North Carolina, USA.
- Business: Manufactures synthetic and recycled performance fibers and yarns; portfolio includes its flagship brand REPREVE®, a branded recycled performance fiber/resin solution.
History and Background
- Founded in 1971 by George Allen Mebane IV (among others) as a textile company focused on polyester/nylon yarns.
- Over time the company expanded manufacturing capabilities and embraced advanced textile technologies, especially in the 1980s and 1990s.
- In 2007 the REPREVE® platform was launched: a major strategic pivot toward recycling of post consumer bottles and industrial waste into performance fibers.
Key Developments and Strategic Initiatives
- REPREVE scaling: The company has transformed tens of billions of plastic bottles into recycled fiber. For example, in 2020 Unifi announced passing the milestone of 20 billion bottles.
- Profitability Improvement Plan: In January 2024 the company announced a cost reset initiative expected to reduce annual operating expenses by US$10–15 million, plus sales transformation targets.
- Manufacturing footprint adjustment: In May 2025 Unifi announced the sale of a manufacturing facility in Madison, North Carolina, for US$45 million, using the proceeds to reduce debt and expecting annualized savings in operations of ~US$20 million.
Mergers & Acquisitions
- While publicly available major acquisitions by Unifi are less evident in the sources I found, the sale of the facility (above) is a significant asset transaction.
- It should be noted that the textile & fiber industry often sees smaller strategic acquisitions, joint ventures or licensing deals further detailed M&A may require deeper due diligence or filings.
Partnerships & Collaborations
- Unifi collaborates extensively with global brands, textile mills and other partners. For example, the REPREVE Champions of Sustainability awards programme recognizes brand, textile and retail partners that use REPREVE fibers.
- The company’s sustainability platform emphasizes traceable, verified supply chains; fiber technologies; and partnerships across apparel, footwear, home goods, automotive and other industries.
Product Launches / Innovations
- The REPREVE brand offers fibers and resins made from post consumer plastic bottles, ocean bound plastic, and textile waste; product formats include filament yarn, spun yarn, staple fiber and resin.
- REPREVE includes traceability technologies such as FiberPrint® (a tracer embedded in fibers) and U TRUST® certification to provide transparency in recycled content.
- Innovations around performance finishes: Unifi mentions proprietary “PROFIBER™” technology offering added comfort, performance (moisture management, thermal regulation, UV protection, antimicrobial, water resistance).
Key Technology Focus Areas
- Recycled feedstock sourcing: Collecting and processing post consumer bottles, ocean bound plastic, post industrial/consumer textile waste.
- Fiber manufacturing & performance yarns: Engineered yarns that offer both sustainability and performance characteristics for apparel, footwear, home furnishings, automotive, etc.
- Circulary systems / traceability: Embedding tracers in fibers (FiberPrint®), certification (U TRUST®), closed loop recycling of manufacturing waste (yarn/tex waste).
R&D Organisation & Investment
- While specific R&D spend is not detailed in the sources I found, Unifi emphasizes that its history is “marked by investments in technology” and “innovation in performance technologies” (see their history section).
- The company’s innovation focus (performance yarns + circular feedstocks) implies ongoing R&D efforts in fiber engineering, recycling processes, traceability systems and manufacturing optimization.
SWOT Analysis
Strengths
- Strong brand in recycled performance fiber: REPREVE is widely recognized across apparel, footwear, and home goods brands.
- Vertical manufacturing and global footprint: operations in U.S., Latin America, global sales distribution gives scale and flexibility.
- Sustainability credentials and traceability technologies: align well with growing ESG demand from brands/consumers.
- Innovation in recycled feedstocks and performance yarns offers value beyond “just recycled content” (performance features).
- Strategic cost and operational restructuring underway: facility sales and cost reduction programmes may improve margins.
Weaknesses
- Business sensitive to raw material costs, feedstock availability, pricing pressures (virgin vs recycled differential).
- Recent financial performance shows pressure: e.g., Q4 2025 revenue decline, gross margin erosion.
- Dependence on a few large brand customers may create concentration risk. (Though this is typical in the industry).
- The sustainability premium may be challenged if recycled content becomes commoditized; need to maintain differentiation.
Opportunities
- Growth in circular textile solutions: scaling textile to textile recycling opens a large new feedstock/market.
- Increasing brand and regulatory pressures for recycled content and traceability: tailwinds for Unifi’s business model.
- New markets & end uses beyond apparel (industrial, automotive, home furnishings) for recycled performance fibers.
- Geographic expansion: increased presence in Asia, Europe, Latin America offers growth avenues.
Threats
- Macroeconomic/commodity headwinds: soft demand in apparel/textiles, foreignâ€exchange risks (international operations).
- Competition: other fiber/resin producers, chemical companies, recycled feedstock solutions may erode margins.
- Technology risks: recycling technologies, feedstock sourcing, traceability standards evolve quickly company must keep pace.
- Operational risks: manufacturing disruptions, supplyâ€chain bottlenecks, raw material feedstock quality issues.
- Sustainability claims risk: If traceability/verification systems fail, may incur reputational damage.
Recent News & Strategic Updates
- Profitability improvement plan (Jan 2024): As noted earlier, cost reset, headcount reductions, leadership promotions, streamlining operations.
- Sale of manufacturing facility (May 2025): Disposal of facility for $45 million, using net proceeds to reduce debt (~$43.3 million principal reduction) and expecting ~$20 million in annualised operational savings.
Top Vendors in the U.S. Recycled Polyester Market & Their Offerings:
- Indorama Ventures Public Company Ltd. (U.S. operations): As part of a worldwide chemical company, its U.S. operations are involved in the manufacture of polyethylene terephthalate (PET) resins and the recycling of PET bottles.
- Far Eastern New Century (FENC America): This diversified Taiwanese conglomerate, including FENC America, produces polyester materials, textiles, and PET bottles, and specializes in polyester recycling.
- DAK Americas LLC (Alpek Polyester): As a subsidiary of Alpek, DAK Americas is a leading producer of PET resins, polyester staple fibers, and terephthalic acid (TPA) in the Americas, with a focus on recycled materials.
- Biffa Polymers (U.S. division)
- Nan Ya Plastics Corporation America
- Phoenix Technologies International, LLC
- Placon Corporation
- CarbonLite Industries (now merged into DAK Americas)
- Loop Industries
- Evergreen Plastics, Inc.
- Mohawk Industries, Inc.
- Avangard Innovative
- PolyQuest, Inc.
- Custom Polymers PET, LLC
- Clean Tech Incorporated (Plastipak Packaging)
- Perpetual Recycling Solutions, LLC
- Peninsula Plastics Recycling, Inc.
- Nextek, Inc.
- Repreve Renewables LLC
Segments Covered in the Report
By Product Type
- Fiber Grade rPET
- Bottle Grade rPET
- Sheet & Film Grade rPET
- Strapping Grade rPET
By the Recycling Process
- Mechanical Recycling
- Chemical Recycling (Depolymerization, Glycolysis, Methanolysis)
By Application
- Textiles & Apparel (Clothing, Footwear, Upholstery)
- Packaging (Bottles, Containers, Films)
- Automotive (Interiors, Carpets, Insulation)
- Construction (Insulation, Panels, Roofing Membranes)
- Industrial (Straps, Hoses, Geotextiles)
- Others (Consumer Goods, Home Furnishings)
By Form
- Flakes
- Pellets (rPET Resin)
- Fibers & Filaments
A Seven-Phase Framework
Our methodology is designed to be universally applicable across commodity chemicals, specialty chemicals, petrochemicals, construction chemicals, coatings, electronic chemicals, industrial gases, agrochemicals, water treatment chemicals, and performance materials. Each phase builds upon the last, creating a layered validation structure that minimizes estimation error and maximizes analytical confidence.
The framework ensures comprehensive market coverage, robust cross-validation, and reliable long-term forecasting — producing market estimates that withstand scrutiny from investors, regulators, and corporate strategy teams.

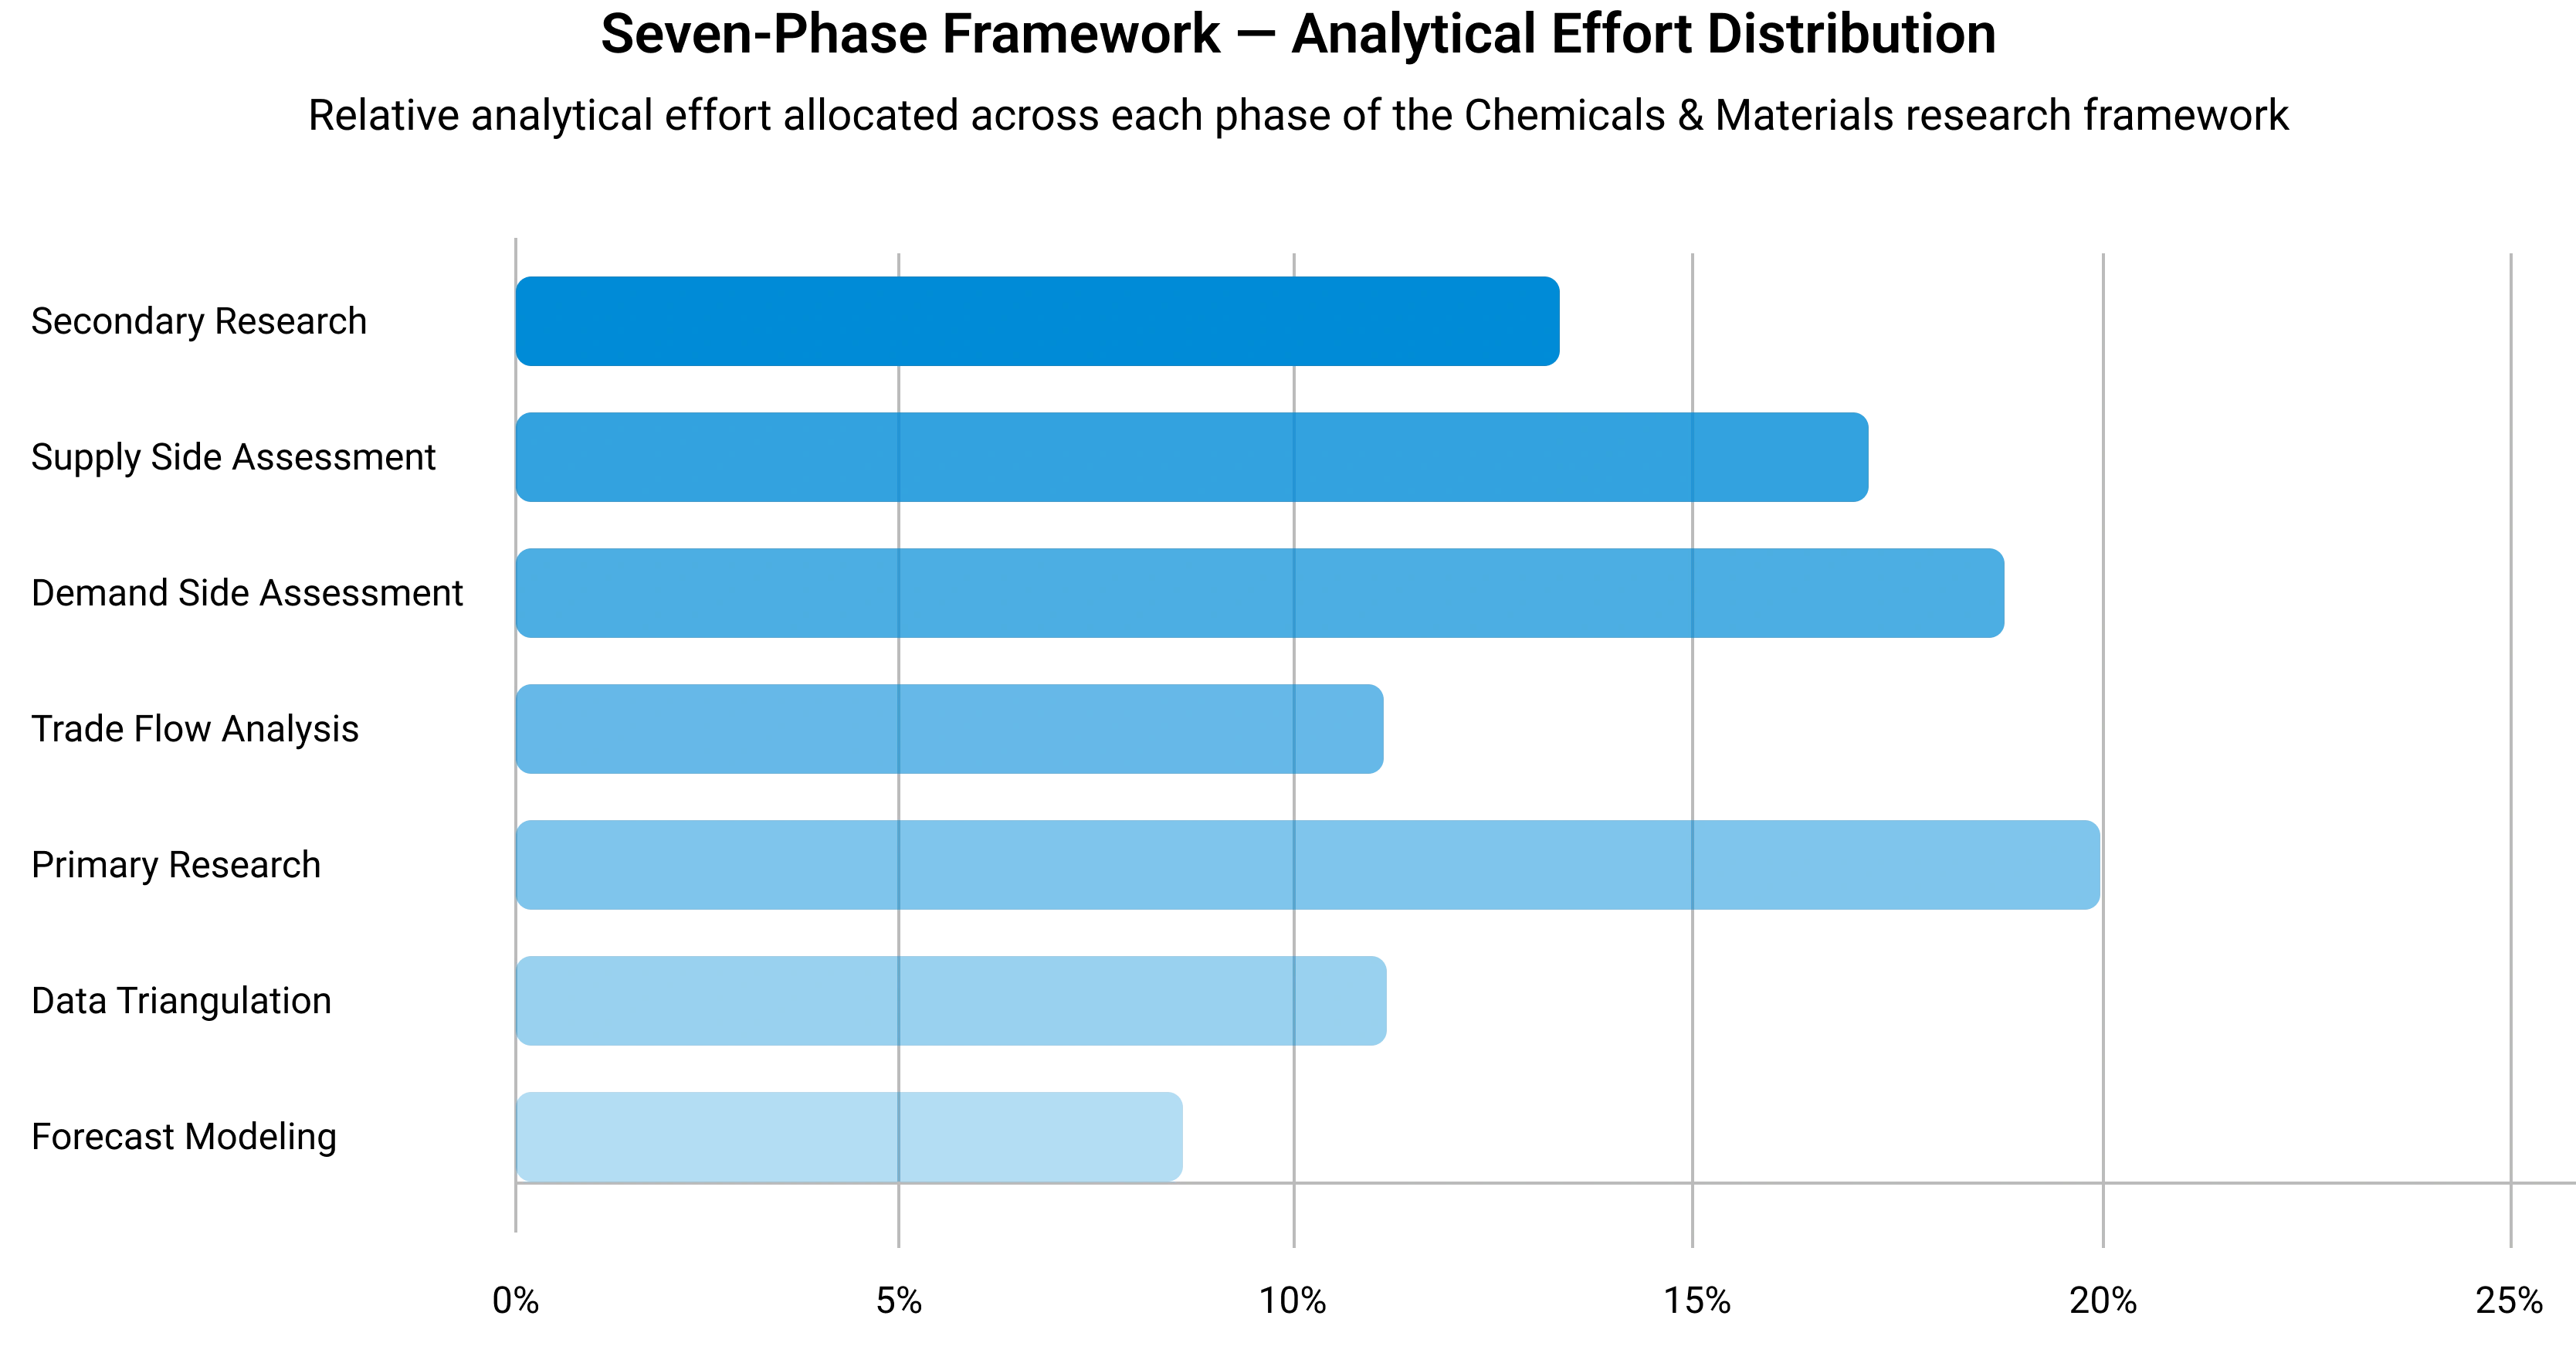
Seven-Phase Framework — Analytical Effort Distribution
Relative analytical effort allocated across each phase of the Chemicals & Materials research framework
Phase 1 - Secondary Research: Establishing the Foundation
Secondary research collects and evaluates publicly available information from authoritative sources, establishing the foundational understanding of market structure, value chain dynamics, competitive landscape, and end-use demand patterns. Every source is evaluated for credibility, recency, geographic relevance, and methodological soundness before inclusion.
Industry Associations
Sources include ACC, CEFIC, ICCA, JCIA, CPCIF, and SOCMA providing production volumes, consumption trends, capacity developments, and sustainability initiatives.
Company Disclosures
Annual reports, investor presentations, earnings transcripts, and regulatory filings reveal product portfolios, manufacturing footprints, capacity expansions, and revenue segmentation.
Government Databases
National statistical offices, customs authorities, environmental agencies, and industrial production databases provide verified statistics on output, trade flows, and regulatory compliance.
Trade Databases
UN Comtrade, ITC, Eurostat, and national customs authorities enable assessment of global product movement, import dependency, and export competitiveness across regions.
Our Secondary Research Sources
- Ministry of Chemicals and Fertilizers
- European Chemicals Agency
- United States Department of Energy
- Ministry of Industry and Information Technology
- Ministry of Economy Trade and Industry
- Ministry of Trade Industry and Energy
- National Institute of Standards and Technology
- Council of Scientific and Industrial Research
- Fraunhofer Society
- National Institute for Materials Science
Phase 2 — Supply-Side Assessment: Mapping Production Capabilities
Production Capacity Analysis
All major manufacturers are assessed for existing installed capacity, planned additions, expansions, new plant announcements, and technology adoption — mapped at global, regional, and country levels.
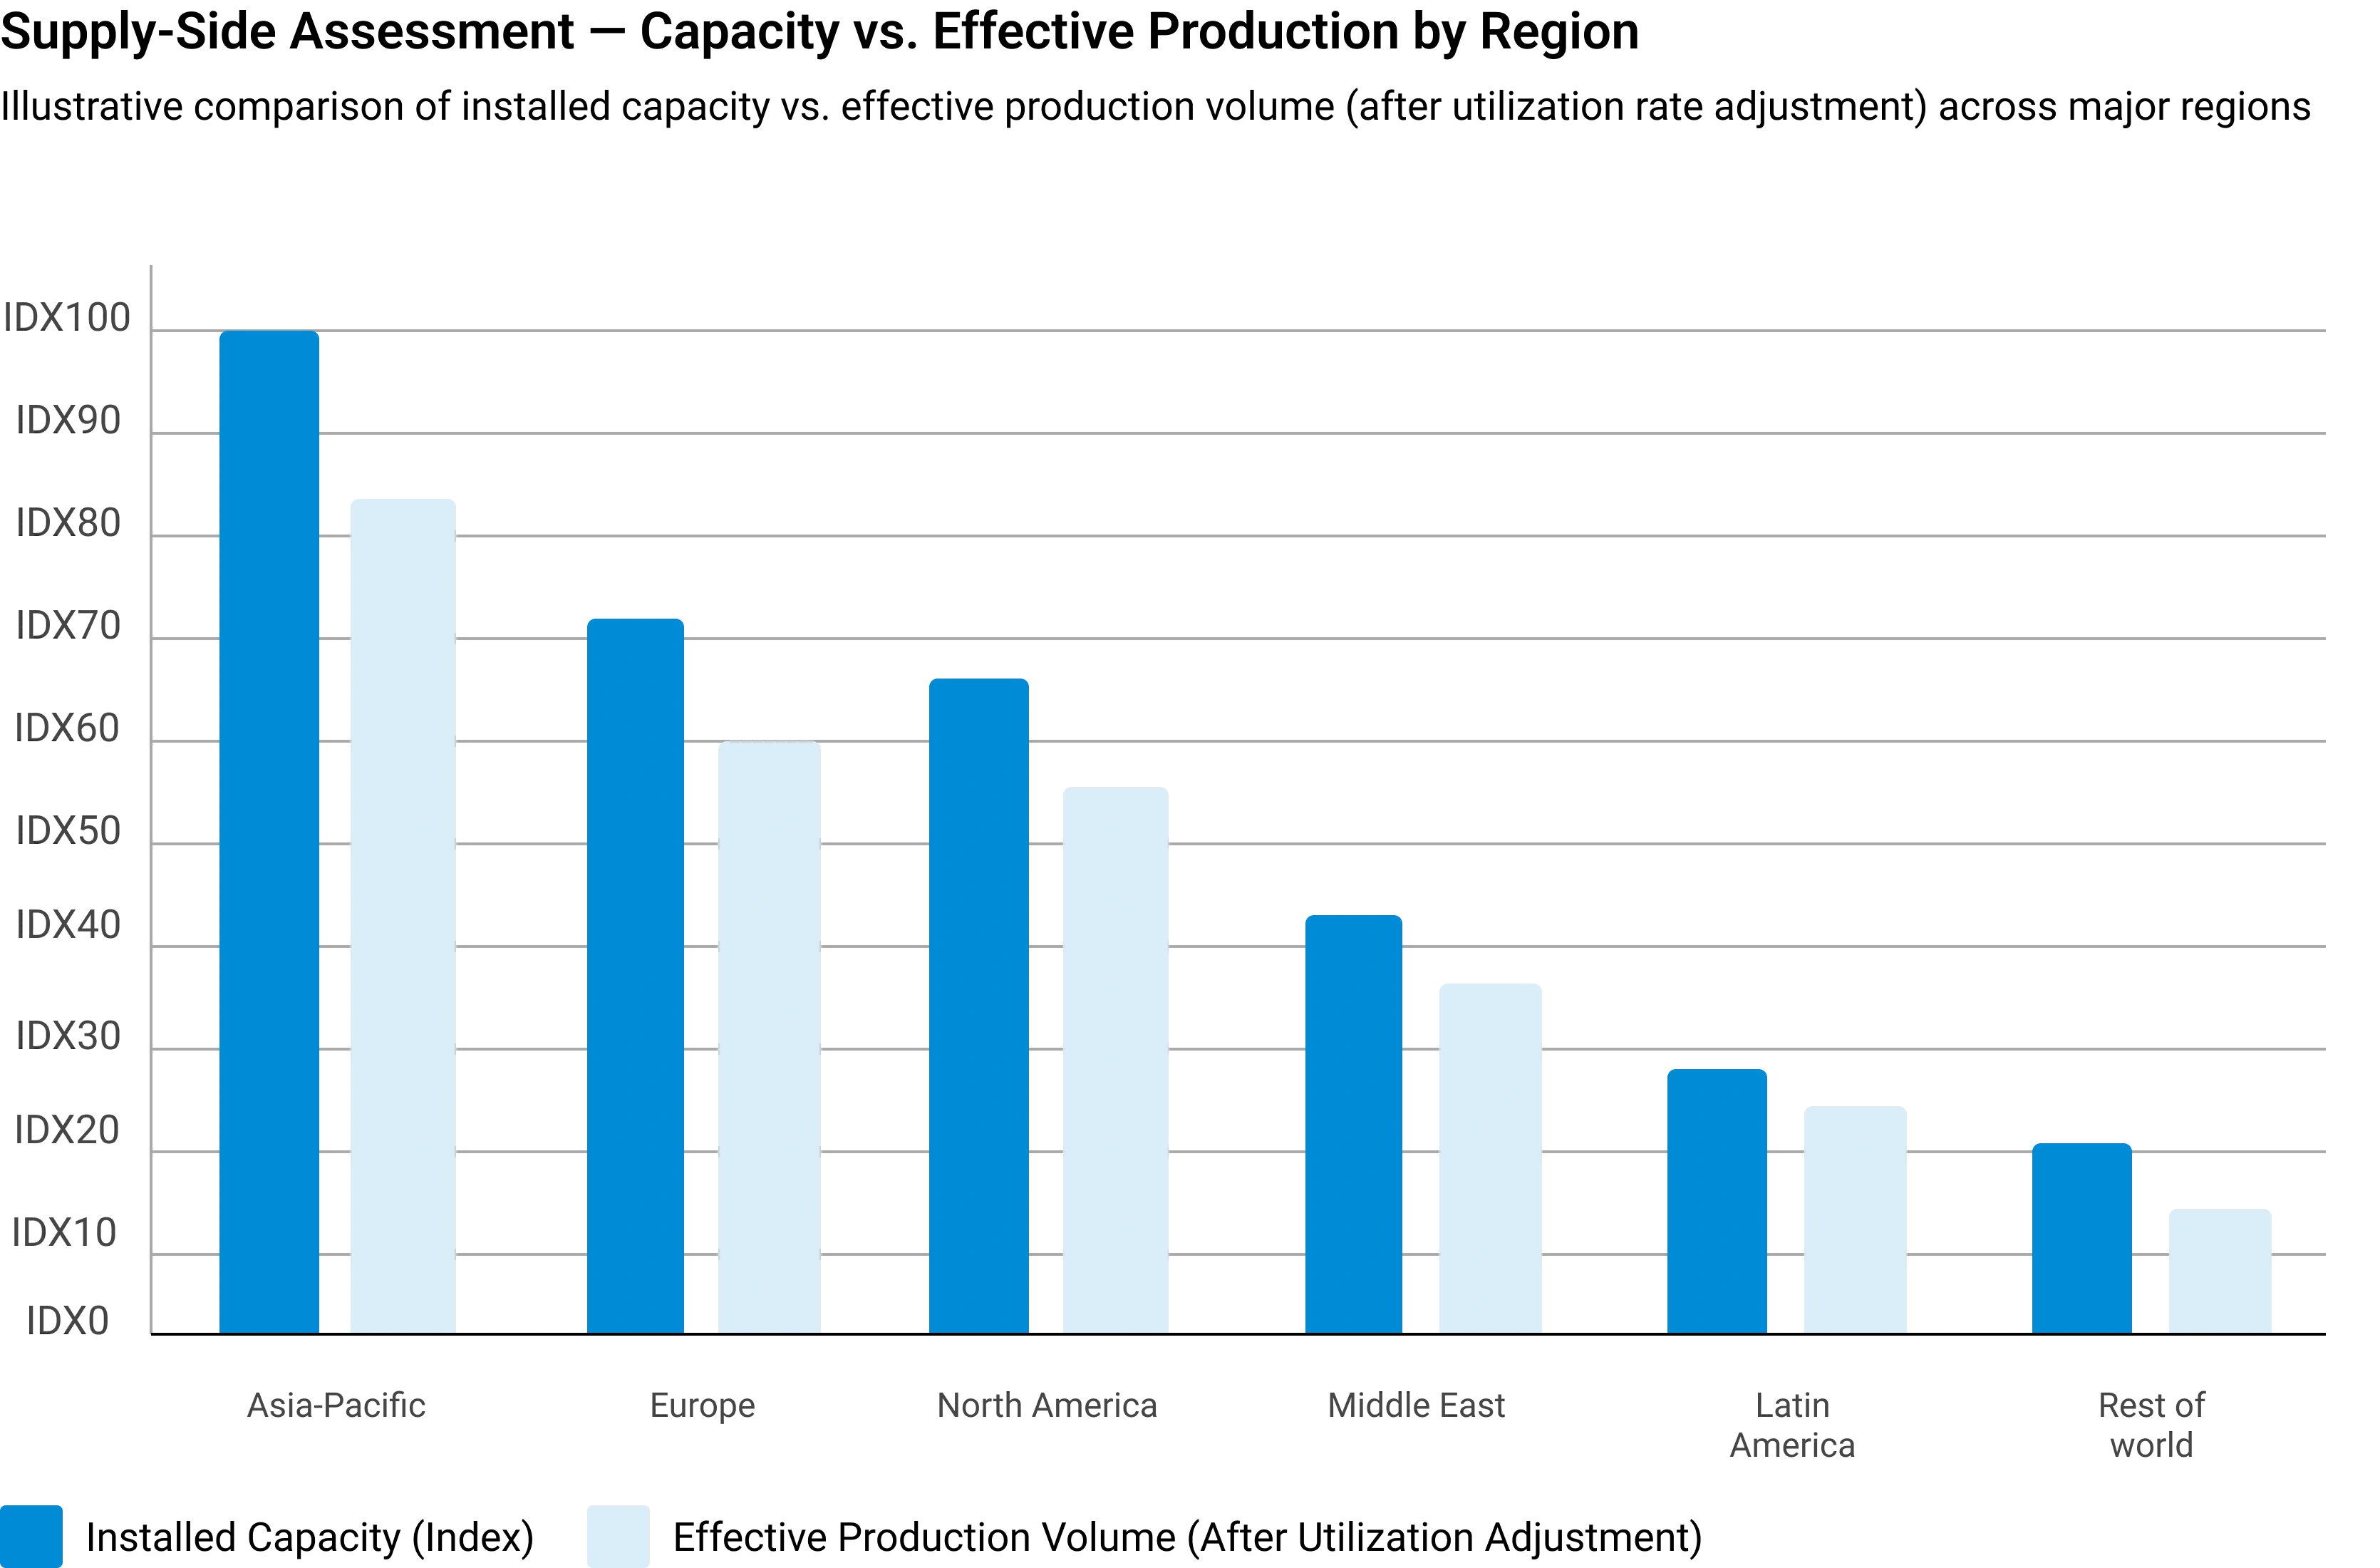
Capacity Utilization Adjustment
Installed capacity is adjusted using utilization rates based on demand conditions, feedstock availability, plant operating rates, maintenance schedules, and regulatory restrictions.
Manufacturer Revenue Analysis
Product-specific revenues, segment-level performance, regional distribution, average selling prices, and margin trends are evaluated to establish market value estimates.
Supply-Side Assessment — Capacity vs. Effective Production by Region
Illustrative comparison of installed capacity vs. effective production volume (after utilization rate adjustment) across major regions
Phase 3 — Demand-Side Assessment: Quantifying Chemical Consumption
Demand-side analysis quantifies chemical consumption across industries, applications, and geographies — identifying where and how chemicals are consumed throughout the value chain with precision.
End-Use Industry Analysis
Chemical demand is evaluated across automotive, construction, packaging, electronics, agriculture, healthcare, consumer goods, industrial manufacturing, energy and utilities, and water treatment. Industry output, production trends, and consumption intensity are analyzed to determine demand patterns.
Consumption Modeling
Demand is estimated using measurable indicators: kilograms per vehicle, kilograms per square meter of construction, dosage per cubic meter of water treated, kilograms per hectare of agricultural land, and kilograms per ton of manufactured products. Consumption factors are validated through industry publications and primary interviews.
Application Analysis
The market is segmented by application area to understand product performance requirements, formulation trends, technology adoption, customer preferences, and regulatory requirements improving demand accuracy and segmentation granularity.
Demand-Side Assessment — End-Use Industry Demand Distribution
Illustrative distribution of chemical & materials demand across key end-use industries
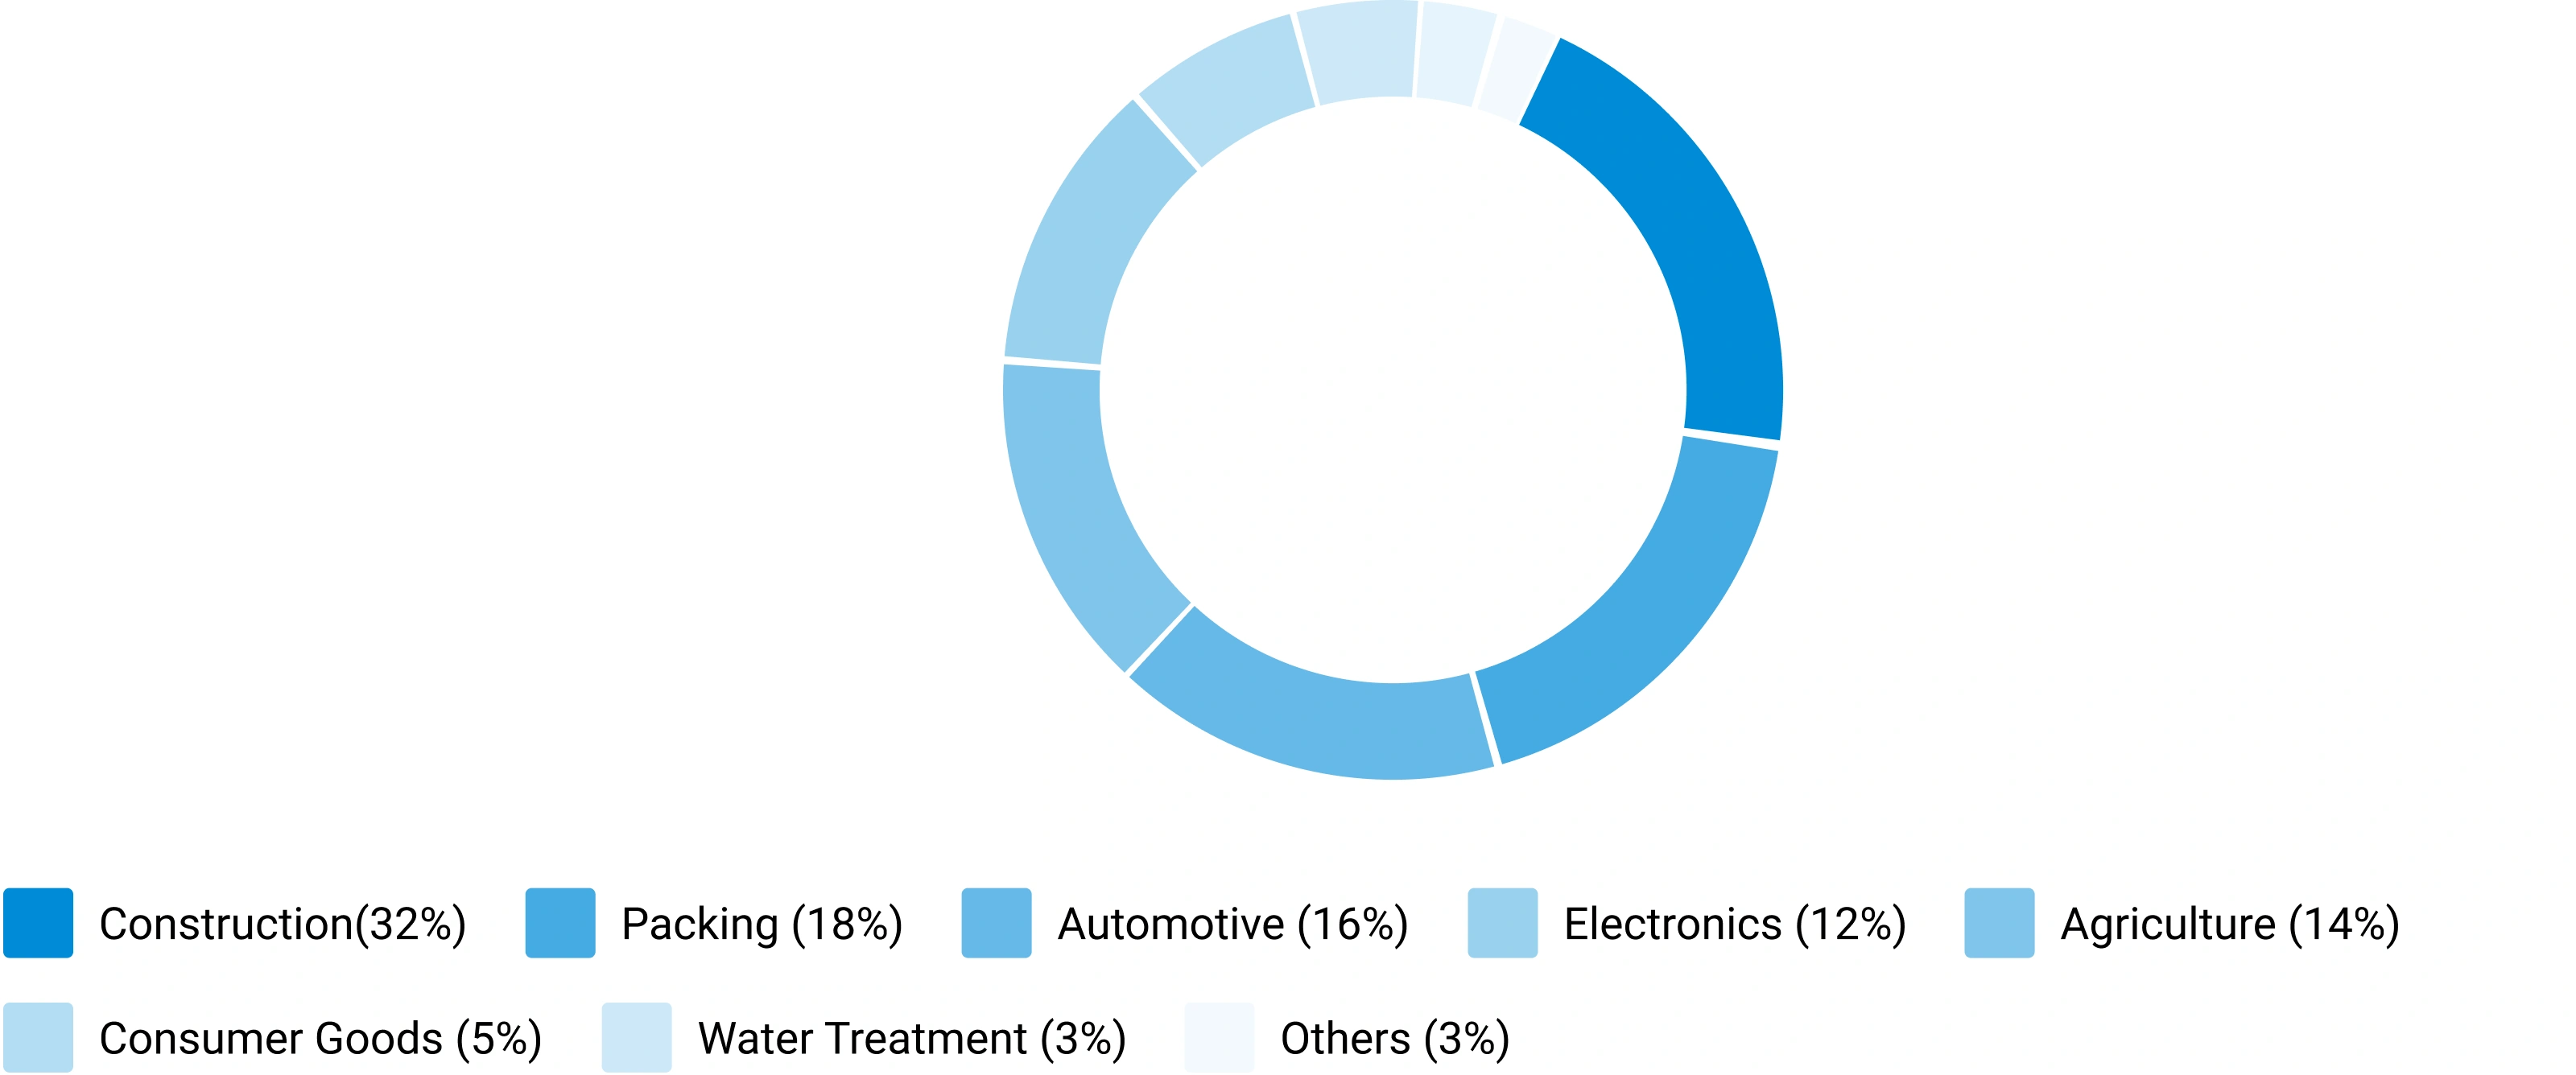
Phase 4 - Trade Flow Analysis: Balancing Regional Supply and Demand
Trade flow analysis reconciles regional supply and demand estimates through import and export data, identifying net supply positions, regional dependencies, and market imbalances. It serves as an independent validation layer that tests the consistency of supply-side and demand-side estimates.
Import Analysis
Import data is evaluated to determine volumes, source countries, product dependency, regional supply gaps, and pricing trends — identifying markets that rely heavily on external supply and where domestic production is insufficient to meet demand.
Export Analysis
Export assessments reveal production surplus, export competitiveness, regional manufacturing strength, and global market participation. Export patterns also help validate domestic production estimates and identify net exporting regions.
Apparent Consumption Model
Regional consumption is assessed using the standard apparent consumption formula:
Results identify net importing regions, net exporting regions, regional deficits, and surpluses — serving as an independent validation of supply and demand estimates.
Trade Flow Analysis — Net Supply Position by Region
Illustrative apparent consumption vs. domestic production across major regions — positive gap indicates net import dependency
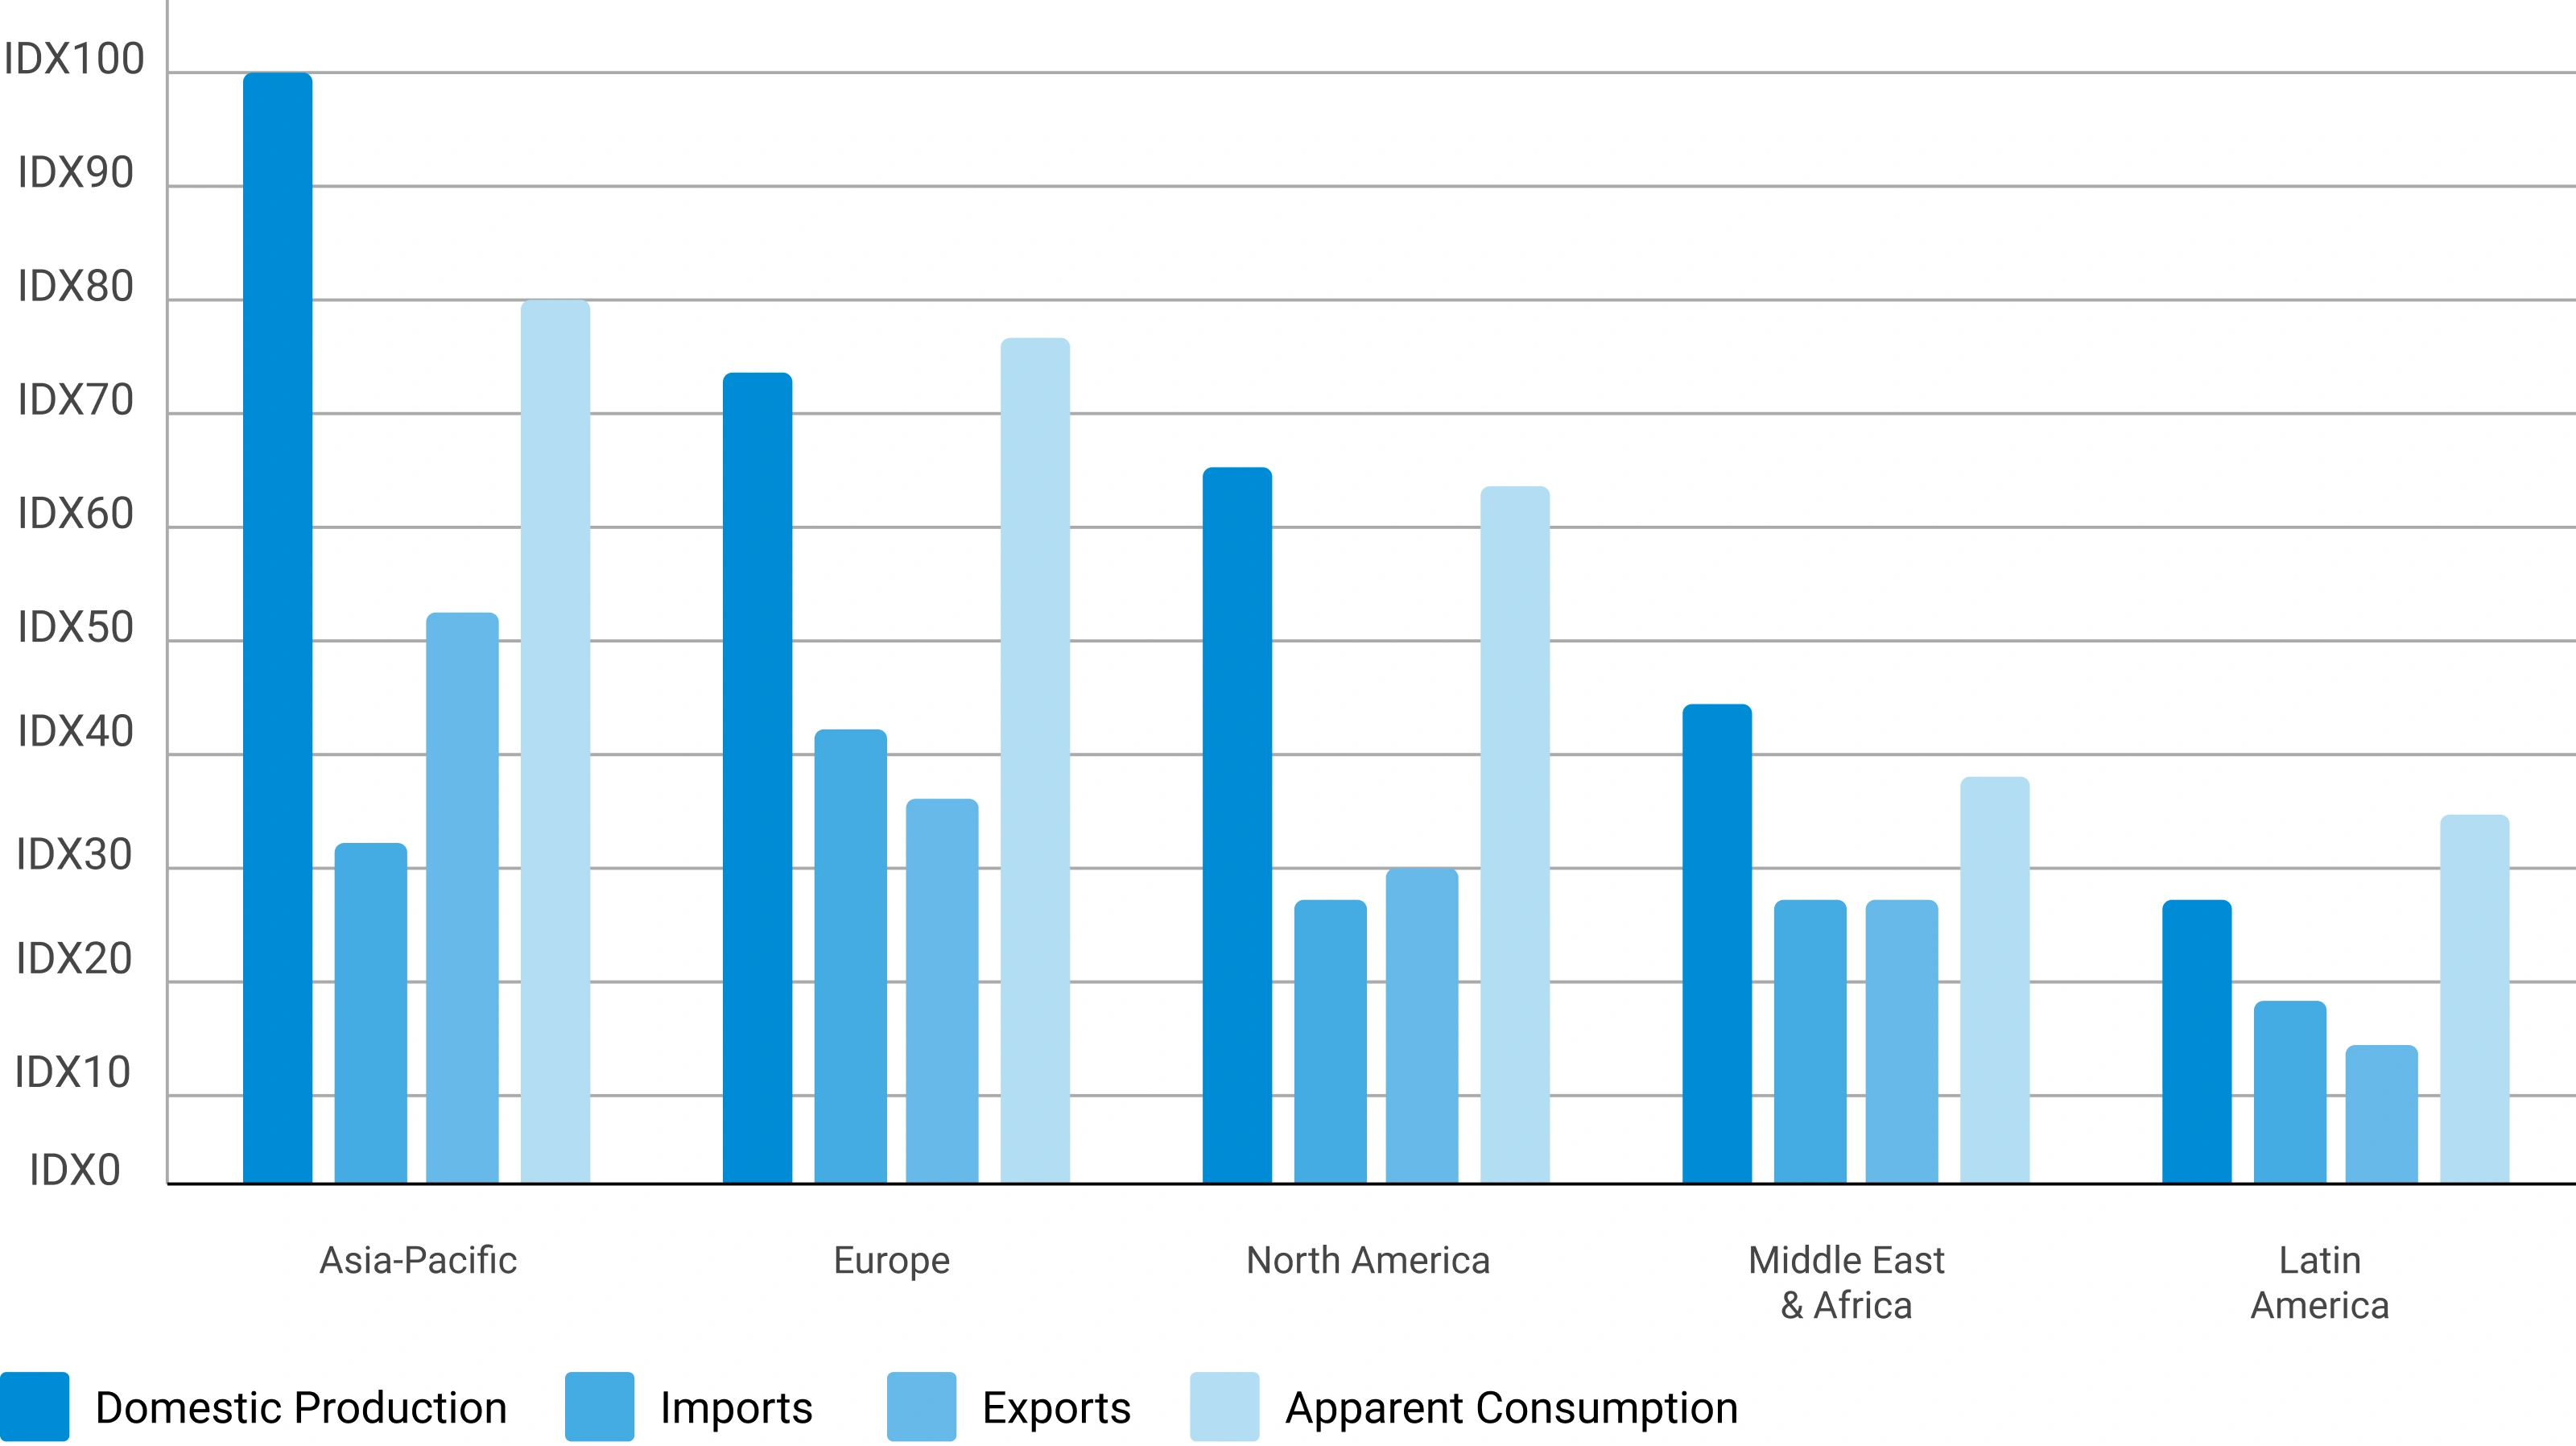
Phase 5 — Primary Research: The Critical Validation Layer
Primary research tests and refines findings from secondary research through direct engagement with industry participants across the supply chain, demand side, and expert community. It captures intelligence that no database or published report can provide — the real-world experience of manufacturers, buyers, and specialists operating in the market.

Supply-Side Interviews
Conversations with chemical manufacturers, raw material suppliers, contract manufacturers, technology providers, and plant operators cover production trends, capacity utilization, pricing developments, technology shifts, and competitive dynamics.

Demand-Side Interviews
Engagement with OEMs, industrial consumers, procurement managers, distributors, formulators, and end-use manufacturers focuses on consumption trends, purchasing behavior, product substitution, demand outlook, and emerging applications.

Industry Expert Consultations
Additional interviews with industry consultants, independent experts, regulatory specialists, technical professionals, and research institutions provide deeper market context and validate key analytical assumptions.
Focus Areas of Primary Research:
Market Size & Forecast Validation
Revenue estimates, volume consumption, growth rates, forecast assumptions, regional demand.Supply Chain & Value Chain Assessment
Raw material sourcing, supply chain challenges, distribution networks, procurement practices.Production & Capacity Analysis
Manufacturing capacity, utilization rates, expansion projects, plant investments.Pricing & Cost Structure Analysis
Product pricing trends, feedstock costs, energy costs, margin pressures, pricing outlook.Competitive Landscape Assessment
Volume and value estimates confirmed to be fully consistent with one another before publicationInterview Volume by Market Scope
| Study Scope | Number of Interviews |
|---|---|
| Niche Market | 20 – 30 |
| Mid-Sized Market | 30 – 50 |
| Global Market | 50 – 80 |
| Highly Fragmented Market | 80 – 120 |
Interview Details:
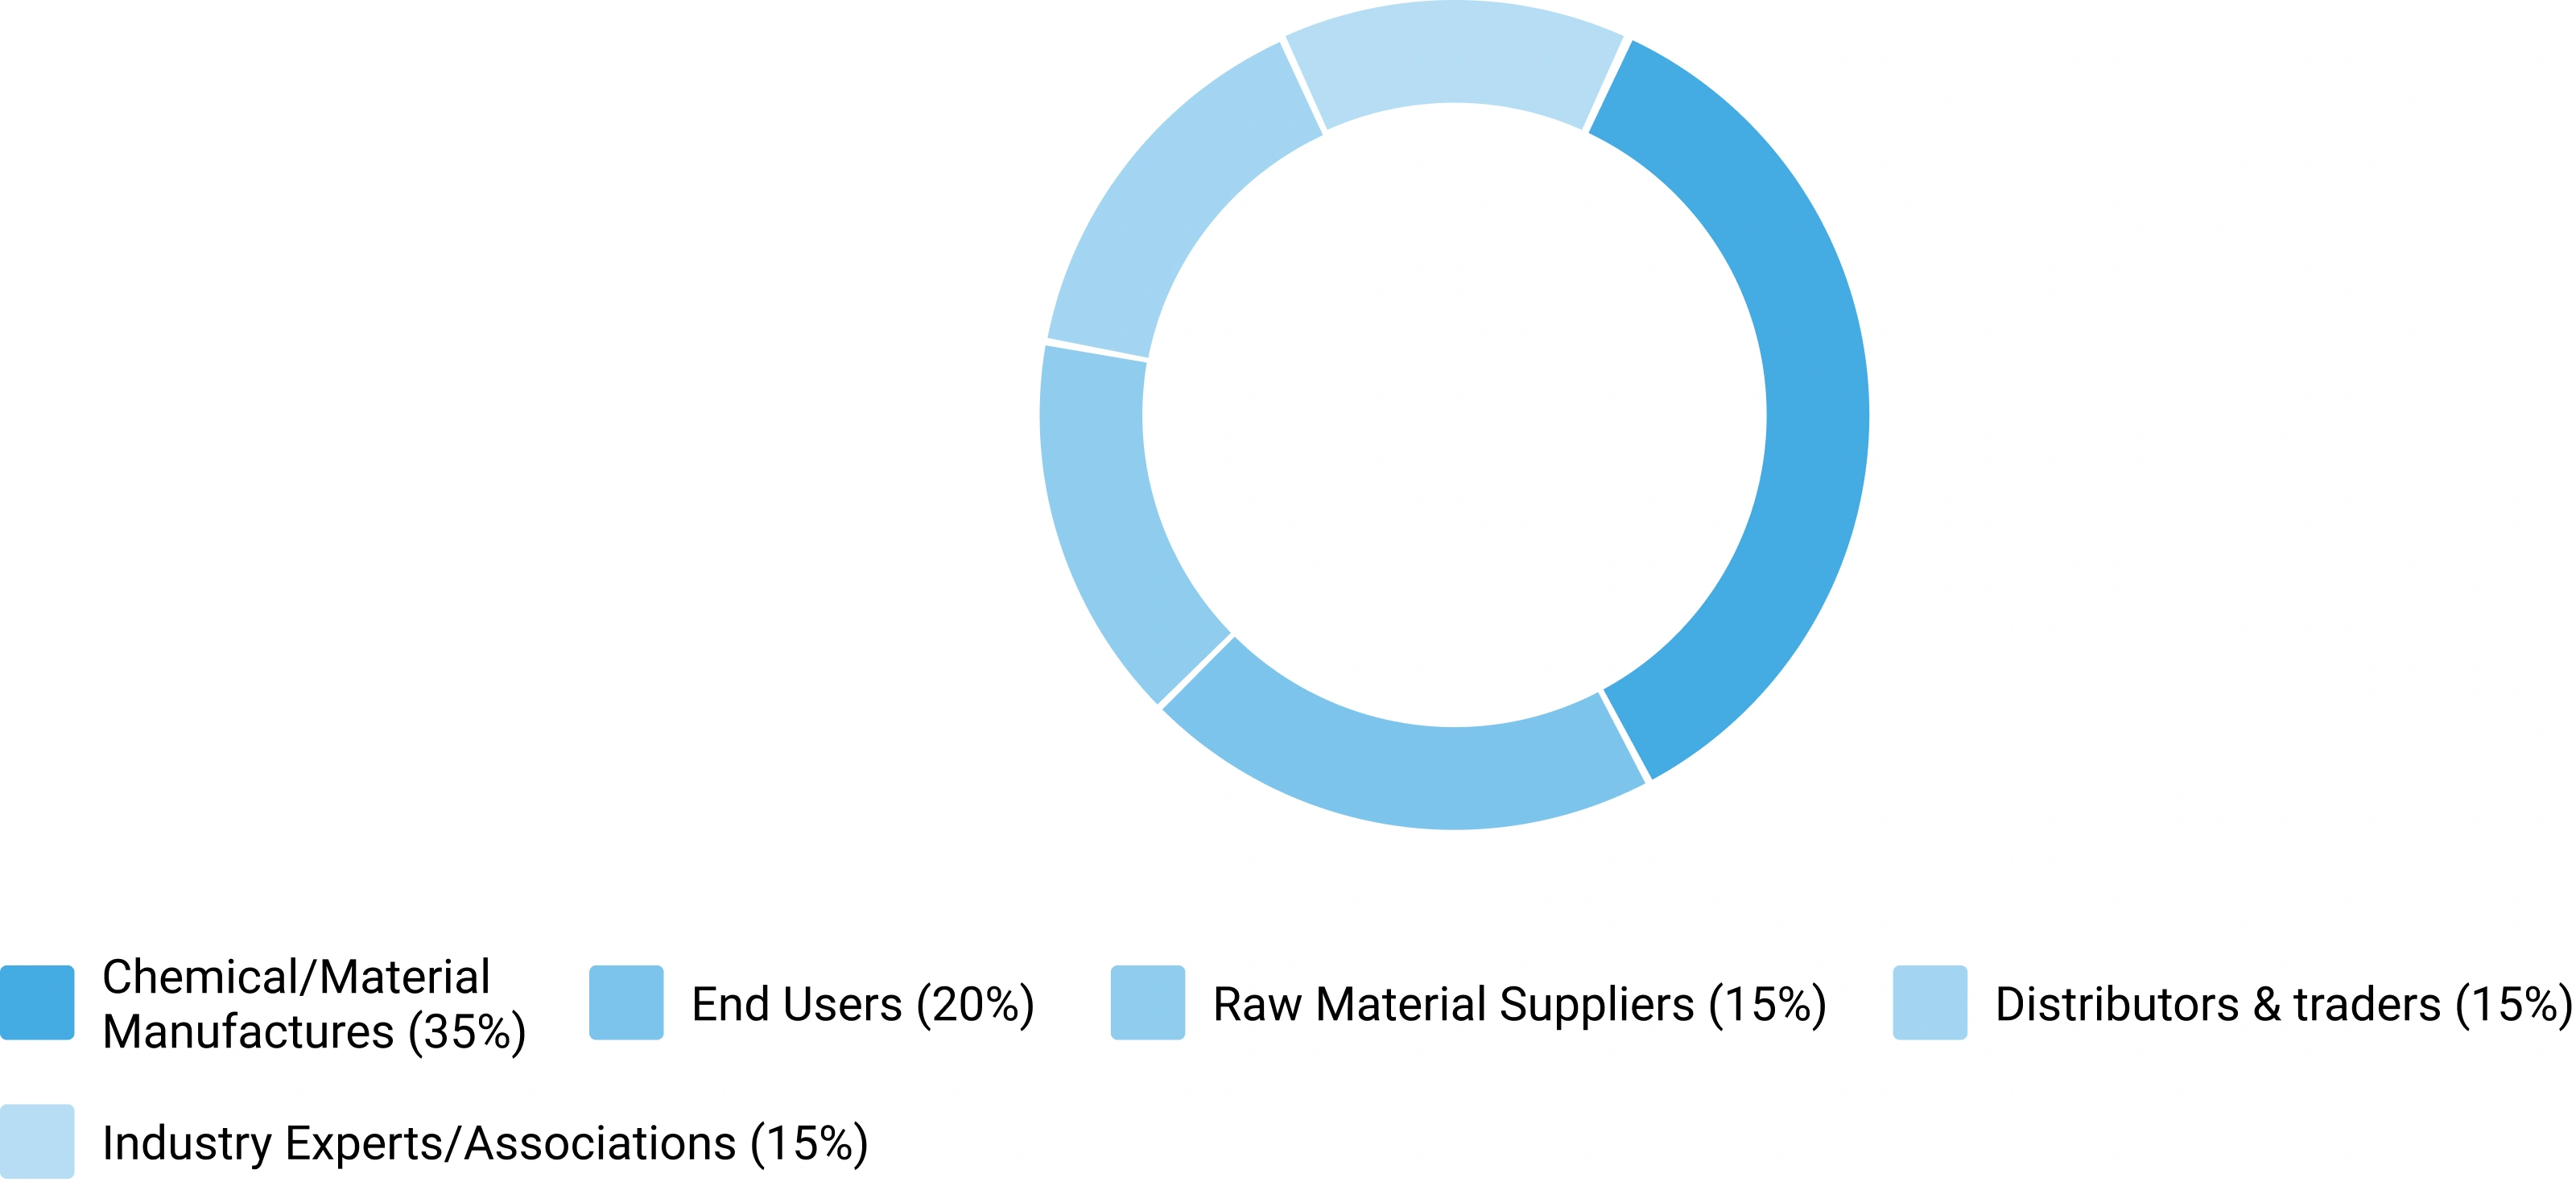
Category : Manufacturers, Suppliers, Distributors, End Users, Experts/Associations
Average Duration : 30–60 Minutes
Interview Mode : Video calls, telephonic interviews, expert consultations
Interview Format : Structured / Semi-Structured questionnaire
Focus Areas of Primary Research:
Market Size & Forecast Validation :
Revenue estimates, volume consumption, growth rates, forecast assumptions, regional demand.
Supply Chain & Value Chain Assessment :
Raw material sourcing, supply chain challenges, distribution networks, procurement practices.
Production & Capacity Analysis :
Manufacturing capacity, utilization rates, expansion projects, plant investments.
Pricing & Cost Structure Analysis :
Product pricing trends, feedstock costs, energy costs, margin pressures, pricing outlook.
Competitive Landscape Assessment :
Market share, competitor positioning, strategic initiatives, partnerships, acquisitions.
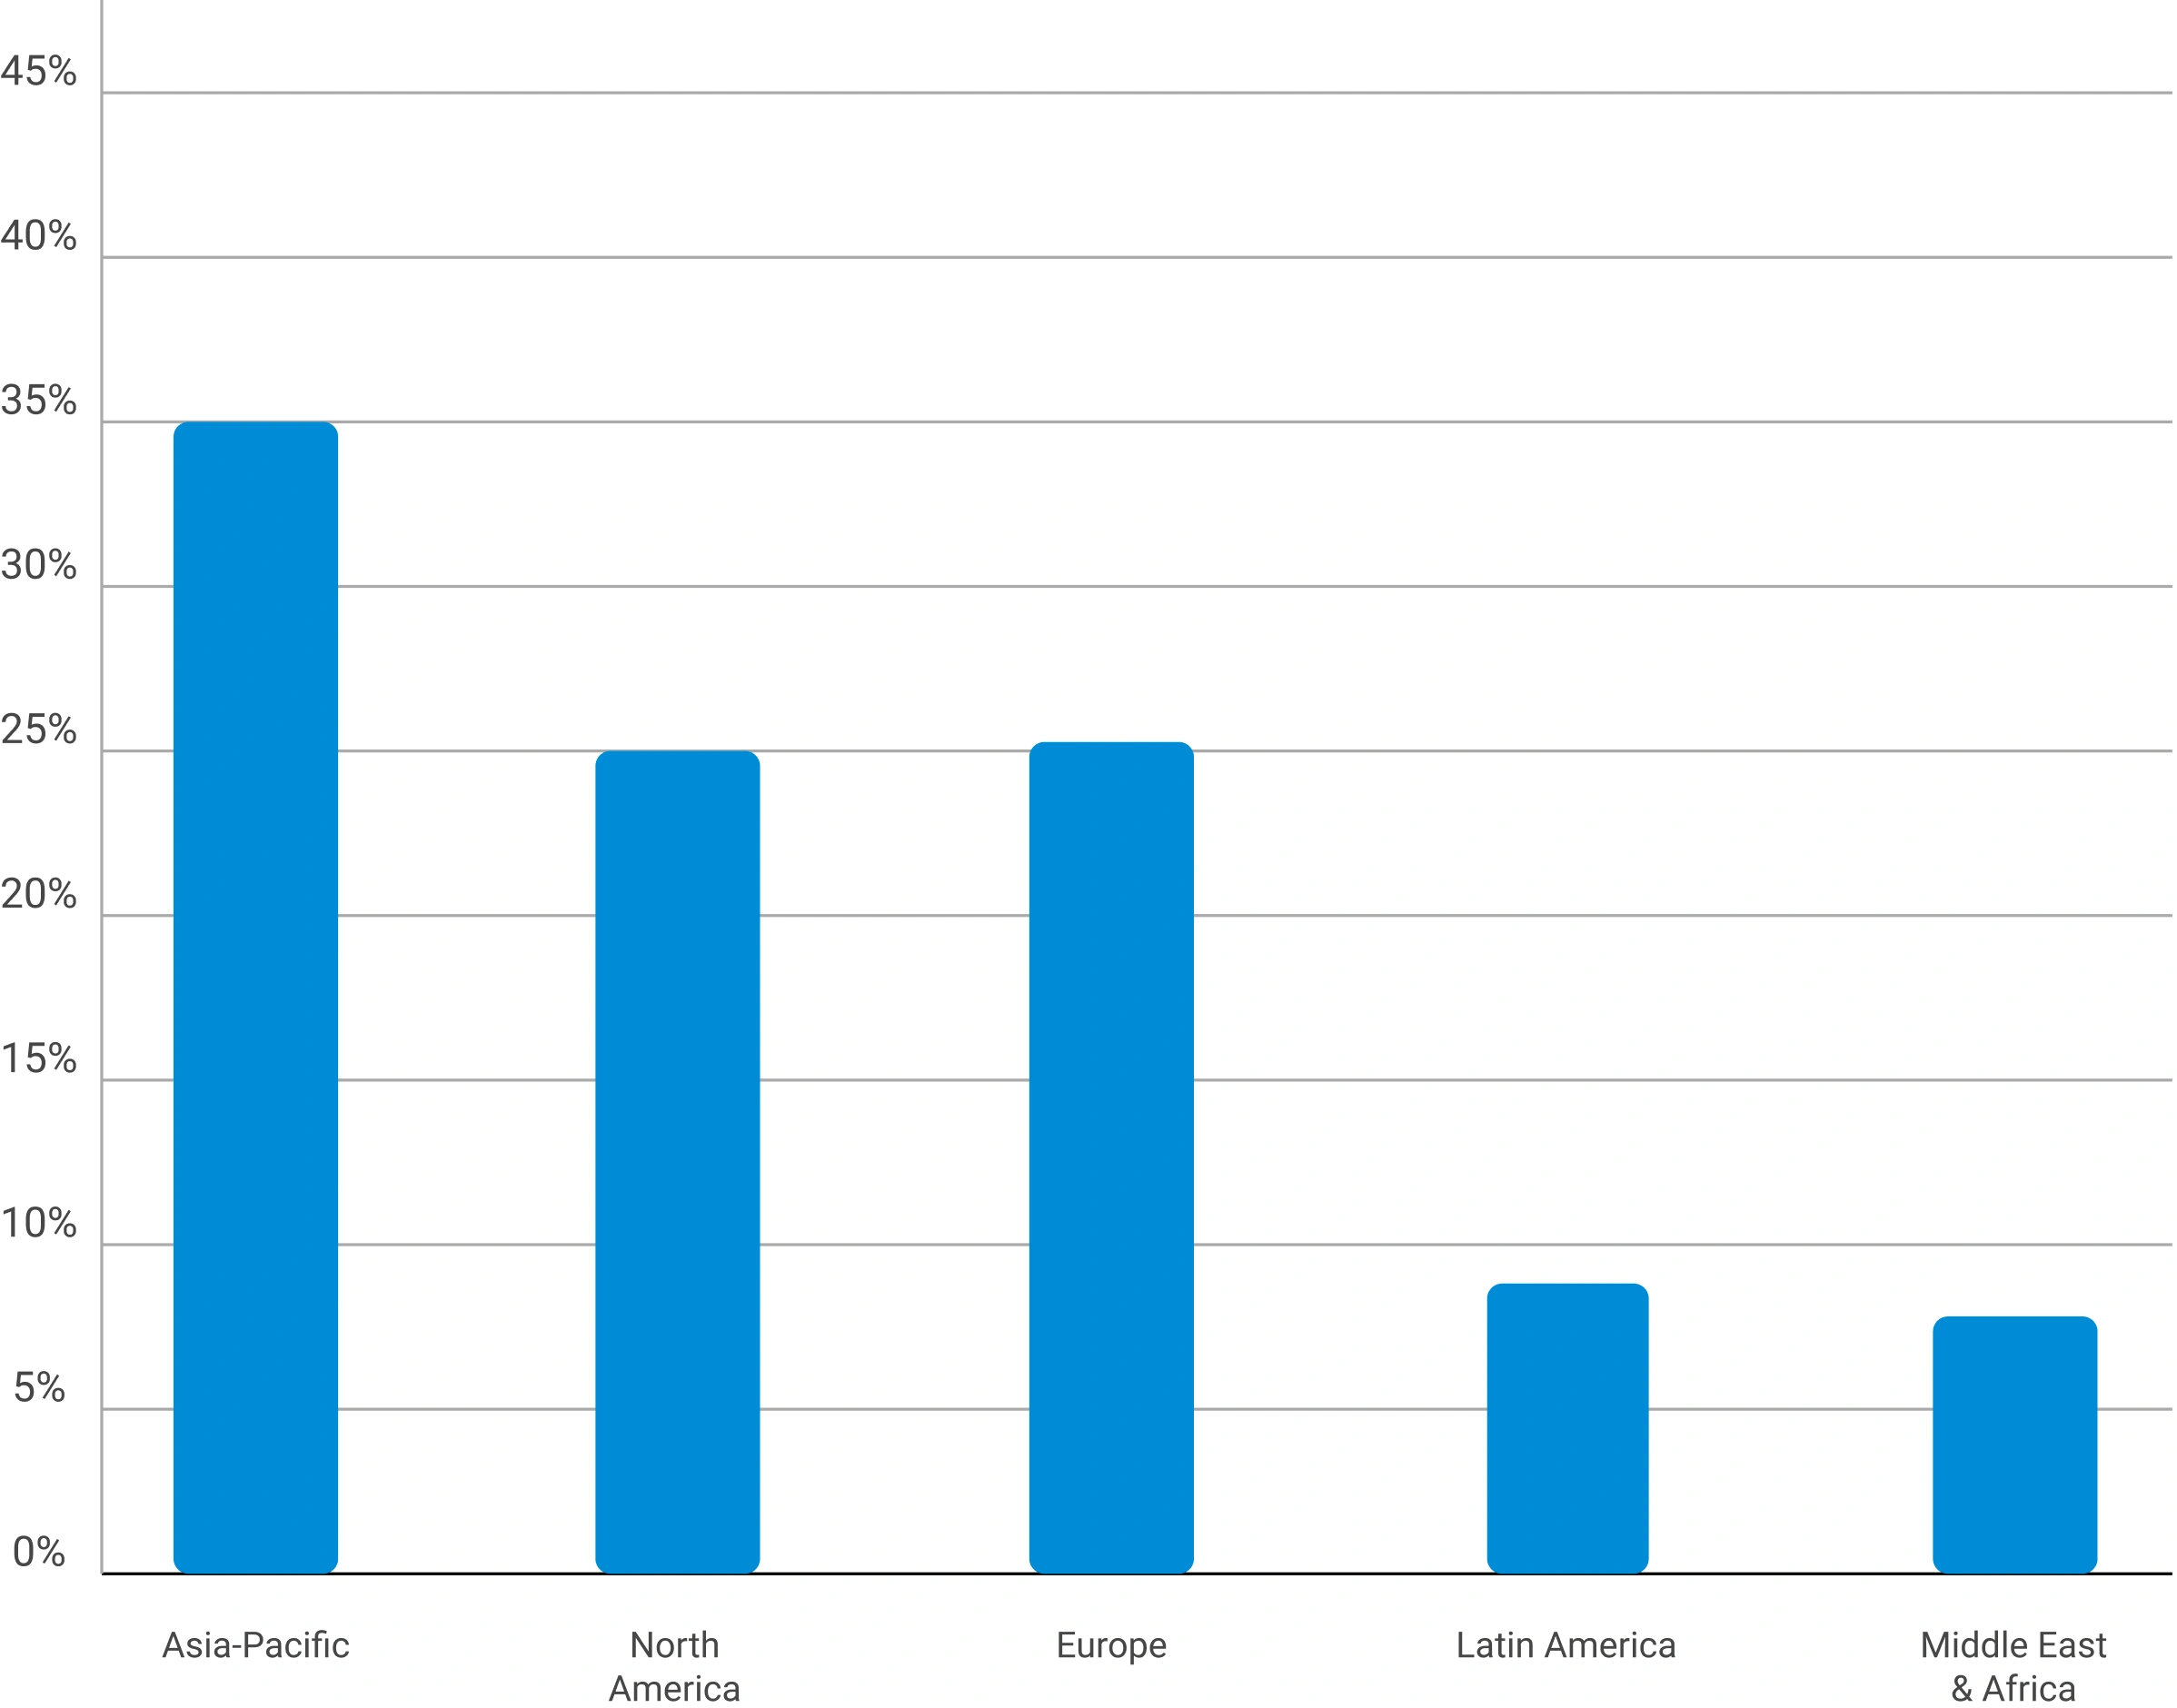
Primary Research — Stakeholder Coverage by Category
Distribution of interview respondents across stakeholder categories (% share from PPT data)
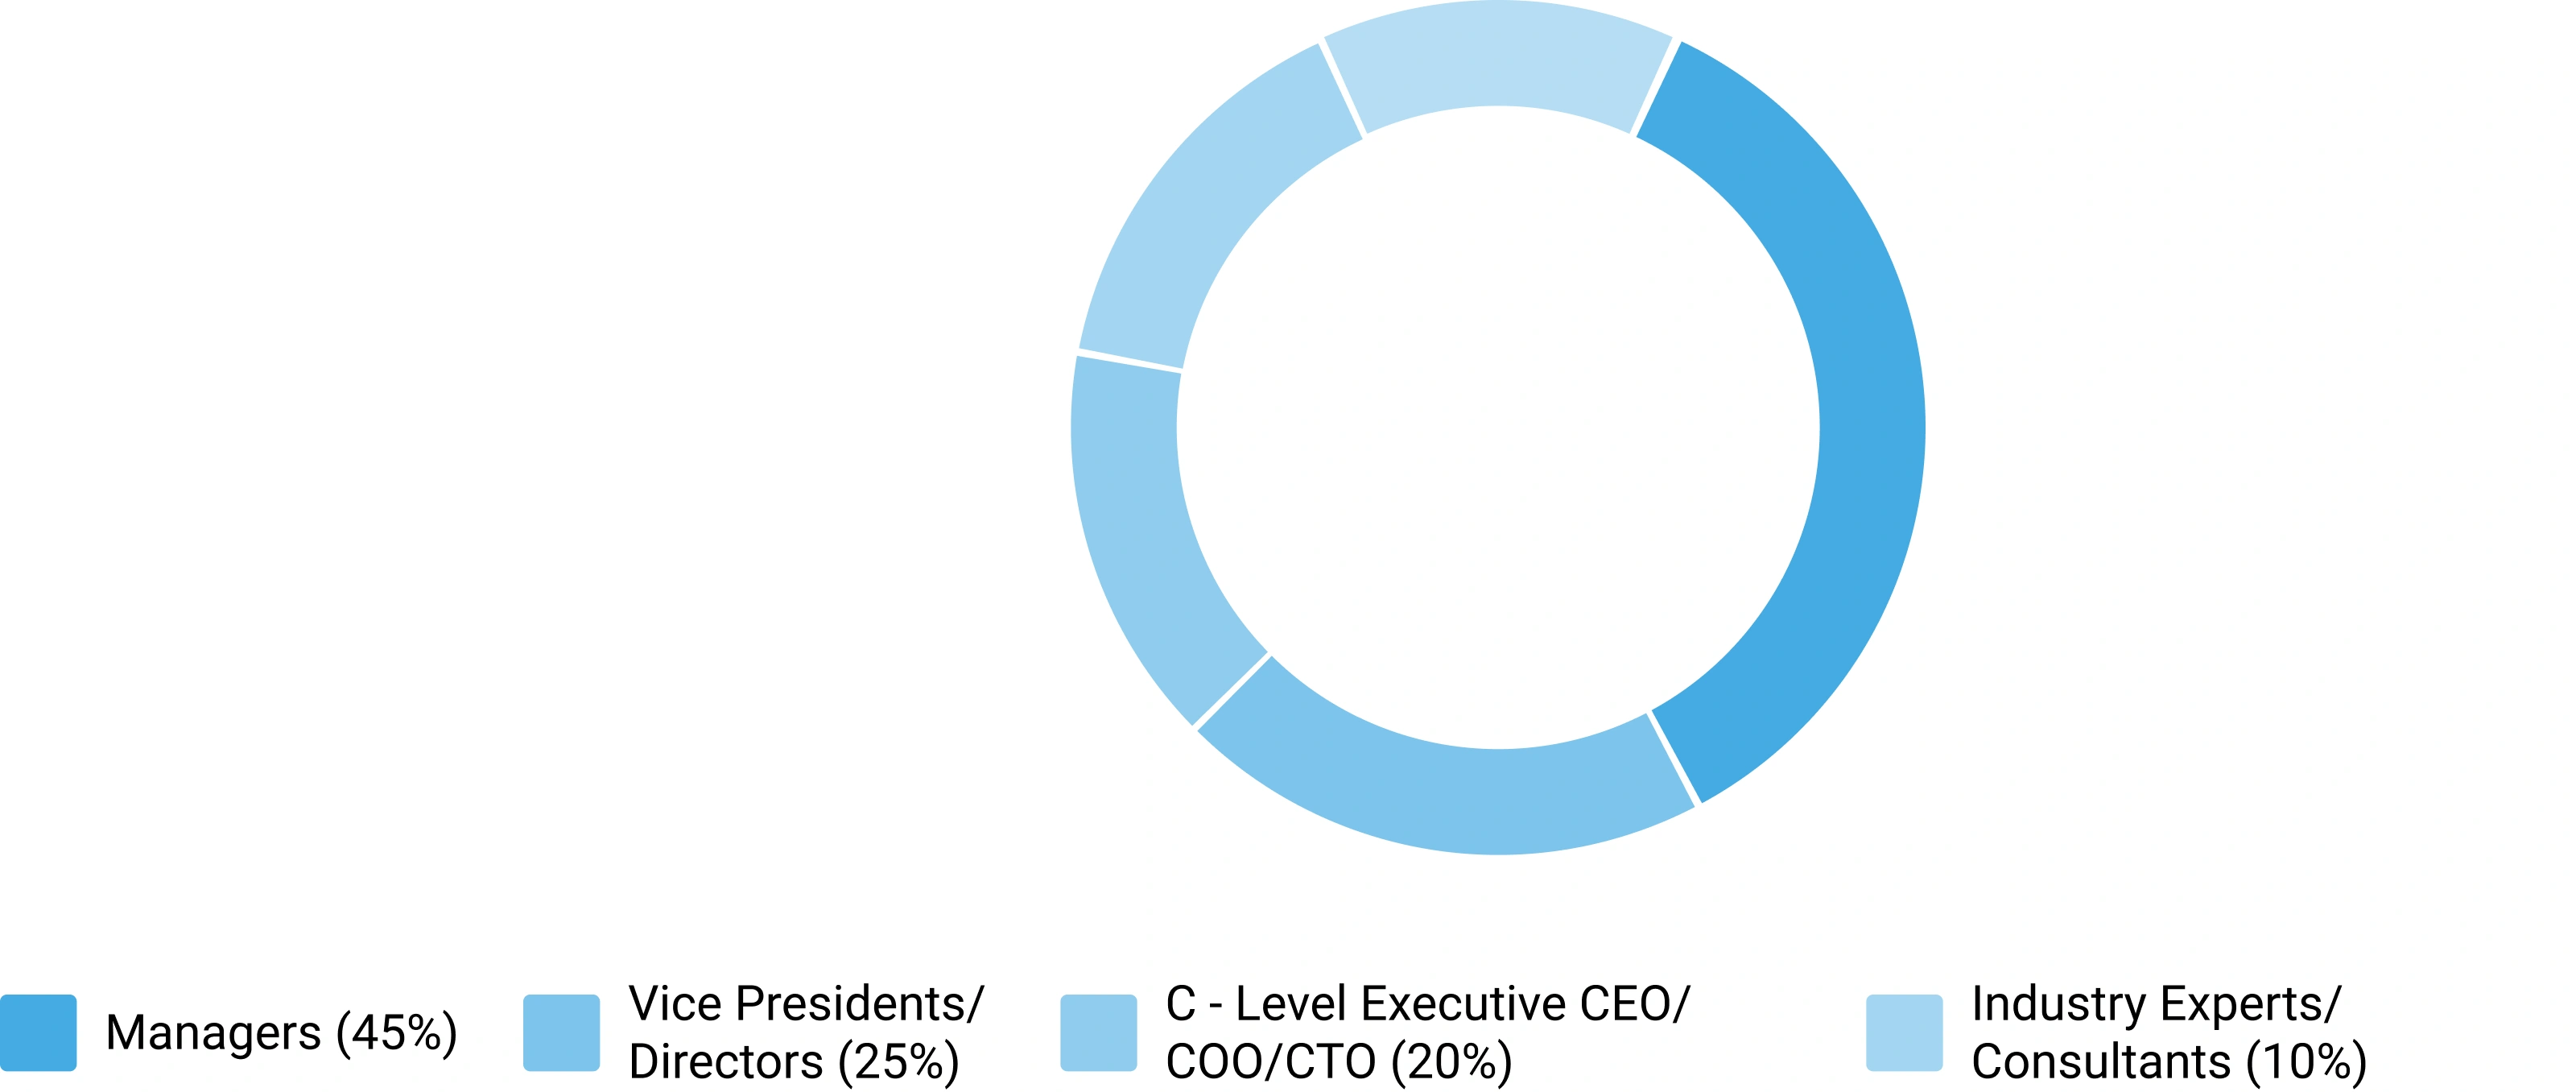
Primary Research — Respondent Designation Profile
Seniority breakdown of interview respondents (% share from PPT data)
Primary Research — Geographic Coverage of Interviews
Regional distribution of primary research engagement (% share from PPT data)
Phase 6 — Data Triangulation and Market Validation
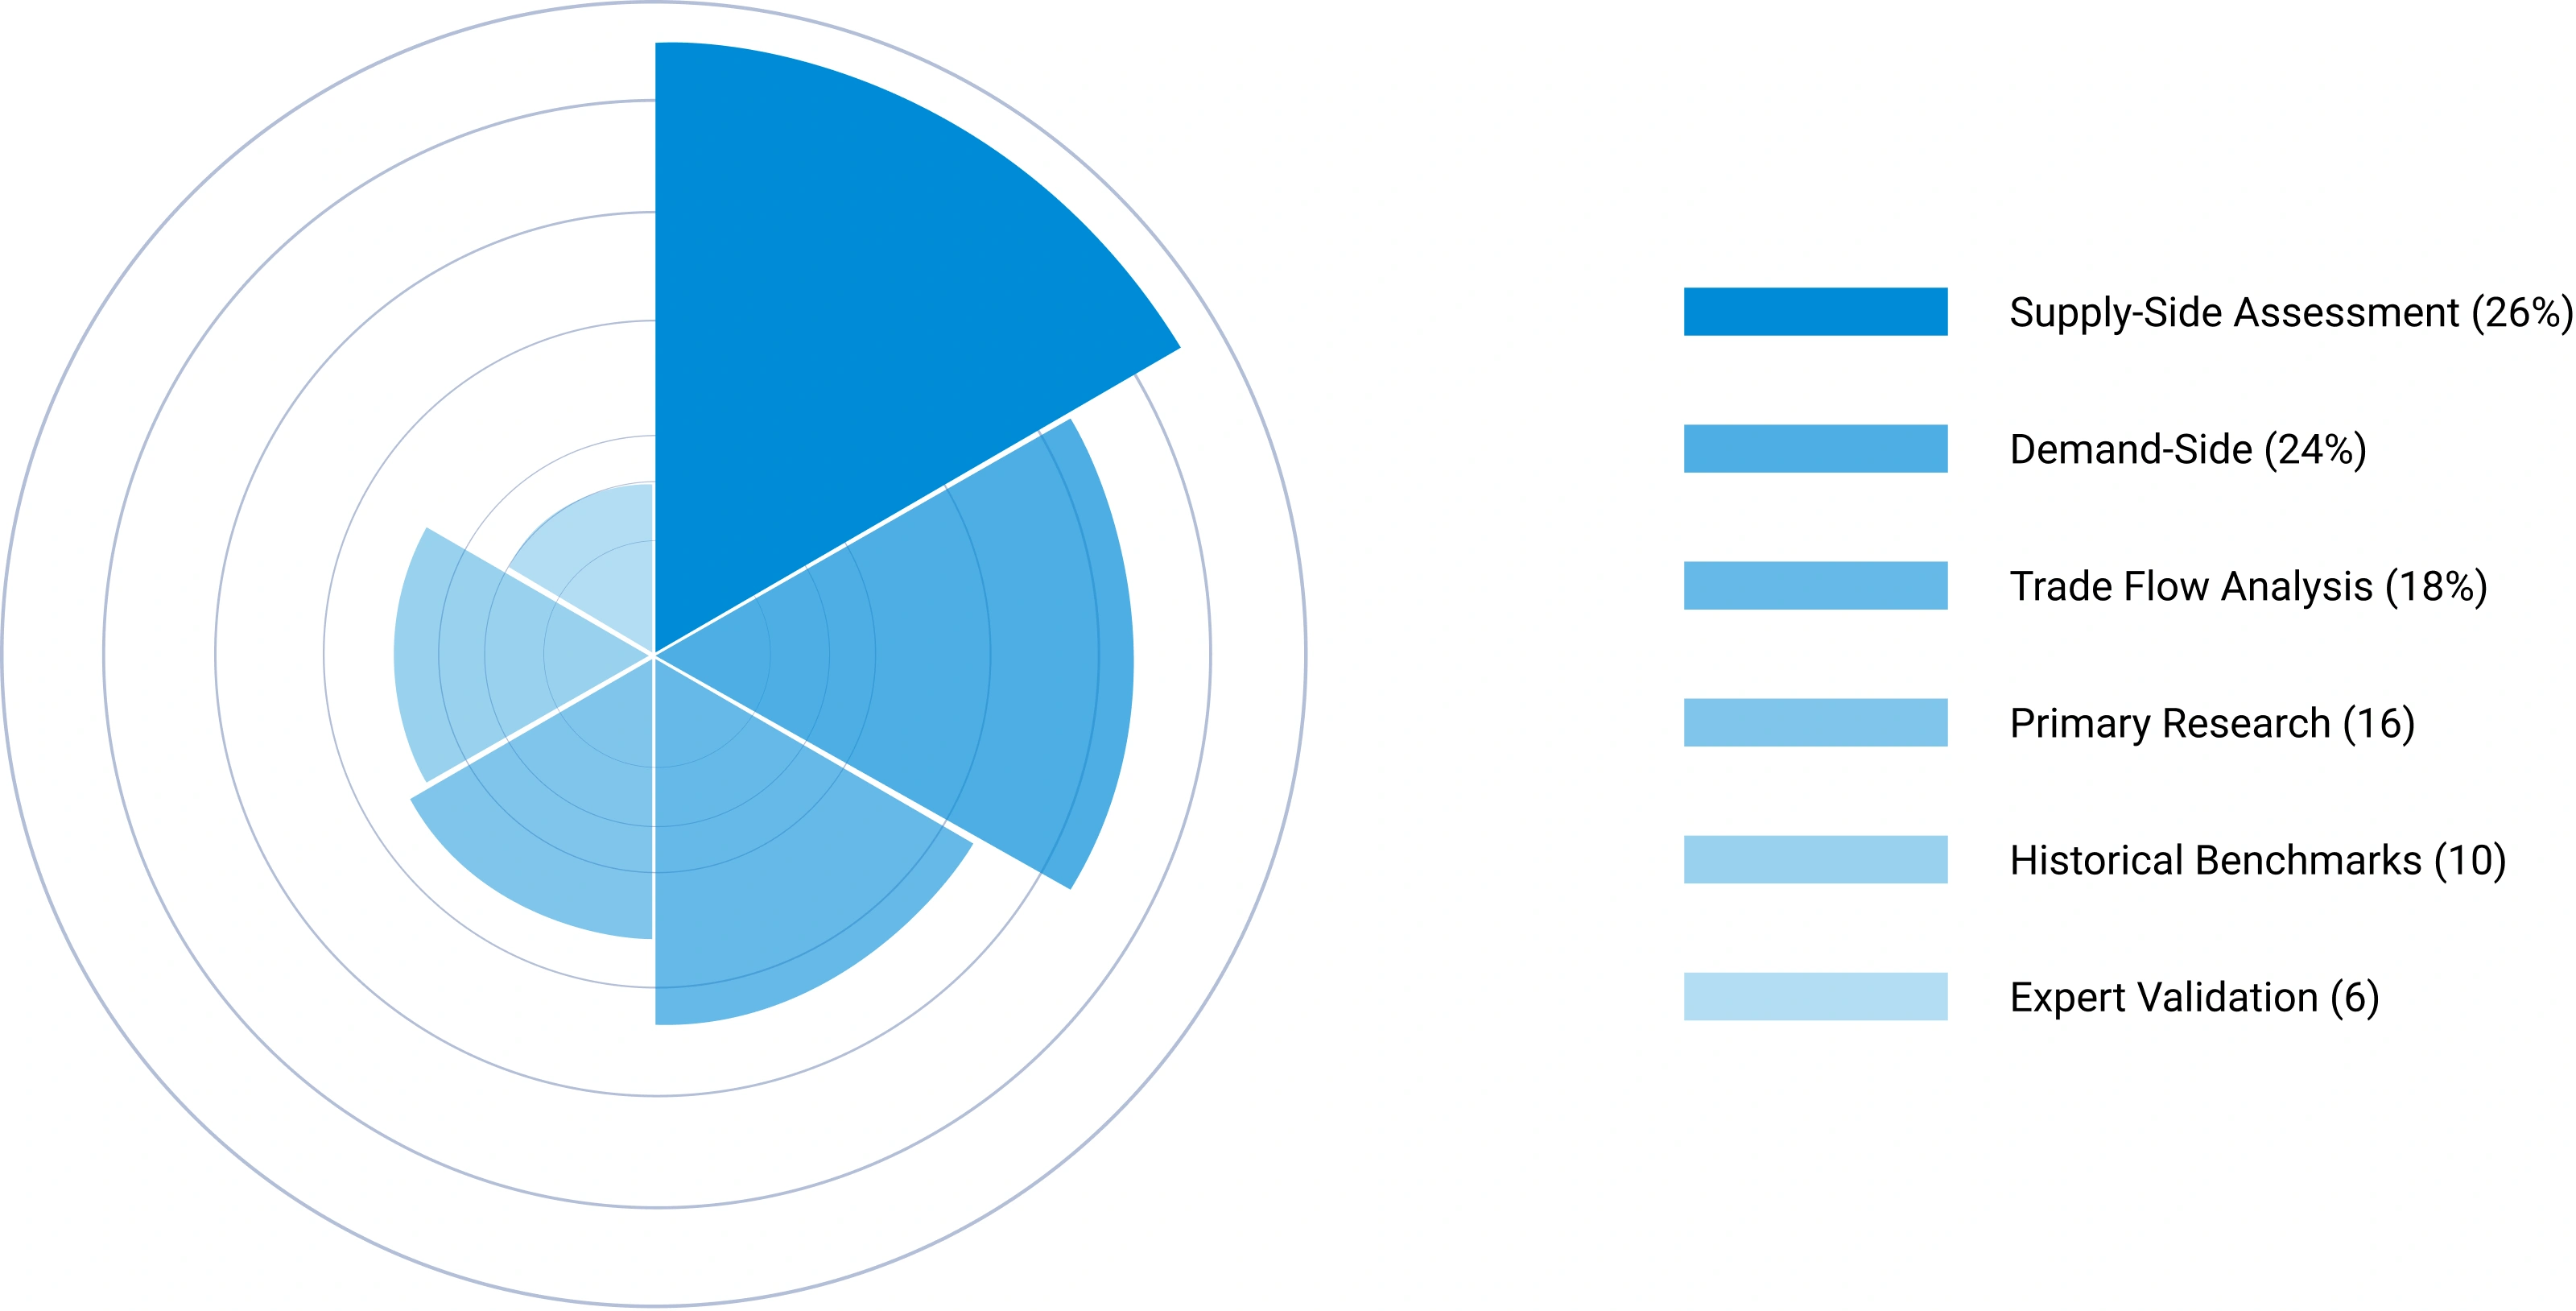
No single methodology is relied upon in isolation. Multiple independent estimation approaches are combined and reconciled to ensure consistency, accuracy, and analytical defensibility. Any material deviations between approaches are investigated and adjusted through additional validation cycles.
The final market size is derived through weighted triangulation of all validated methodologies. Any material deviations between approaches are investigated and adjusted through additional validation cycles. The outcome represents the most realistic assessment of the market based on available evidence and expert confirmation ensuring that volume and value estimates are fully consistent with one another.
Triangulation Framework — Input Contribution Weight
Relative weight each sizing input contributes to the final reconciled market estimate
Phase 7 — Forecast Modeling: Projecting Future Market Evolution
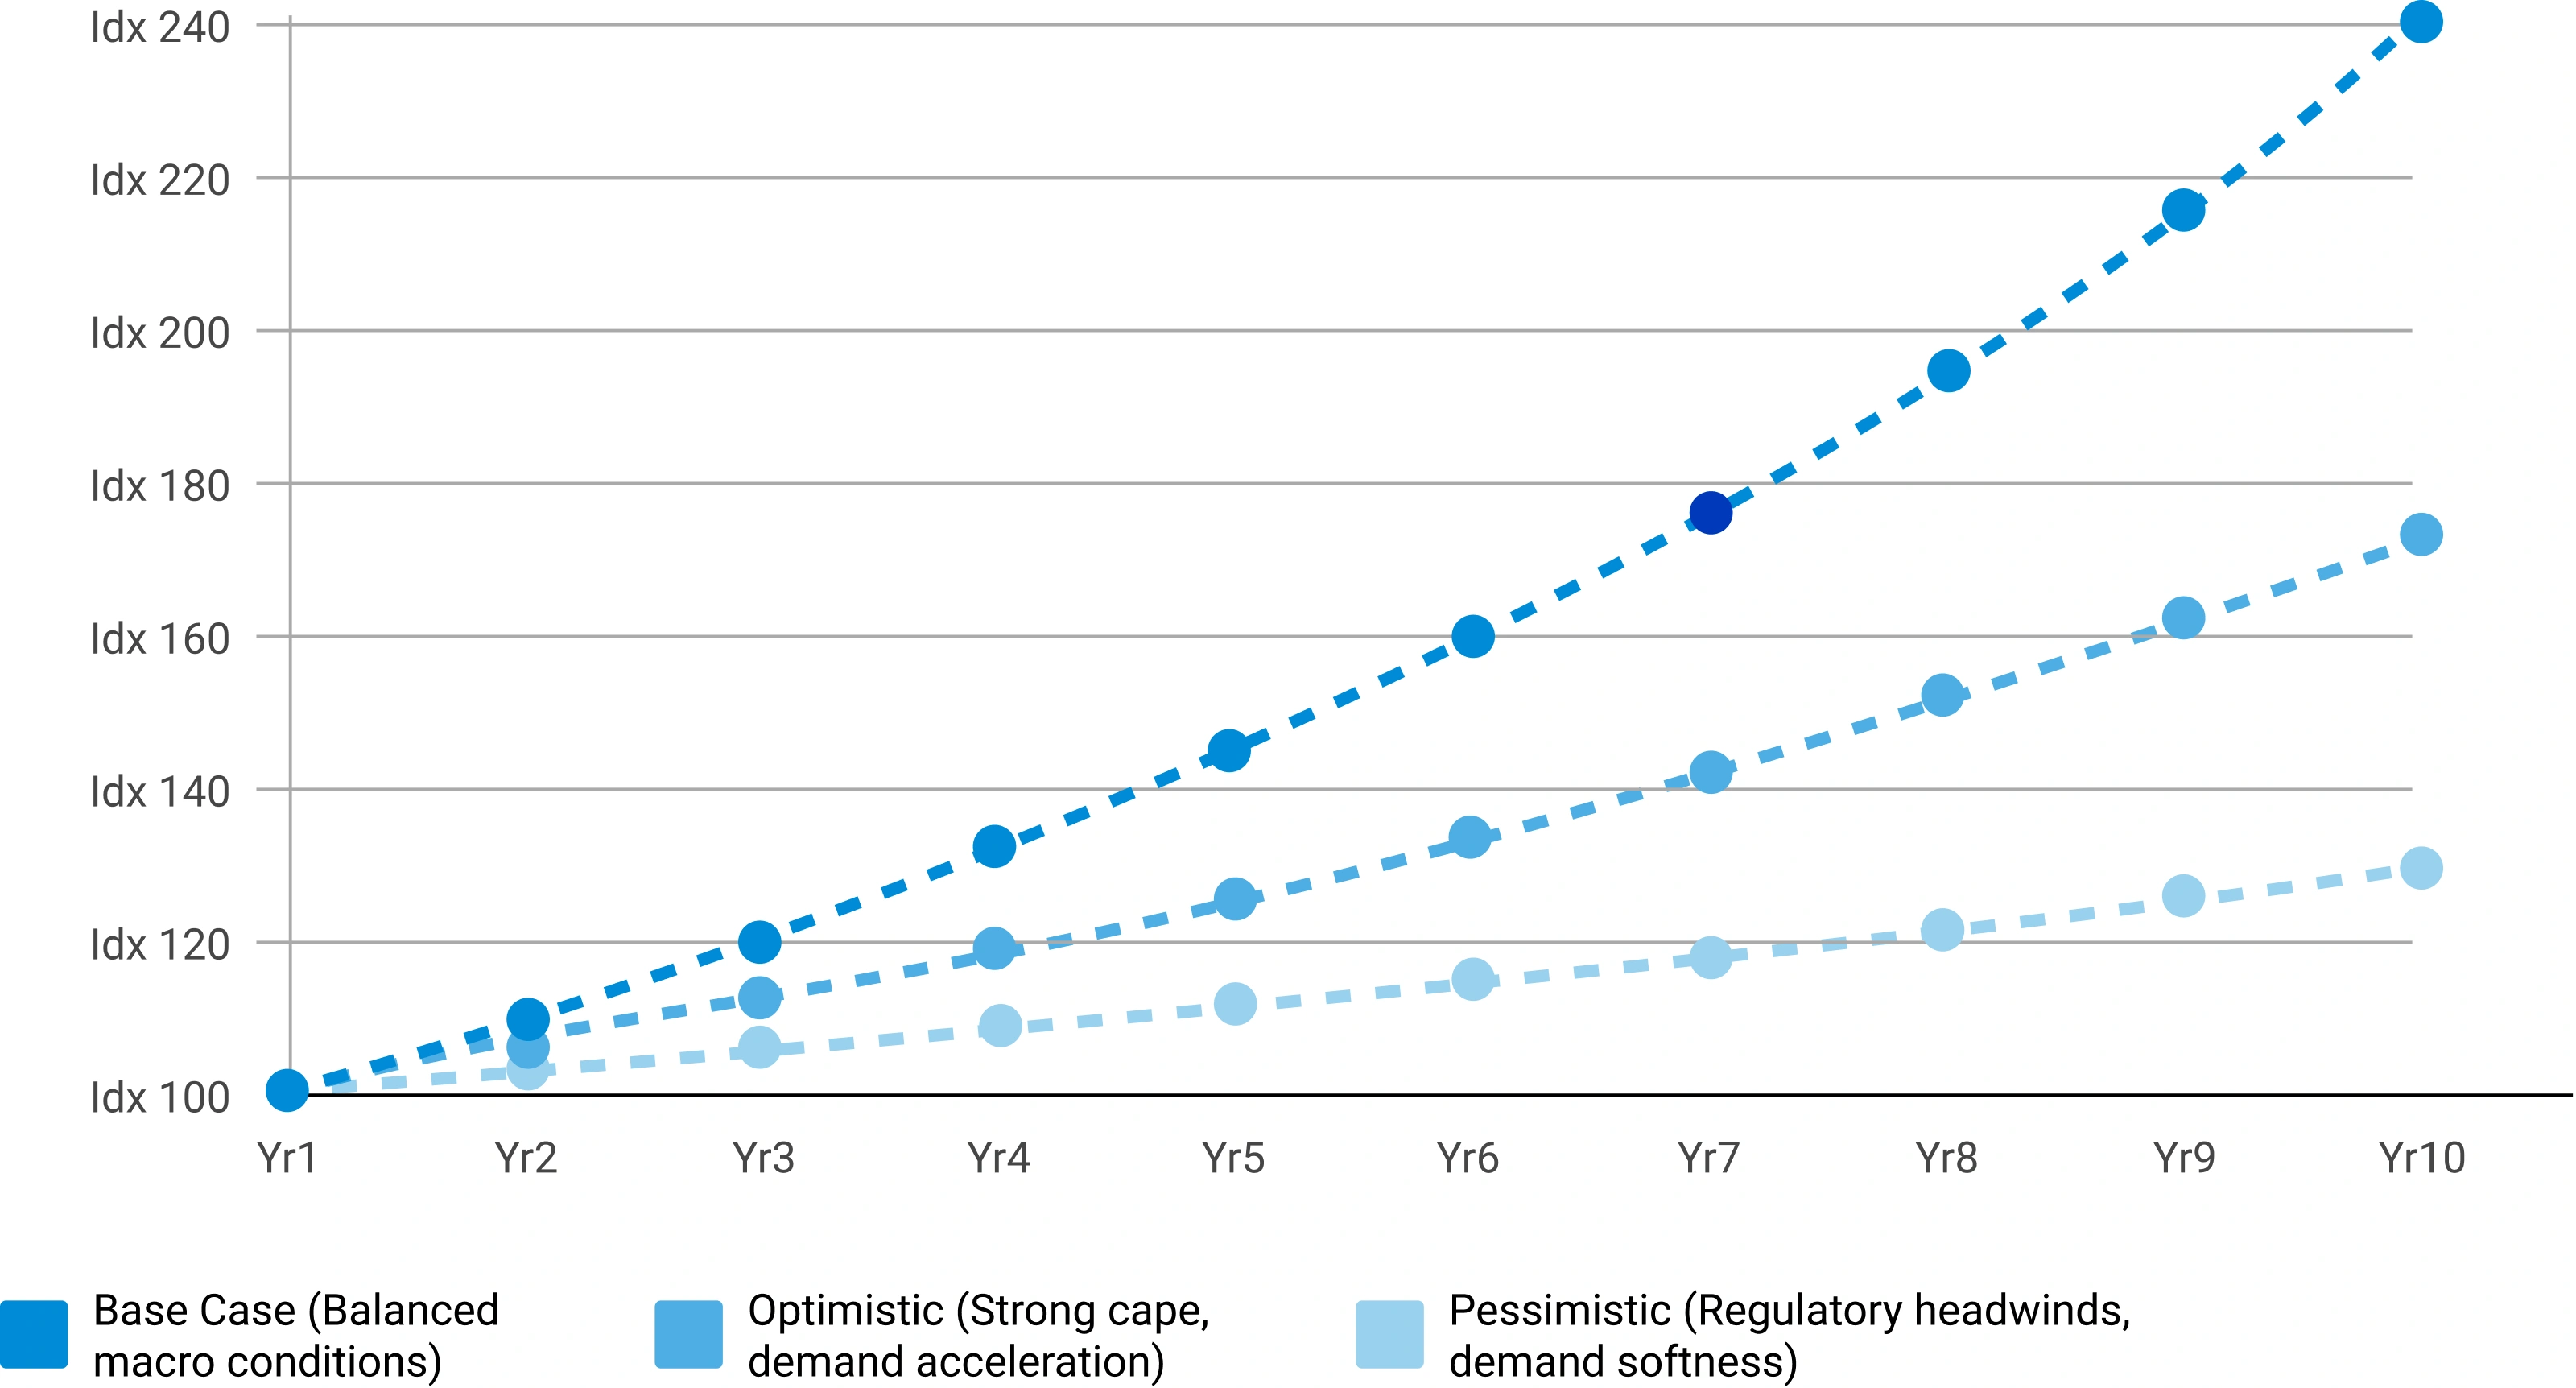
Forecasting evaluates the future trajectory of the market using a combination of quantitative indicators and qualitative assessments across economic, industry, and regulatory dimensions. Rather than simple extrapolation, each driver is independently modeled and integrated into a composite forecast.
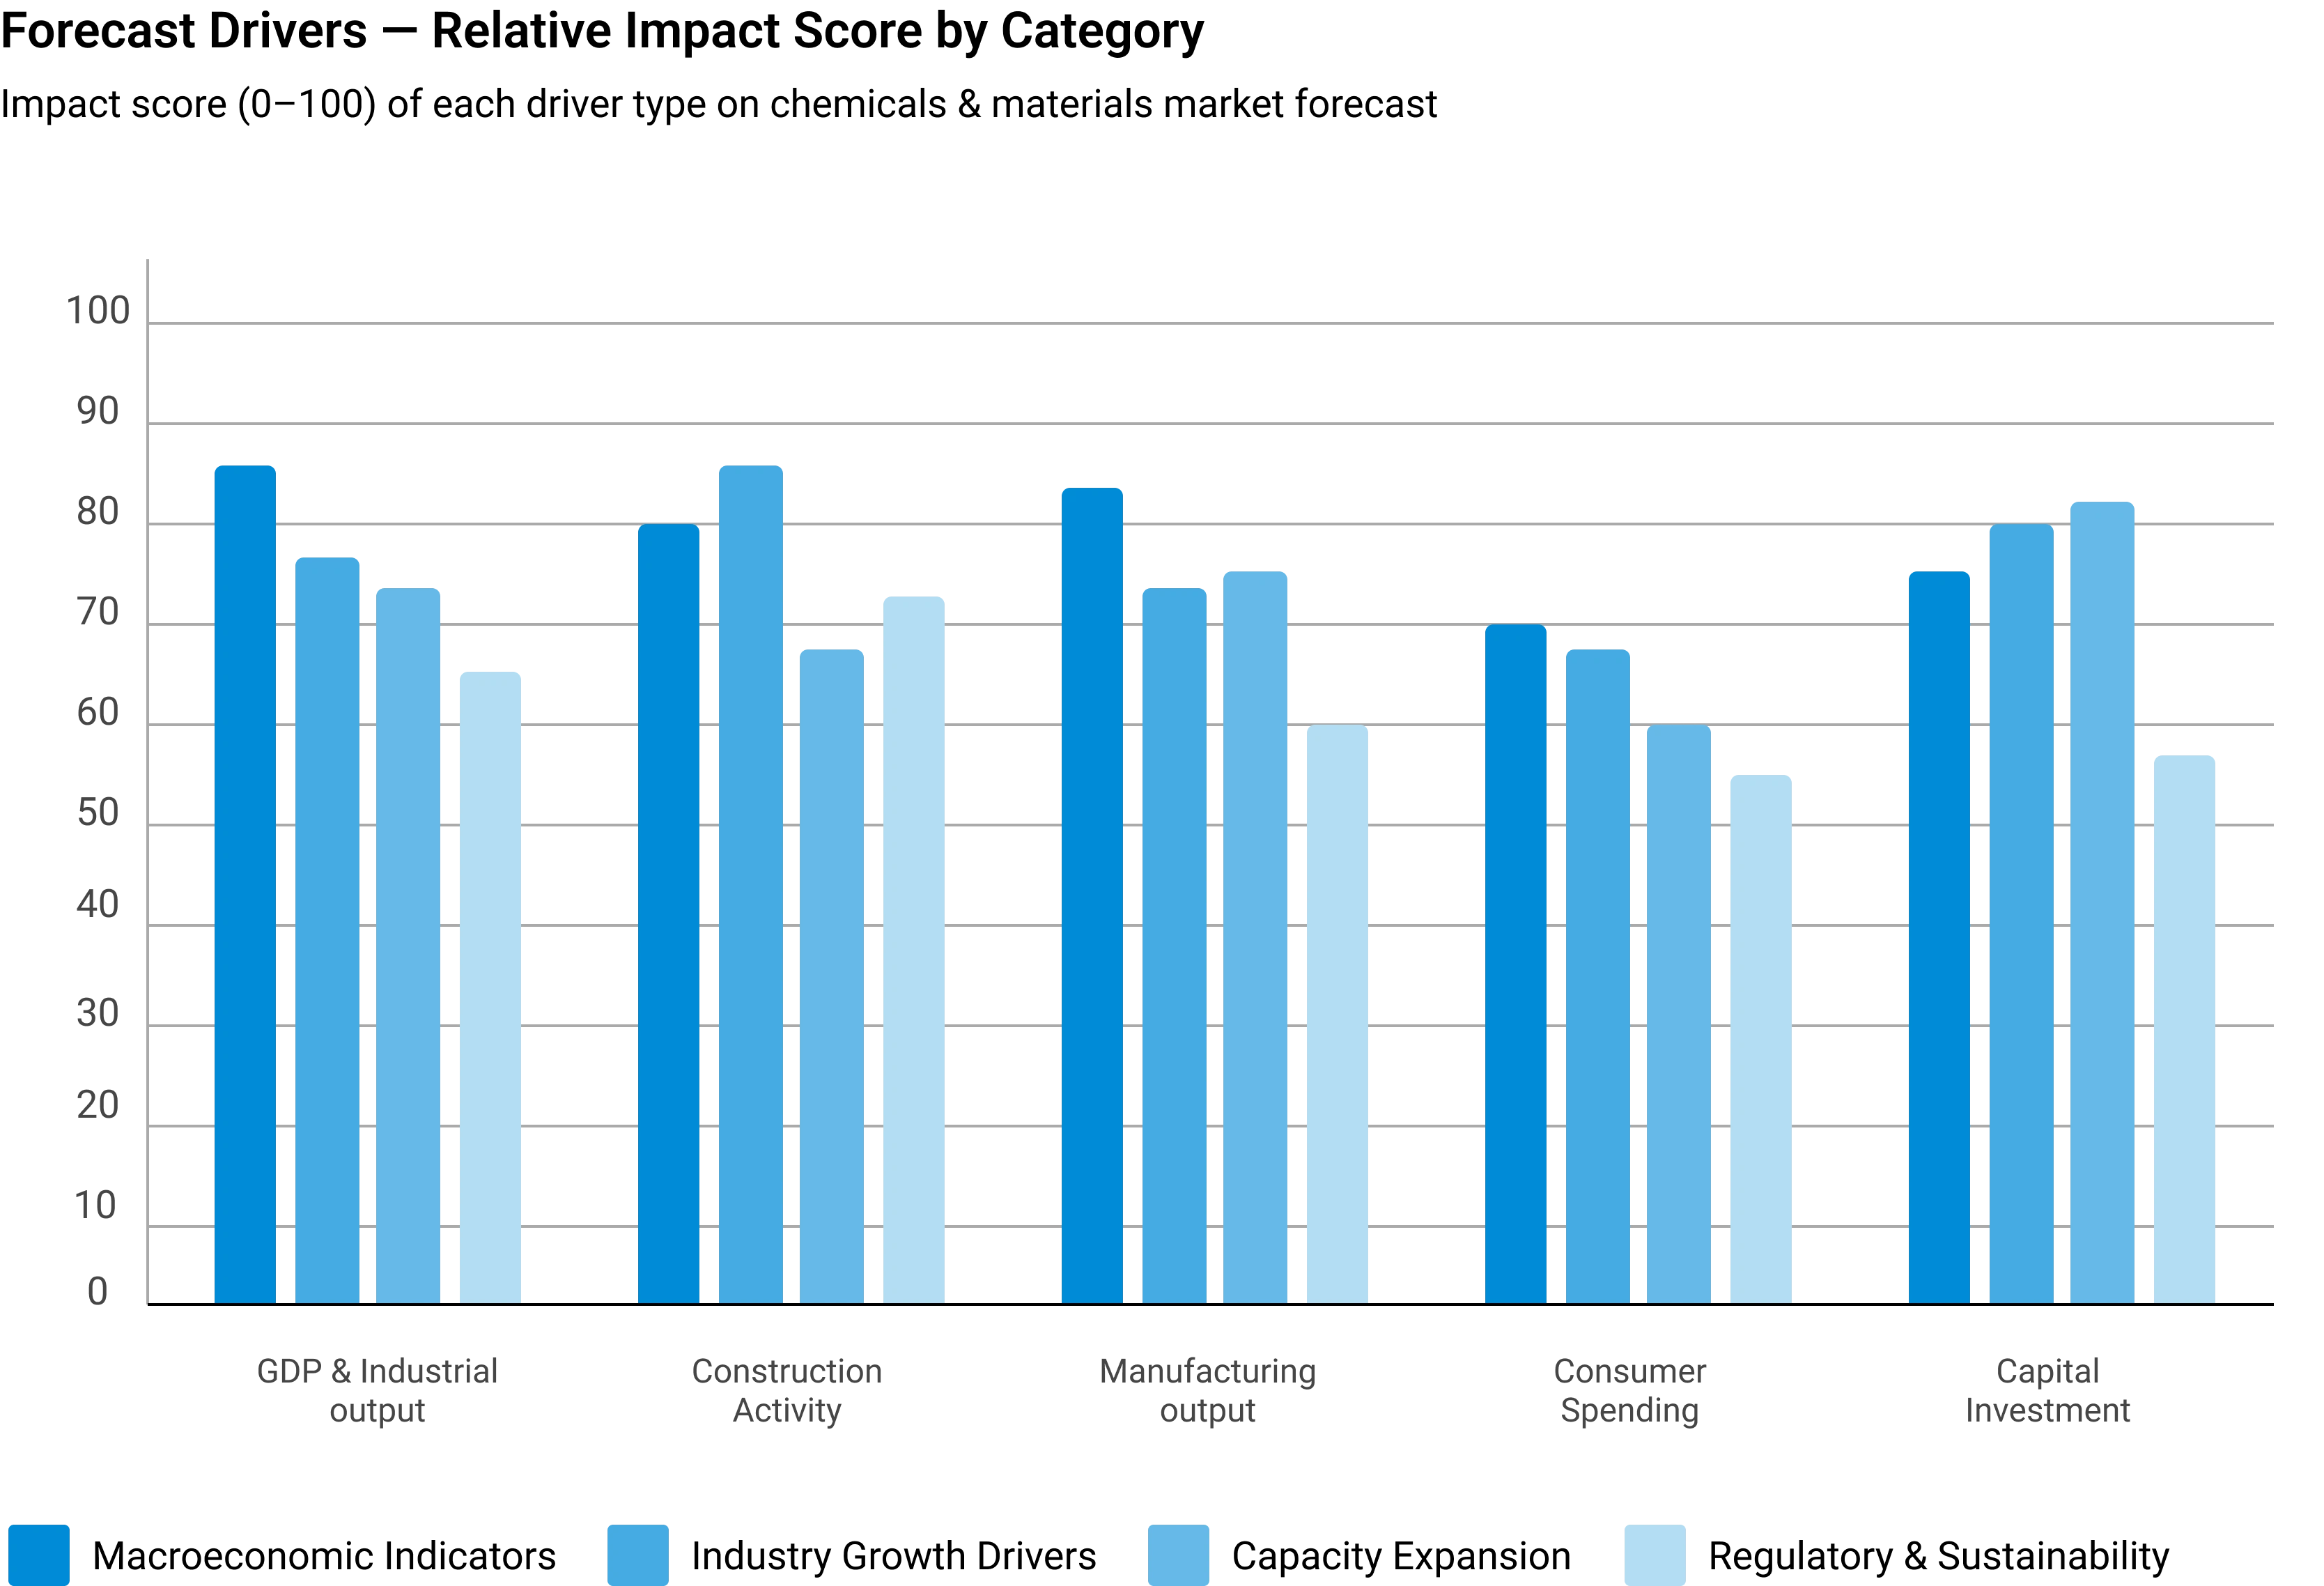
Macroeconomic Indicators
GDP growth, industrial production, manufacturing output, construction activity, consumer spending, and capital investment form the quantitative foundation of long-term demand projections. These are applied at country, regional, and global levels.
Industry Growth Drivers
Urbanization, infrastructure development, industrialization, technological innovation, sustainability initiatives, and evolving product performance requirements are assessed at regional and industry levels — capturing both structural and cyclical demand drivers.
Capacity Expansion Analysis
Announced plant expansions, new manufacturing facilities, technology upgrades, and strategic investments are evaluated to determine future supply-demand dynamics and potential market tightness or oversupply situations.
Regulatory & Sustainability
Environmental regulations, chemical safety standards, emission reduction targets, circular economy initiatives, and sustainability requirements are incorporated as they often influence product adoption rates and market growth trajectories.
Scenario Forecast Range — Indexed Market Growth (Year 1–10)
Illustrative indexed growth trajectories across Base, Optimistic, and Pessimistic scenarios over a 10-year forecast horizon
Forecast Drivers — Relative Impact Score by Category
Impact score (0–100) of each driver type on chemicals & materials market forecast



Comments
Share your thoughts, ask a question, or provide feedback about this report.