
Low Migration Inks Market Size Analysis Report 2035
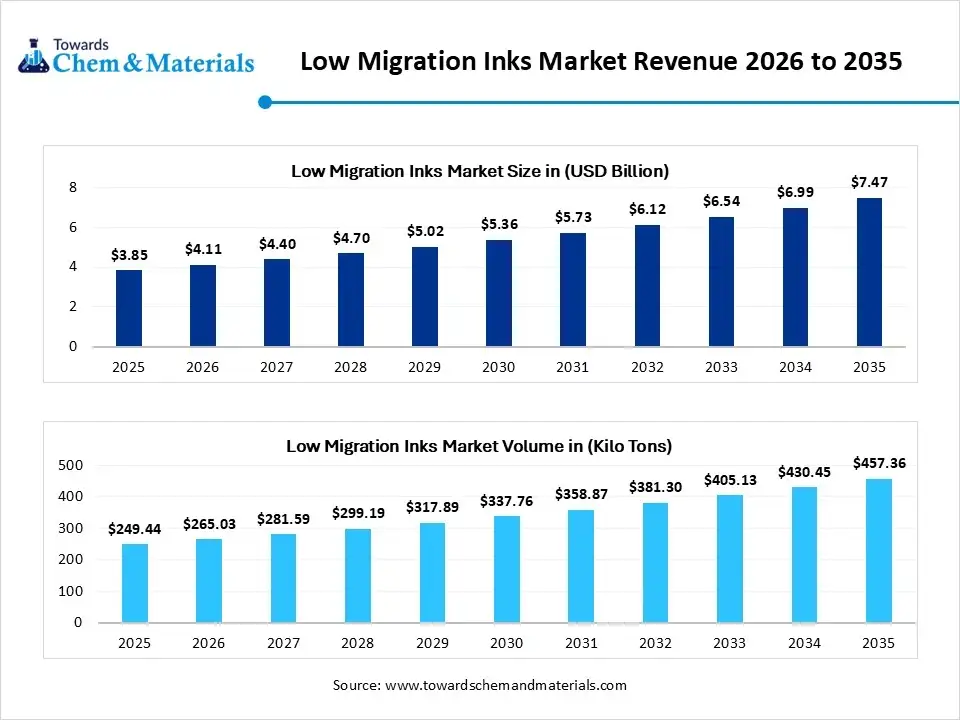
The low migration inks market size was valued at USD 3.85 billion in 2025, is estimated to reach USD 4.11 billion in 2026, and is projected to reach USD 7.47 billion by 2035, exhibiting a compound annual growth rate (CAGR) of 6.85% over the forecast period from 2026 to 2035.Europe dominated the low migration inks market with the largest revenue share of 34% in 2025 and is expected to grow at the fastest CAGR of 4.74% during the forecast period. In terms of volume, the low migration inks market is projected to grow from 249.44 kilo tons in 2025 to 457.36 kilo tons by 2035. growing at a CAGR of 6.25% from 2026 to 2035. Increasing consumer awareness of product safety is the key factor in driving market growth. Also, the ongoing growth of the packaged food sector, coupled with strict packaging regulations, can fuel market growth further.
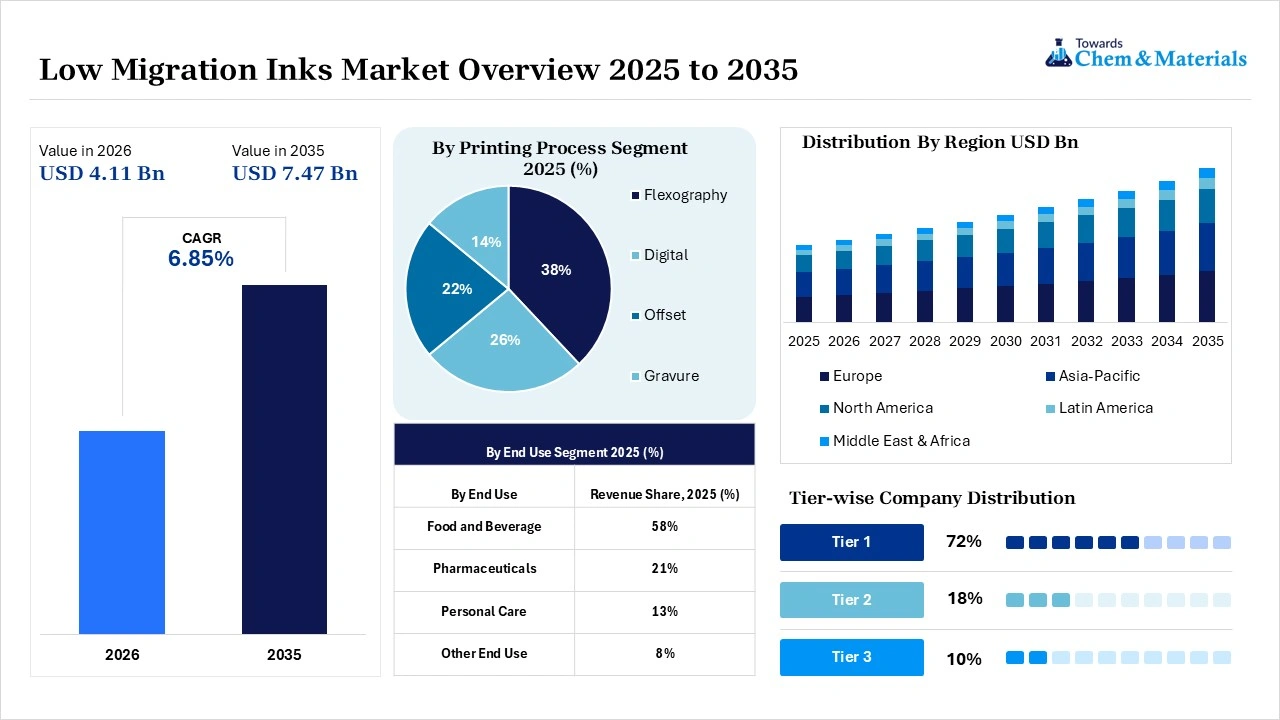
Low migration inks are printing inks created to safeguard chemical components from penetrating packaging materials and contaminating the enclosed product. They are mainly used in cosmetics, food, beverage, and pharmaceutical packaging to ensure consumer safety and overall product integrity. It also encompasses the entire value chain from raw material to ink packaging converters and formulators.
Market Highlights
- By region, Europe dominated the market with the largest share of 34% in 2025. The dominance of the region can be attributed to the growing consumer demand for sustainable packaging.
- By region, Asia Pacific held the market share of 31% in 2025 and is expected to grow at the fastest CAGR of 8.20% over the forecast period. The dominance and growth of the region can be attributed to the growing consumer health awareness.
- By printing process, the flexography segment dominated the market with the largest share of 38% in 2025. The dominance of the segment can be attributed to the expanding food beverage.
- By printing process, the digital segment held the market share of 26% in 2025 and is expected to grow at the fastest CAGR of 8.50% over the forecast period. The growth of the segment can be credited to the surge in safety and environmental regulations.
- By end use, the food and beverage segment dominated the market with the largest share of 58% in 2025. The dominance of the segment can be attributed to the ongoing growth of packaged and ready-to-eat foods.
- By end use, the pharmaceuticals segment held a market share of 21% in 2025 and is expected to grow at the fastest CAGR of 7.80% over the forecast period. The growth of the segment can be credited to the growing demand to prevent ink components.
Quick Stats at a Glance
- Market Estimated Size (2025): USD 3.85 Billion | CAGR (2026–2035): 6.85%
- Market Projected Size (2035): USD 7.47 Billion
- Europe: largest Market Revenue Share of 34% in 2025|USD 1.31 Billion
- Market Estimated Volume (2025): 249.44 Kilo Tons | Volume CAGR (2026–2035):6.25%
- Market Projected Volume (2035): 457.36 Kilo Tons
- Market Pricing (2025):
- Average Manufacturing Price (2025): USD 10.80/kg
- Average Selling Price (2025): USD 13.25/kg
- Pricing CAGR (2026–2035): 2.66%
The market operates through a comprehensive value chain comprising raw material suppliers, resin and pigment manufacturers, ink formulators, packaging converters, distributors, and end-use packaging enterprises. Ink manufacturers are increasingly prioritizing the development of novel formulations that adhere strictly to regional food contact regulations and migration testing standards.
The growing expansion of e-commerce increases demand for label printing and packaging. This platform offers a variety of goods and services, including physical goods like groceries, clothing & electronics, digital products like online courses, e-books, music, and software & services like travel & food delivery. The growing adoption of e-commerce is due to its convenience, wide variety & selection, and price comparison.
E-commerce helps in the growth of the low migration inks market. The rapid expansion of e-commerce increases demand for durable & safe packaging. The rapid growth in online sales fuels demand for packaging and label products. The growing online sales of food & beverages increase demand for low migration inks for safe food packaging. Low migration inks minimize the risk of returning the products by avoiding contamination, which helps to save resources and time for e-commerce. The growing consumer demand for sustainable packaging is fueling demand for low migration inks.
The easy accessibility of e-commerce helps consumers, and that increases demand for enhancing product safety, protecting sensitive products, and complying with regulations. The growing online ordering of foods, beverages, personal care items, cosmetics, pharmaceuticals, and electronics is a key driver for the low migration inks market.
Low Migration Inks Market Trends
- The growing importance of food packaging safety regulations is the latest trend in the market, shaping positive market growth. The food manufacturers and distributors are working on food-safe printing inks to reduce the risk of contamination and stick to the packaging standards.
- The increasing trend towards eco-friendly packaging solutions is helping the market to expand in terms of usage. Market players are heavily investing in sustainable inks to ensure sustainability without compromising the safety of the food packaging industry.
- The rapid advancements in ink formulations are another major trend in the market driving market growth. Major players are increasingly investing in research and development to produce inks that give better performance while adhering to stringent safety standards.
Low Migration Inks Market Report Scope
| Report Attributes | Details |
| Market Size in 2026 | USD 4.11 Billion/ 265.03 Kilo Tons |
| Expected Size in 2035 | USD 7.47 Billion/ 457.36 Kilo Tons |
| Growth Rate | CAGR of 6.85% |
| Base Year of Estimation | 2025 |
| Forecast Period | 2025-2035 |
| High Impact Region | Europe |
| Segment Covered | By Printing Process, By End Use, By Region |
| Key Company Profiled | Agfa-Gevaert, Altana, Epple Druckfarben, Flint Group, HuberGroup, INX International, Marabu GmbH, Siegwerk Druckfarben, Sun Chemical, Toyo Ink, HAPA AG |
How Are Cutting-Edge AI Technologies Revolutionizing the Low Migration Inks Market?
Advanced AI technologies are transforming the market by boosting chemical research, ensuring proper compliance with stringent food contact regulations, and facilitating quality control. Furthermore, ML algorithms simulate how various resins, pigments, and additives interact with different packaging materials to safeguard and prevent chemical migration before physical testing begins.
Supply Chain Analysis of the Low Migration Inks Market
- Feedstock Procurement:It includes the sourcing of nontoxic and high-purity raw materials like polymers, specialty resins, and pigments. It ensures materials meet stringent safety and regulatory standards.
- Major Players: Sun Chemical Corporation, Siegwerk Druckfarben AG & Co. KGaA
- Chemical Synthesis and Processing:It includes the highly specialized design, molecular engineering, and production of raw ink components to prevent hazardous chemicals from bleeding through packaging.
- Major Players: Flint Group, hubergroup Deutschland GmbH
- Packaging and Labelling:It includes the industry dedicated to specially formulated printing inks created to safeguard chemical substances from bleeding, transferring, or leaching from the outer packaging material into sensitive consumer goods.
- Major Players: INX International Ink Co., Flint Group
- Regulatory Compliance and Safety Monitoring:It includes the stringent framework of international laws, guidelines, and laboratory testing protocols to make compliance over supply chain operations.
- Major Players: Hubergroup, ACTEGA.
Low Migration Inks Market's Regulatory Landscape: Global Regulations
| Country/Region | Key Regulations |
| European Union | Industry Standards: Because there is no specific EU law for inks, the industry relies heavily on guidelines by the European Printing Ink Association (EuPIA), which mandates strict Good Manufacturing Practices (GMP) and exclusionary lists of toxic raw materials. |
| United States | If a packaging material (like glass, metal, or specific thick plastics) acts as a functional barrier, preventing ink from reaching the food, the ink components do not require FDA clearance. If migration does occur, every individual migrating component must be cleared under FDA food-contact regulations (21 CFR). |
| China | GB 9685 includes a positive list of permissible additives for printing inks, specifying exact Maximum Permitted Quantity (QM) and Specific Migration Limits (SML) for resins, colorants, and plasticizers used in food packaging. |
Market Dynamics
Driver
Increase in Consumer Health Awareness
The growing consumer awareness regarding health and safety is the major factor driving market expansion. As consumers are increasingly becoming aware of the risks associated with food packaging and printing materials, there is an increasing demand for inks that do not migrate these substances into food products. In addition, the performance of low-migration inks is significantly enhanced by technological advancements such as digital printing and sophisticated curing techniques, hence increasing their adoption across diverse sectors.
Restraint
High Costs
The high costs of low migration inks over traditional printing inks act as a major factor in hindering the growth of the market. The high prices of important raw materials such as dyes & pigments, photoinitiators, binders, and solvents affect the production of low migration inks. Moreover, due to the prohibitive capital costs associated with low migration formulations, industries involved in food and pharmaceutical packaging often prioritize the use of conventional printing inks.
Opportunity
Increasing Demand in the Packaging Sector
The growing product demand in the packaging sector is a key factor creating a lucrative opportunity in the market. With the growth of retail and e-commerce, the demand for safe and effective packaging solutions has increased significantly. Furthermore, low migration inks are highly prioritized in food packaging applications to mitigate the risk of chemical contamination, hence ensuring consumer safety and product integrity. This trend is further reinforced by a growing emphasis on brand integrity and consumer trust, impelling organizations to invest in in inks that ensure strict safety and regulatory compliance.
Segmental Insights
Printing Process Insights
The flexography segment dominated the market with the largest share of 38% in 2025. The dominance of the segment can be attributed to the expanding food, beverage, and pharmaceutical packaging sectors, along with its versatility and cost-effectiveness. In addition, major players are heavily investing in UV/LED-curable flexo hybrids.
The digital segment held a market share of 26% in 2025 and is expected to grow at the fastest CAGR of 8.50% over the forecast period. The growth of the segment can be credited to the surge in safety and environmental regulations and ongoing innovations in ink formulations for consumer goods. Brands are transitioning away from mass production toward short-run production.
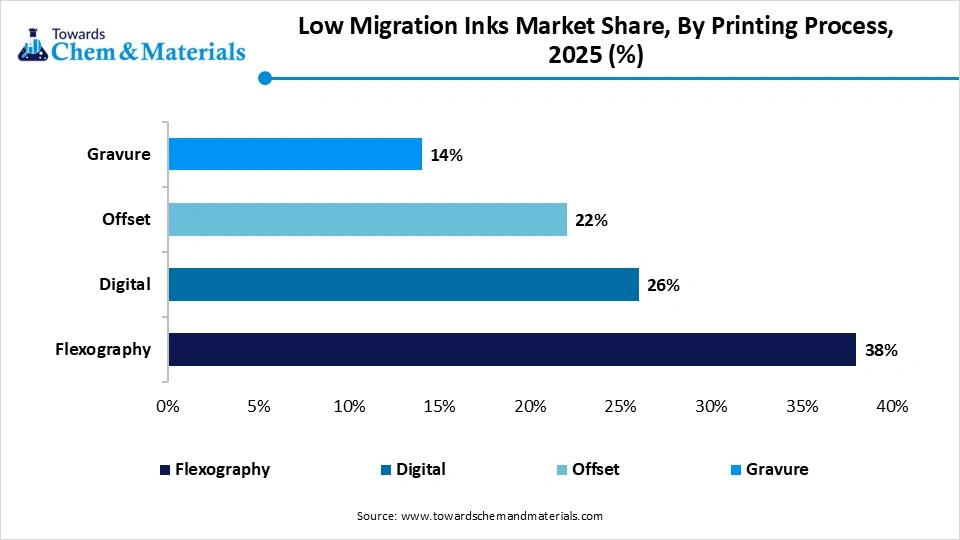 The offset segment held a market share of 22% in 2025. The growth of the segment can be linked to the ongoing transition towards sustainable packaging and strict food safety regulations. Also, brands are increasingly adopting low-migration offset inks to avoid product recalls.
The gravure segment held the market share of 14% in 2025. The growth of the segment can be driven by increasing global demand for compliant and safe food coupled with the innovations in the formulation process. FMCG and pharmaceutical companies need superior aesthetic appeal, impacting positive segment growth soon.
Low Migration Inks Market Share, By Printing Process, 2025 (%)
| By Printing Process | Revenue Share, 2025 (%) |
| Flexography | 38% |
| Digital | 26% |
| Offset | 22% |
| Gravure | 14% |
End Use Insights
The food and beverage segment dominated the market with the largest share of 58% in 2025. The dominance of the segment can be attributed to the ongoing growth of packaged and ready-to-eat foods along with the stringent food safety regulations. Consumers are aware of the health risk related to chemical ink contamination.
The pharmaceuticals segment held a market share of 21% in 2025 and is expected to grow at the fastest CAGR of 7.80% over the forecast period. The growth of the segment can be credited to the growing demand to prevent ink components and stringent regulatory compliance. The growing demand for product purity pushed brand owners to cut potential chemical contamination.
The personal care segment held a market share of 13% in 2025. The growth of the segment can be linked to the growing consumer's need for clean label products and the surge in flexible and plastic packaging demand. Furthermore, governments and health authorities are enforcing stringent guidelines regarding toxic substances in cosmetic packaging.
The other end use segment held the market share of 8% in 2025. The growth of the segment can be driven by increasing consumer safety demand and high-grade printing needs in major sectors. Moreover, consumer awareness regarding skin safety and ingredient absorption fuels demand further.
Low Migration Inks Market Share, By End Use, 2025 (%)
| By End Use | Revenue Share, 2025 (%) |
| Food and Beverage | 58% |
| Pharmaceuticals | 21% |
| Personal Care | 13% |
| Other End Use | 8% |
Regional Analysis
How did Europe Dominate the Low Migration Inks Market in 2025?
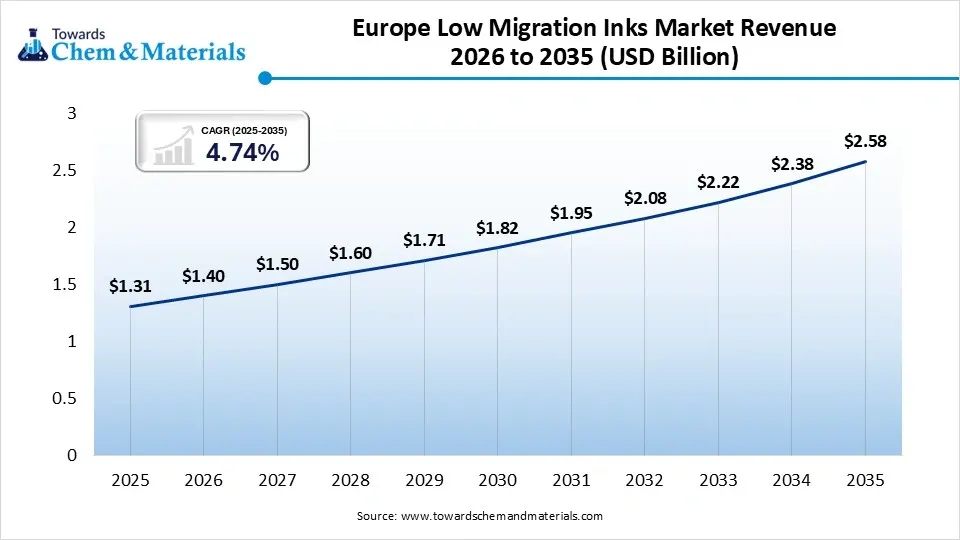
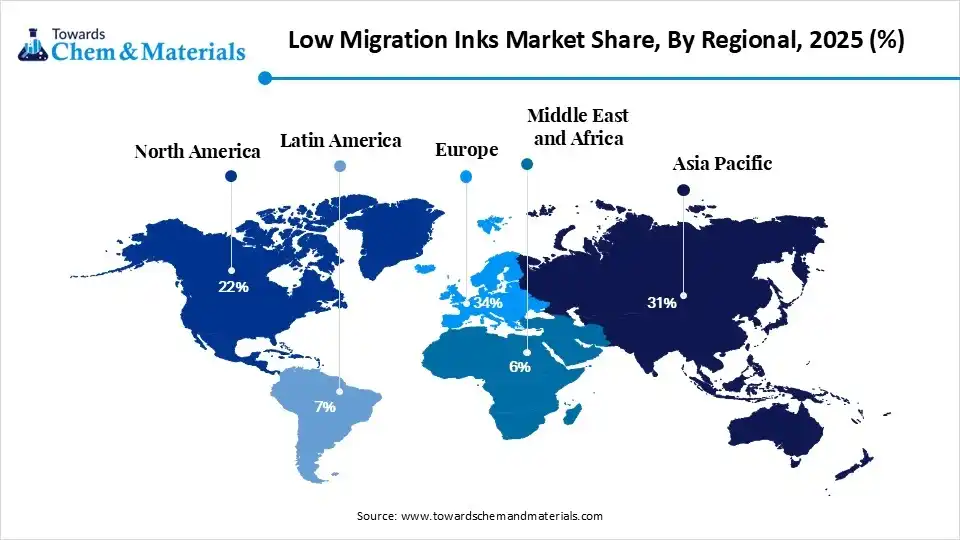
The Europe low migration inks market size was estimated at USD 1.31 billion in 2025 and is projected to reach USD 2.58 billion by 2035, growing at a CAGR of 4.74% from 2026 to 2035.Europe dominated the market with the largest share of 34% in 2025. The dominance of the region can be attributed to the growing consumer demand for sustainable, safe, and eco-friendly food and pharmaceutical packaging along with the stringent mineral oil bans. In addition, increasing consumer awareness related to health hazards from chemical leaching from packaging has facilitated market expansion soon.
Germany
- Growing consumer and legislative demands for non-toxic, sustainable, and recyclable packaging have accelerated the adoption of compliant formulations.
- The stringent Swiss Ordinance on printing inks acts as the gold standard, propelling brand owners to exclusively use low migration inks to safeguard harmful chemicals from leaching into food, beverages, or pharmaceuticals.
The Asia Pacific low migration inks market size was estimated at USD 1.19 billion in 2025 and is projected to reach USD 2.35 billion by 2035, growing at a CAGR of 7.04% from 2026 to 2035.Asia Pacific dominated the market with the largest share of 31% in 2025 and is expected to grow at the fastest CAGR of 8.20% over the forecast period. The dominance and growth of the region can be attributed to the growing consumer health awareness and exponential growth of the packaged food industry. Moreover, developing markets are rapidly adopting EU-style chemical safety and food-contact legislation.
China
- Stringent consumer safety awareness and a massive export market for beauty products and medications need highly compliant and safe labeling.
- Major market players are scaling up domestic low migration ink production, lowering costs, and boosting overall supply chains for packaging converters.
The North America low migration inks market size was estimated at USD 0.85 billion in 2025 and is projected to reach USD 1.68 billion by 2035, growing at a CAGR of 7.05% from 2026 to 2035.North America held a market share of 22% in 2025. The growth of the region can be linked to the rapid transition towards sustainable packaging along with the increasing demand for packaged food. Also, there is a robust industry-wide shift towards solvent-free, water-based, and low-VOC ink formulations as companies are seeking sustainable packaging solutions.
United States
- The FDA is enforcing rigorous standards for indirect food additives and packaging, fueling their adoption to fulfill legal mandates.
- Consumers are becoming more conscious of chemical exposure in cosmetics, food, and pharmaceuticals, leading to market growth soon.
Canada
- Regulatory bodies are focusing on the use of low-migration inks for food, pharmaceutical, and cosmetic packaging to avoid toxic chemicals from leaching through substrates.
- Canada’s strong food & beverage manufacturing and pharmaceutical sectors are increasingly adopting these inks.
The Latin America low migration inks market size was estimated at USD 0.27 billion in 2025 and is projected to reach USD 0.56 billion by 2035, growing at a CAGR of 7.57% from 2026 to 2035.Latin America held a market share of 7% in 2025. The growth of the region can be driven by growing pharmaceutical and food standards along with the regional shift towards sustainable and flexible packaging. Major market players in the region are heavily adopting low migration inks to fulfill the stringent regulatory import standards, impacting positive market growth soon.
 Brazil
- Consumers and regulators in the country are demanding safer packaging materials, propelling food and pharmaceutical brands to adopt low-migration inks to prevent contamination.
- There is an ongoing regional shift toward lightweight, sustainable, and appealing flexible packaging, which needs advanced low-migration ink applications.
Argentina
- Argentina’s extensive agricultural and food processing sectors need strict packaging standards to export to heavily regulated markets like the European Union and North America.
- Major players are gradually shifting from traditional solvent-based inks to eco-friendly, UV-curable, and water-based low-migration inks.
The Middle East & Africa low migration inks market size was estimated at USD 0.23 billion in 2025 and is projected to reach USD 0.49 billion by 2035, growing at a CAGR of 7.86% from 2026 to 2035.The Middle East & Africa held a market share of 6% in 2025. The growth of the region is owing to the increasing export of food and pharmaceuticals and stringent safety awareness regarding their use. Furthermore, many leading FMCG brands operating in the MEA need safety standards for their regional packaging, driving regional growth soon.
Saudi Arabia
- The surge in local reliance on branded, high-quality, and compliant packaging to fulfill modern retail standards and e-commerce growth is the major factor driving market growth.
- The Saudi Food and Drug Authority (SFDA) need rigorous labeling and packaging standards, boosting the shift toward low migration inks.
UAE
- The UAE acts as a massive regional hub for food processing and packaged convenience foods.
- Cutting-edge low-migration inks, such as UV-curable, water-based, and bio-based formulations, are more compatible with these modern, eco-friendly substrates, leading to country growth soon.
Low Migration Inks Market Share, By Regional, 2025 (%)
| Regional | Revenue Share, 2025 (%) |
| Europe | 34% |
| Asia-Pacific | 31% |
| North America | 22% |
| Latin America | 7% |
| Middle East & Africa | 6% |
Recent Developments
- In March 2026, Toyo Ink Europe, the European energy-curing inks subsidiary of Japan’s Artience Group, launched a comprehensive suite of UV-curable inks featuring low-migration and low-energy capabilities specifically engineered for food-safe packaging applications. This product portfolio was developed to ensure compliance with strict migration thresholds.(Source: packaginginsights)
- In March 2026, Hubergroup Print Solutions is expanding the international availability of its specialized metal decoration ink system, TINKREDIBLE MGA. Engineered specifically for monobloc and three-piece metal packaging, this advanced formulation is entirely free of mineral oils, bisphenol A (BPA), and per- and polyfluoroalkyl substances (PFAS).(Source: packaginginsights)
Low Migration Inks Market Companies
- Agfa-Gevaert: Agfa-Gevaert is a key innovator and niche supplier in the low migration inks market. While larger giants dominate analogue printing, Agfa specializes in diffusion-hindered UV-curable inkjet inks for indirect food contact and sensitive packaging applications, such as pharmaceuticals and blister foils.
- Altana: ALTANA (specifically operating through its division of ACTEGA) is a major player in the global low migration inks and coatings market. The market is driven by strict food-safety regulations and consumer demand for safe pharmaceutical and cosmetic packaging.
Other Companies in the Market
- Epple Druckfarben
- Flint Group
- Huber Group
- INX International
- Marabu GmbH
- Siegwerk Druckfarben
- Sun Chemical
- Toyo Inks
- HAPA AG
Segments Covered in the Report
By Printing Process
- Flexography
- Water-Based Flexographic Inks
- UV Flexographic Inks
- Solvent-Based Flexographic Inks
- Digital
- UV Inkjet Inks
- Water-Based Digital Inks
- Electrophotographic Inks
- Offset
- Sheetfed Offset Inks
- UV Offset Inks
- Conventional Offset Inks
- Gravure
- Solvent-Based Gravure Inks
- Water-Based Gravure Inks
- Specialty Gravure Inks
By End Use
- Food and Beverage
- Flexible Food Packaging
- Beverage Labels
- Cartons & Folding Boxes
- Dairy Packaging
- Pharmaceuticals
- Blister Packaging
- Medical Device Packaging
- Pharmaceutical Labels
- Personal Care
- Cosmetic Packaging
- Hygiene Product Packaging
- Premium Labels
- Other End Use
- Pet Food Packaging
- Household Products
- Industrial Packaging
By Region
- North America
- U.S.
- Canada
- Europe
- Germany
- UK
- France
- Italy
- Spain
- Sweden
- Denmark
- Norway
- Asia Pacific
- China
- Japan
- India
- South Korea
- Thailand
- Latin America
- Brazil
- Mexico
- Argentina
- Middle East & Africa
- South Africa
- UAE
- Saudi Arabia
- Kuwait
A Seven-Phase Framework
Our methodology is designed to be universally applicable across commodity chemicals, specialty chemicals, petrochemicals, construction chemicals, coatings, electronic chemicals, industrial gases, agrochemicals, water treatment chemicals, and performance materials. Each phase builds upon the last, creating a layered validation structure that minimizes estimation error and maximizes analytical confidence.
The framework ensures comprehensive market coverage, robust cross-validation, and reliable long-term forecasting — producing market estimates that withstand scrutiny from investors, regulators, and corporate strategy teams.

Seven-Phase Framework — Analytical Effort Distribution
Relative analytical effort allocated across each phase of the Chemicals & Materials research framework

Phase 1 - Secondary Research: Establishing the Foundation
Secondary research collects and evaluates publicly available information from authoritative sources, establishing the foundational understanding of market structure, value chain dynamics, competitive landscape, and end-use demand patterns. Every source is evaluated for credibility, recency, geographic relevance, and methodological soundness before inclusion.
Industry Associations
Sources include ACC, CEFIC, ICCA, JCIA, CPCIF, and SOCMA providing production volumes, consumption trends, capacity developments, and sustainability initiatives.
Company Disclosures
Annual reports, investor presentations, earnings transcripts, and regulatory filings reveal product portfolios, manufacturing footprints, capacity expansions, and revenue segmentation.
Government Databases
National statistical offices, customs authorities, environmental agencies, and industrial production databases provide verified statistics on output, trade flows, and regulatory compliance.
Trade Databases
UN Comtrade, ITC, Eurostat, and national customs authorities enable assessment of global product movement, import dependency, and export competitiveness across regions.
Our Secondary Research Sources
- Ministry of Chemicals and Fertilizers
- European Chemicals Agency
- United States Department of Energy
- Ministry of Industry and Information Technology
- Ministry of Economy Trade and Industry
- Ministry of Trade Industry and Energy
- National Institute of Standards and Technology
- Council of Scientific and Industrial Research
- Fraunhofer Society
- National Institute for Materials Science
Phase 2 — Supply-Side Assessment: Mapping Production Capabilities
Production Capacity Analysis
All major manufacturers are assessed for existing installed capacity, planned additions, expansions, new plant announcements, and technology adoption — mapped at global, regional, and country levels.
Capacity Utilization Adjustment
Installed capacity is adjusted using utilization rates based on demand conditions, feedstock availability, plant operating rates, maintenance schedules, and regulatory restrictions.
Manufacturer Revenue Analysis
Product-specific revenues, segment-level performance, regional distribution, average selling prices, and margin trends are evaluated to establish market value estimates.
Supply-Side Assessment — Capacity vs. Effective Production by Region
Illustrative comparison of installed capacity vs. effective production volume (after utilization rate adjustment) across major regions

Phase 3 — Demand-Side Assessment: Quantifying Chemical Consumption
Demand-side analysis quantifies chemical consumption across industries, applications, and geographies — identifying where and how chemicals are consumed throughout the value chain with precision.
End-Use Industry Analysis
Chemical demand is evaluated across automotive, construction, packaging, electronics, agriculture, healthcare, consumer goods, industrial manufacturing, energy and utilities, and water treatment. Industry output, production trends, and consumption intensity are analyzed to determine demand patterns.
Consumption Modeling
Demand is estimated using measurable indicators: kilograms per vehicle, kilograms per square meter of construction, dosage per cubic meter of water treated, kilograms per hectare of agricultural land, and kilograms per ton of manufactured products. Consumption factors are validated through industry publications and primary interviews.
Application Analysis
The market is segmented by application area to understand product performance requirements, formulation trends, technology adoption, customer preferences, and regulatory requirements improving demand accuracy and segmentation granularity.
Demand-Side Assessment — End-Use Industry Demand Distribution
Illustrative distribution of chemical & materials demand across key end-use industries

Phase 4 - Trade Flow Analysis: Balancing Regional Supply and Demand
Trade flow analysis reconciles regional supply and demand estimates through import and export data, identifying net supply positions, regional dependencies, and market imbalances. It serves as an independent validation layer that tests the consistency of supply-side and demand-side estimates.
Import Analysis
Import data is evaluated to determine volumes, source countries, product dependency, regional supply gaps, and pricing trends — identifying markets that rely heavily on external supply and where domestic production is insufficient to meet demand.
Export Analysis
Export assessments reveal production surplus, export competitiveness, regional manufacturing strength, and global market participation. Export patterns also help validate domestic production estimates and identify net exporting regions.
Apparent Consumption Model
Regional consumption is assessed using the standard apparent consumption formula:
Results identify net importing regions, net exporting regions, regional deficits, and surpluses — serving as an independent validation of supply and demand estimates.
Trade Flow Analysis — Net Supply Position by Region
Illustrative apparent consumption vs. domestic production across major regions — positive gap indicates net import dependency

Phase 5 — Primary Research: The Critical Validation Layer
Primary research tests and refines findings from secondary research through direct engagement with industry participants across the supply chain, demand side, and expert community. It captures intelligence that no database or published report can provide — the real-world experience of manufacturers, buyers, and specialists operating in the market.

Supply-Side Interviews
Conversations with chemical manufacturers, raw material suppliers, contract manufacturers, technology providers, and plant operators cover production trends, capacity utilization, pricing developments, technology shifts, and competitive dynamics.

Demand-Side Interviews
Engagement with OEMs, industrial consumers, procurement managers, distributors, formulators, and end-use manufacturers focuses on consumption trends, purchasing behavior, product substitution, demand outlook, and emerging applications.

Industry Expert Consultations
Additional interviews with industry consultants, independent experts, regulatory specialists, technical professionals, and research institutions provide deeper market context and validate key analytical assumptions.
Focus Areas of Primary Research:
Market Size & Forecast Validation
Revenue estimates, volume consumption, growth rates, forecast assumptions, regional demand.Supply Chain & Value Chain Assessment
Raw material sourcing, supply chain challenges, distribution networks, procurement practices.Production & Capacity Analysis
Manufacturing capacity, utilization rates, expansion projects, plant investments.Pricing & Cost Structure Analysis
Product pricing trends, feedstock costs, energy costs, margin pressures, pricing outlook.Competitive Landscape Assessment
Volume and value estimates confirmed to be fully consistent with one another before publicationInterview Volume by Market Scope
| Study Scope | Number of Interviews |
|---|---|
| Niche Market | 20 – 30 |
| Mid-Sized Market | 30 – 50 |
| Global Market | 50 – 80 |
| Highly Fragmented Market | 80 – 120 |
Interview Details:
Category : Manufacturers, Suppliers, Distributors, End Users, Experts/Associations
Average Duration : 30–60 Minutes
Interview Mode : Video calls, telephonic interviews, expert consultations
Interview Format : Structured / Semi-Structured questionnaire
Focus Areas of Primary Research:
Market Size & Forecast Validation :
Revenue estimates, volume consumption, growth rates, forecast assumptions, regional demand.
Supply Chain & Value Chain Assessment :
Raw material sourcing, supply chain challenges, distribution networks, procurement practices.
Production & Capacity Analysis :
Manufacturing capacity, utilization rates, expansion projects, plant investments.
Pricing & Cost Structure Analysis :
Product pricing trends, feedstock costs, energy costs, margin pressures, pricing outlook.
Competitive Landscape Assessment :
Market share, competitor positioning, strategic initiatives, partnerships, acquisitions.
Primary Research — Stakeholder Coverage by Category
Distribution of interview respondents across stakeholder categories (% share from PPT data)

Primary Research — Respondent Designation Profile
Seniority breakdown of interview respondents (% share from PPT data)

Primary Research — Geographic Coverage of Interviews
Regional distribution of primary research engagement (% share from PPT data)

Phase 6 — Data Triangulation and Market Validation
No single methodology is relied upon in isolation. Multiple independent estimation approaches are combined and reconciled to ensure consistency, accuracy, and analytical defensibility. Any material deviations between approaches are investigated and adjusted through additional validation cycles.
The final market size is derived through weighted triangulation of all validated methodologies. Any material deviations between approaches are investigated and adjusted through additional validation cycles. The outcome represents the most realistic assessment of the market based on available evidence and expert confirmation ensuring that volume and value estimates are fully consistent with one another.
Triangulation Framework — Input Contribution Weight
Relative weight each sizing input contributes to the final reconciled market estimate

Phase 7 — Forecast Modeling: Projecting Future Market Evolution
Forecasting evaluates the future trajectory of the market using a combination of quantitative indicators and qualitative assessments across economic, industry, and regulatory dimensions. Rather than simple extrapolation, each driver is independently modeled and integrated into a composite forecast.
Macroeconomic Indicators
GDP growth, industrial production, manufacturing output, construction activity, consumer spending, and capital investment form the quantitative foundation of long-term demand projections. These are applied at country, regional, and global levels.
Industry Growth Drivers
Urbanization, infrastructure development, industrialization, technological innovation, sustainability initiatives, and evolving product performance requirements are assessed at regional and industry levels — capturing both structural and cyclical demand drivers.
Capacity Expansion Analysis
Announced plant expansions, new manufacturing facilities, technology upgrades, and strategic investments are evaluated to determine future supply-demand dynamics and potential market tightness or oversupply situations.
Regulatory & Sustainability
Environmental regulations, chemical safety standards, emission reduction targets, circular economy initiatives, and sustainability requirements are incorporated as they often influence product adoption rates and market growth trajectories.
Scenario Forecast Range — Indexed Market Growth (Year 1–10)
Illustrative indexed growth trajectories across Base, Optimistic, and Pessimistic scenarios over a 10-year forecast horizon

Forecast Drivers — Relative Impact Score by Category
Impact score (0–100) of each driver type on chemicals & materials market forecast




Comments
Share your thoughts, ask a question, or provide feedback about this report.