
Europe Water and Wastewater Treatment Market Size Analysis Report 2035
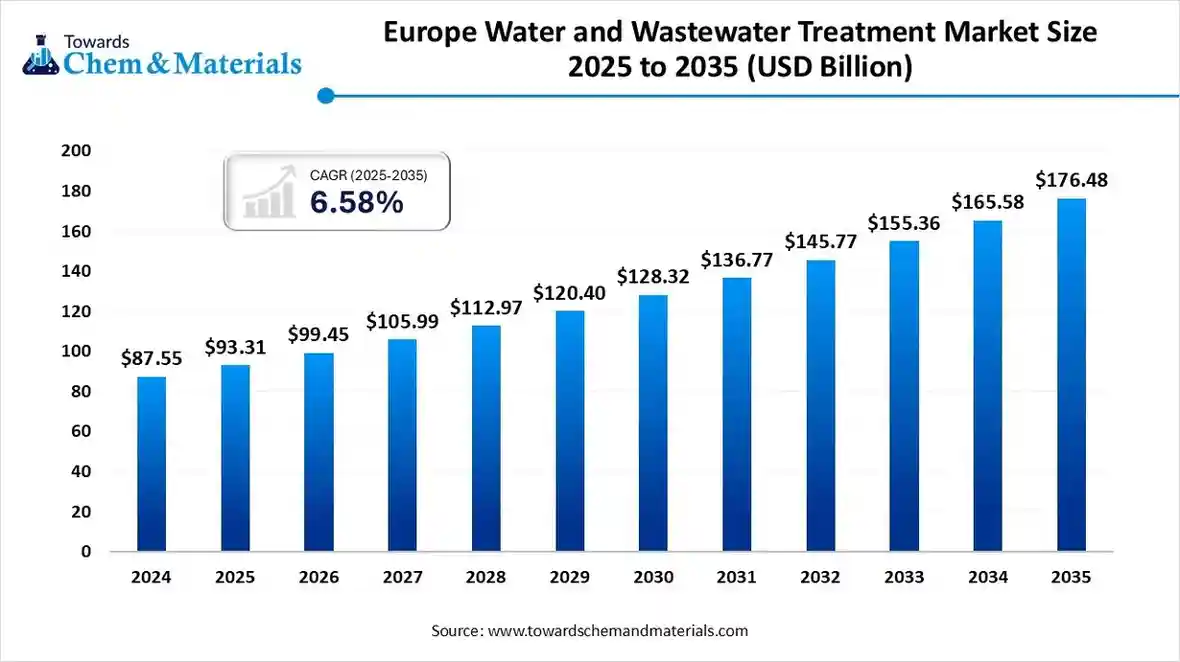
The Europe water and wastewater treatment market size is estimated at USD 93.31 billion in 2025, is projected to grow to USD 99.45 billion in 2026, and is expected to reach around USD 176.48 billion by 2035. The market is expanding at a CAGR of 6.58% between 2025 and 2035. The growth of the market is driven due to growing demand from both industrial and residential applications, which fuels the growth of the market.
Key Takeaways
- By type, the wastewater treatment segment dominated the market with a share of 74.1% in 2024.
- By type, the water treatment segment is expected to grow significantly in the market during the forecast period.
- By technology, the membrane separation segment dominated the market with a share of 36.5% in 2024.
- By technology, the biological treatment segment is expected to grow in the forecast period.
- By application, the municipal segment dominated the market with a share of 70.9% in 2024.
- By application, the industrial segment is expected to grow in the forecast period.
- By end-use industry, the power generation segment dominated the market with a share of 42.2% in 2024.
- By end-use industry, the pharmaceutical segment is expected to grow in the forecast period.
Market Overview
What Is The Significance Of The Europe Water And Wastewater Treatment Market?
The Europe water and wastewater treatment market focuses on technologies and systems that purify water and treat wastewater for safe discharge or reuse. The market is driven by stringent EU environmental directives, industrial growth, and urbanisation. Increasing investment in circular water economies, smart water networks, and advanced treatment technologies supports sustainability goals. Additionally, the growing emphasis on reducing water pollution, conserving resources, and upgrading municipal infrastructure further fuels demand across both industrial and residential applications in the European region.
Europe Water and Wastewater Treatment Market Outlook:
- Industry Growth Overview: Between 2025 and 2034, the Europe water and wastewater treatment market is projected to grow steadily, driven by ageing infrastructure upgrades, stricter EU wastewater directives, and increasing industrial and municipal water reuse initiatives. Demand is rising from sectors such as power generation, pharmaceuticals, and food & beverage, alongside municipal utilities aiming to meet circular water economy goals.
- Sustainability Trends: Sustainability is shaping the market through growing emphasis on energy-efficient, low-chemical, and resource-recovery-based treatment systems. Utilities are adopting advanced biological treatment, membrane filtration, and sludge-to-energy technologies to minimise environmental impact.
- Regional Expansion & Innovation: Major global and regional players are investing in decentralised and modular treatment systems to improve access and resilience. Strategic partnerships between technology providers, EPC firms, and municipalities are fostering innovation in smart wastewater networks and nutrient recovery systems.
Report Scope
| Report Attributes | Details |
| Market Size in 2026 | USD 99.45 Billion |
| Expected Size by 2034 | USD 176.48 Billion |
| Growth Rate from 2025 to 2034 | CAGR 6.58% |
| Base Year of Estimation | 2024 |
| Forecast Period | 2025 - 2034 |
| Segment Covered | By Type, By Technology, By Application, By End-Use Industry, |
| Key Companies Profiled | Siemens Water Technologies, Grundfos Holding A/S, Acciona Agua, Jacobs Solutions Inc., Veolia Environnement S.A. , Xylem Inc. , Ecolab Inc. , Kemira Oyj , Kurita Water Industries Ltd. , BASF SE , Pentair plc , Aqualia S.A. , Aquatech International LLC , WABAG Water Technology Ltd. , DuPont Water Solutions , Trojan Technologies , Thames Water Utilities Limited , Lenntech B.V |
Key Technological Shifts In The Europe Water and Wastewater Treatment Market:
Key technological shifts in the European water and wastewater treatment market include digitalisation and smart systems, advanced treatment processes like membrane bioreactors and advanced oxidation, a move towards decentralised systems, and a focus on the circular economy and resource recovery. These changes are driven by strict regulations, the need for efficiency, sustainability, and tackling issues like emerging contaminants such as PFAS.
Trade Analysis Of the Europe Water and Wastewater Treatment Market: Import & Export Statistics
- From October 2023 to September 2024 (TTM), the European Union demonstrated significant global trade activity in water treatment plants, dispatching a total of 66,333 shipments. This extensive export volume involved 9,016 individual EU exporters successfully supplying 6,811 unique international buyers during that one year.
Most of the Water Treatment Plants exported from the European Union go to Ukraine, Kazakhstan, and Vietnam. - Globally, the top three exporters of Water Treatment Plants are China, Vietnam, and the United States. China leads the world in Water Treatment Plants exports with 4,691,627 shipments, followed by Vietnam with 2,633,896 shipments, and the United States taking the third spot with 1,276,402 shipments.
- From October 2023 to September 2024, worldwide exports of wastewater treatment equipment totalled 530 shipments. These shipments were conducted by 250 exporters and delivered to 252 buyers. This represents a 26% growth rate compared to the preceding year.
- Most of the Wastewater Treatment Equipment exports from the World go to Vietnam, Russia, and Uzbekistan.
- Globally, the top three exporters of Wastewater Treatment Equipment are China, Vietnam, and Turkey. China leads the world in Wastewater Treatment Equipment exports with 405 shipments, followed by Vietnam with 104 shipments, and Turkey taking the third spot with 100 shipments.
Europe Water and Wastewater Treatment Market -- Value Chain Analysis
- Chemical Synthesis and Processing :Water and wastewater treatment in Europe involves physical, chemical, and biological processes such as coagulation, flocculation, filtration, membrane separation, and disinfection to ensure clean and reusable water for industrial and municipal applications.
- Key players : Veolia Environnement S.A., SUEZ Water Technologies & Solutions, Xylem Inc., Ecolab Inc., Kemira Oyj
- Quality Testing and Certification : Treated water quality is assessed for pH, turbidity, total dissolved solids (TDS), and microbial contamination under the EU Water Framework Directive, ISO 14001, and EN standards.
- Key players: SGS, Bureau Veritas, TÜV Rheinland, Intertek.
- Distribution to Industrial Users : Water and wastewater treatment solutions are distributed to municipalities, industrial plants, power generation, and food & beverage sectors through direct contracts and service agreements.
- Key players: Veolia Environnement S.A., SUEZ Water Technologies & Solutions, Xylem Inc., Ecolab Inc.
Europe Water and Wastewater Treatment Regulatory Landscape: Global Regulations
| Country / Region | Regulatory Body | Key Regulations / Frameworks | Focus Areas | Notable Notes |
| European Union (Overall Framework) | European Commission (DG Environment) European Environment Agency (EEA) |
- Urban Waste Water Treatment Directive (UWWTD, 91/271/EEC) - Water Framework Directive (WFD, 2000/60/EC) - Drinking Water Directive (DWD, 2020/2184/EU) - Industrial Emissions Directive (IED, 2010/75/EU) - Circular Economy Action Plan (2020) |
- Wastewater collection & treatment - Water quality & ecological status - Industrial effluent standards - Reuse & resource recovery - Microplastics & PFAS management |
The UWWTD and WFD are the backbone of EU water law. The revised UWWTD (2024 update) mandates energy neutrality and nutrient removal by 2040. The DWD ensures safer drinking water through PFAS and microplastic limits. |
| Germany | Federal Environment Agency (UBA) Federal Water Act (WHG) |
- Abwasserverordnung (Wastewater Ordinance) - WHG (Federal Water Act) - EU Directives (transposed nationally) |
- Industrial effluent discharge - Nutrient removal - Water reuse & sludge management |
Germany enforces some of Europe’s strictest discharge standards. Nutrient removal (N, P) and tertiary treatment are mandatory for most municipal plants. |
| France | Ministry for Ecological Transition (MTE) Water Agencies (Agences de l’Eau) |
- French Environmental Code (L211–L218) - Grenelle Laws - REUSE Decree (2022-336) |
- Water reuse for irrigation/industry - Discharge & effluent monitoring - River basin management |
France recently approved non-potable water reuse for irrigation and urban uses. Basin-based management promotes integrated river restoration and reuse projects. |
| United Kingdom | Environment Agency (EA) Ofwat (Regulator) DEFRA |
- Environmental Permitting (England & Wales) Regulations, 2016 - Water Industry Act, 1991 - Environment Act, 2021 |
- Effluent discharge licensing - Combined sewer overflow (CSO) reduction - Stormwater management - PFAS monitoring |
The Environment Act (2021) strengthens enforcement of discharge permits and mandates real-time CSO monitoring. Focus on reducing stormwater pollution and microplastics. |
| Italy | Ministry of Environment and Energy Security (MASE) ISPRA (Environmental Institute) |
- Legislative Decree No. 152/2006 (Environmental Code) - EU WFD & UWWTD transposition |
- Effluent quality standards - Reuse for agriculture - Water recycling targets |
Italy promotes wastewater reuse in agriculture under strict microbiological limits. New regulations align with EU Circular Economy objectives. |
| Spain | Ministry for Ecological Transition (MITECO) River Basin Authorities (Confederaciones Hidrográficas) |
- Royal Decree 1620/2007 (Reuse Regulation) - National Water Plan (2022 update) |
- Reuse in agriculture and industry - River basin water allocation - Wastewater reuse permits |
Spain is a leader in water reuse, with over 400 plants operating under Royal Decree 1620/2007. The Canary Islands and Murcia are major reuse hubs. |
| Netherlands | Rijkswaterstaat (Ministry of Infrastructure and Water Management) | - Water Act (2009) - EU Water Framework & Bathing Water Directives |
- Flood protection & water quality - Industrial wastewater control - Nutrient recovery (phosphorus) |
The Netherlands integrates water reuse with flood control. Focus on nutrient recovery from sludge and smart digital water systems. |
Segmental Insights
Type Insights
How Did the Wastewater Treatment Segment Dominated The Europe Water And Wastewater Treatment Market In 2024?
- The wastewater treatment segment dominated the market with a share of 74.1% in 2024. The wastewater treatment segment holds a significant share of the European market due to growing concerns about water pollution and stricter EU environmental directives. Municipalities and industries are investing in advanced treatment plants to meet discharge regulations. Increasing adoption of biological and membrane-based systems for nutrient removal and water recycling is further propelling segment growth across the region.
- The water treatment segment expects significant growth in the Europe water and wastewater treatment market during the forecast period. The water treatment segment continues to expand, driven by the rising demand for potable and process water across urban and industrial areas. Adoption of smart monitoring and membrane filtration technologies supports water purification and desalination initiatives. Government programs emphasising sustainable water management and the rehabilitation of old treatment infrastructure are fostering steady growth in this segment.
Technology Insights
Which Technology Segment Dominated The Europe Water And Wastewater Treatment Market In 2024?
- The membrane separation segment dominated the market with a share of 36.5% in 2024. Membrane separation dominates the market owing to its high efficiency in removing suspended solids, bacteria, and dissolved contaminants. The growing deployment of reverse osmosis (RO) and ultrafiltration (UF) systems in industrial and municipal applications enhances operational sustainability. Technological innovations improving membrane lifespan and energy efficiency are further boosting adoption across European treatment facilities.
- The biological treatment segment expects significant growth in the Europe water and wastewater treatment market during the forecast period. The biological treatment segment is gaining momentum due to the widespread use of activated sludge, MBRs, and biofilters for municipal wastewater. Stringent EU wastewater discharge norms are prompting plants to upgrade conventional systems to biological-based solutions. The technology’s eco-friendly nature and efficiency in treating organic pollutants contribute to its growing use across urban utilities.
- The disinfection segment has seen notable growth in the market. The disinfection segment is witnessing steady growth as municipalities and industries prioritise pathogen-free water supply. UV and ozone-based disinfection methods are increasingly replacing chemical-based chlorine systems for environmental and safety reasons. The segment benefits from continuous technological improvements that ensure effective microbial control and lower operating costs in both water and wastewater facilities.
Application Insights
How Did the Municipal Segment Dominated The Europe Water And Wastewater Treatment Market In 2024?
- The municipal segment dominated the market with a share of 70.9% in 2024. The municipal segment leads the market due to increasing investments in urban water infrastructure and population growth. EU directives on safe drinking water and wastewater discharge are driving the modernisation of municipal treatment facilities.
- Expansion of smart water networks and public–private partnerships further strengthens market demand for efficient, compliant water management systems.
- The industrial segment expects significant growth in the Europe water and wastewater treatment market during the forecast period. The industrial segment is expanding rapidly, fueled by stringent industrial effluent discharge standards and the need for water reuse.
- Key industries such as chemicals, power, and pharmaceuticals are adopting membrane, ion-exchange, and biological technologies to minimise environmental impact. Rising awareness about sustainable operations and cost savings from water recycling continues to support market growth.
End Use Industry Insights
Which End-Use Industry Segment Dominated The Europe Water And Wastewater Treatment Market In 2024?
- The power generation segment dominated the market with a share of 42.2% in 2024. Power generation represents a key end-use industry, as large volumes of ultrapure water are required for cooling and boiler feed. Water treatment solutions such as reverse osmosis and ion-exchange are critical to maintaining plant efficiency. The shift toward sustainable energy sources and retrofitting of thermal power plants is enhancing demand for high-quality water treatment systems.
- The pharmaceutical segment expects significant growth in the Europe water and wastewater treatment market during the forecast period. The pharmaceutical segment is growing due to strict GMP standards mandating ultra-pure water for drug formulation and production. Advanced purification systems ensure compliance with
- European Pharmacopoeia standards. Rising biologics manufacturing and R&D activities are further supporting the adoption of validated water and wastewater treatment technologies in this sector.
- The chemical segment has seen notable growth in the market. The chemical industry contributes significantly to market demand, driven by its intensive water usage and strict effluent control requirements. Adoption of zero-liquid discharge (ZLD) systems and hybrid membrane solutions is increasing to minimise waste and environmental impact. Continuous investments in sustainable chemical processing are further expanding treatment infrastructure in this segment.
Country Insights
Germany: Europe Water And Wastewater Treatment Market Trends
Germany leads the market owing to advanced infrastructure, stringent environmental policies, and heavy industrial activity. The country’s focus on decentralised wastewater systems, membrane innovation, and industrial water reuse supports ongoing market expansion. Strong regulatory frameworks under the German Water Act continue to encourage the adoption of energy-efficient, sustainable technologies across sectors.
Spain: Europe Water And Wastewater Treatment Market Analysis
Spain’s market is characterised by increasing investments in desalination and wastewater reuse to address water scarcity issues. The government’s focus on sustainable water management in arid regions drives infrastructure upgrades. Adoption of advanced membrane and disinfection systems in both municipal and agricultural sectors is expanding, supported by EU funding and regional water reuse initiatives.
United Kingdom (UK): Europe Water And Wastewater Treatment Market Modernisation Trends
The UK market benefits from the modernisation of ageing water networks and regulatory mandates under Ofwat and the Environment Agency. Rising urbanisation, coupled with industrial expansion, drives demand for smart water treatment and monitoring technologies. Utilities are increasingly adopting automation, biological treatment, and advanced filtration systems to enhance operational efficiency and meet water quality targets.
Recent Developments
- In June 2025, the European Commission's Joint Research Centre (JRC) and the European University Institute (EUI) launched the European Water Academy to train policymakers and support evidence-based decision-making. Announced in June 2025 as part of the European Water Resilience Strategy, the Academy aims to foster a water-smart economy in Europe.(Source: joint-research-centre.ec.europa.eu )
- In June 2025, Veolia is expanding its leadership in hazardous waste treatment through major investments, targeting 530,000 tonnes of new annual capacity by 2030 via acquisitions and organic growth. The company has also launched its new patented Drop technology in Europe, designed for high-efficiency destruction of targeted PFAS using incineration.(Source: www.veolia.com)
- In December 2024, Veolia Water Technologies launched new mobile water services in Europe specifically for the pharmaceutical, cosmetics, and life science sectors, offering rental solutions for purified water, pure steam, and complex liquid waste treatment. These services provide compliant, reliable, and sustainable water management without requiring significant capital expenditure from customers. (Source: www.watermagazine.co.uk)
Top Players in the Europe Water and Wastewater Treatment Market & Their Offerings:
SUEZ SA
Corporate Information
- SUEZ is a French multinational company, active in water management, wastewater treatment, recycling and wasteâ€toâ€energy solutions.
- Headquarters: 16 Place de l’Iris (Tour CB21), 92400 Courbevoie, France.
- Following a major shareholding restructuring, in 2022 SUEZ was acquired by a consortium of shareholders (including Meridiam, Global Infrastructure Partners (GIP) and the French publicâ€investment group Caisse des Dépôts).
History and Background
- The group’s roots trace back over 160 years in providing essential services in water and waste sectors.
- The current entity SUEZ SA emerged after a major corporate transaction: the consortium acquisition and change in ownership in January 2022.
Key Developments and Strategic Initiatives
- 2022 Strategic Plan (to 2027): SUEZ set out a strategy focusing on its two core business lines Water and Waste (Recycling & Recovery). It emphasises geographic expansion (UK, Italy, China, India, Middle East & Africa), digital & innovation investment, and sustainable solutions.
- Organizational Redesign (March 2023): SUEZ announced a new structure with two operational divisions (Water; Recycling & Recovery) and three cross-group units (Engineering & Construction; Digital Solutions; Innovation) to deliver its strategy.
Mergers & Acquisitions
- In the context of its 2027 plan, SUEZ has made several acquisitions to strengthen its positions: e.g., acquisition of
- IWS (Industrial Waste Specialties) in France, EnviroServ in South Africa (waste management), and SUEZ R&R in the UK (waste recycling & recovery).
- The takeover by the shareholder consortium in January 2022 (Meridiam/GIP/CDC) marks a significant ownership change for the business.
Partnerships & Collaborations
- In September 2024, SUEZ signed a Memorandum of Understanding (MoU) with Siemens and TAQA (Abu Dhabi
- National Energy Company) for a five-year global desalination initiative (the “Mohamed bin Zayed Water Initiative”), aimed at developing innovative, affordable desalination solutions in emerging countries.
- In Asia, SUEZ secured projects in Singapore, China and the Philippines focusing on seawater desalination, water reuse and digital platforms (via the AQUADVANCED® Water Networks analytics) in partnership with local agencies.
Product Launches / Innovations
- SUEZ leverages its AQUADVANCED® Water Networks digital platform (smart water grid analytics) to support large municipal operations (e.g., Singapore’s national water agency).
- The group is active in large-scale wastewater and waterâ€treatment contracts (e.g., a major wastewater treatment plant in India, noted in its 2027 strategic plan) and is innovating in leak detection, network digitalization and circular economy solutions.
Key Technology Focus Areas
- Circular economy: converting waste into resources (energy, materials) and water reuse.
- Digitalization & smart infrastructure: network analytics, smart metering, predictive maintenance, connected water/waste networks.
- Emerging market expansion & water scarcity solutions: desalination, reuse, wastewater treatment in fast-growing geographies.
R&D Organisation & Investment
- Under its 2027 strategic plan, SUEZ committed to increasing its dedicated research & development budget by more than 50% compared to the previous period.
- SUEZ’s new organization (March 2023) includes a cross-group “Innovation” unit to coordinate R&D, enhancing synergy between digital, engineering, and core business units.
SWOT Analysis
Strengths
- Strong brand and legacy in water and waste management across many geographies, combining both municipal and industrial markets.
- Balanced business model across two major segments (Water; Recycling & Recovery) plus global expansion strategy.
- Digital capabilities and innovation orientation (smart water networks, circular economy) providing differentiation.
- Clear strategic focus toward sustainability and resource scarcity solutions, aligning with global trends.
Weaknesses
- Operating in highly regulated and capital-intensive sectors (water utilities, waste infrastructure) which can limit flexibility.
- Dependency on public-sector contracts and infrastructure investment cycles, which may be volatile or subject to political risk.
- The transformations (organizational, strategic) may take time to yield results, and the increased investment burden may impact short-term profitability.
Opportunities
- Growth in emerging markets (Asia, Middle East, Africa) where water scarcity and waste-management needs are rising rapidly.
- Demand for desalination, water reuse and smart network solutions is increasing, providing new growth avenues.
- Circular economy and waste-to-energy markets present significant expansion potential, especially with policy tailwinds for decarbonisation.
- Digitalization of utility infrastructure offers platform business models and higher-margin service offerings.
Threats
- Fierce competition in water & waste sector from large incumbents and niche players, especially in emerging markets.
- Regulatory risk (changes in waste or water policy, tariffs, environmental standards) could affect investment returns.
- Macro-economic or public-sector investment slow-downs could reduce contract opportunities.
- Execution risk: large infrastructure projects carry cost, schedule, and regulatory risks; heavy investment increases exposure.
Recent News & Strategic Updates
- In June 2024, SUEZ won three new water projects in Asia (Singapore, China, Philippines) focused on digital water networks and seawater desalination/water reuse.
- In September 2024, SUEZ, Siemens and TAQA signed a MoU around desalination innovation for emerging countries.
- In March 2023, SUEZ announced its organizational restructure (two core divisions + three cross-group units) to deliver its strategy.
Other Top Players Are
- Siemens Water Technologies: Provides automation and process control systems for water and wastewater treatment facilities. Siemens integrates digital solutions such as IoT-based water management, SCADA systems, and energy-efficient process optimisation technologies.
- Grundfos Holding A/S: Specialises in water pumping and fluid handling systems used in wastewater treatment plants and distribution networks. Grundfos emphasises energy-efficient and digitally connected pump technologies for smart water infrastructure.
- Acciona Agua: Offers EPC (engineering, procurement, and construction) services for water and wastewater treatment plants, including desalination and reuse facilities. Acciona integrates renewable energy in water infrastructure projects across Europe.
- Jacobs Solutions Inc.: Provides consulting, design, and EPC services for municipal water infrastructure, wastewater treatment, and smart utility management systems across Europe.
- Veolia Environnement S.A.
- Xylem Inc.
- Ecolab Inc.
- Kemira Oyj
- Kurita Water Industries Ltd.
- BASF SE
- Pentair plc
- Aqualia S.A.
- Aquatech International LLC
- WABAG Water Technology Ltd.
- DuPont Water Solutions
- Trojan Technologies
- Thames Water Utilities Limited
- Lenntech B.V
Segments Covered:
By Type
- Water Treatment
- Wastewater Treatment
By Technology
- Membrane Separation
- Biological Treatment
- Disinfection
- Sludge Treatment
- Filtration
- Others
By Application
- Municipal
- Industrial
By End-Use Industry
- Power Generation
- Food & Beverage
- Chemical
- Pharmaceutical
- Oil & Gas
- Pulp & Paper
- Others
A Seven-Phase Framework
Our methodology is designed to be universally applicable across commodity chemicals, specialty chemicals, petrochemicals, construction chemicals, coatings, electronic chemicals, industrial gases, agrochemicals, water treatment chemicals, and performance materials. Each phase builds upon the last, creating a layered validation structure that minimizes estimation error and maximizes analytical confidence.
The framework ensures comprehensive market coverage, robust cross-validation, and reliable long-term forecasting — producing market estimates that withstand scrutiny from investors, regulators, and corporate strategy teams.

Seven-Phase Framework — Analytical Effort Distribution
Relative analytical effort allocated across each phase of the Chemicals & Materials research framework

Phase 1 - Secondary Research: Establishing the Foundation
Secondary research collects and evaluates publicly available information from authoritative sources, establishing the foundational understanding of market structure, value chain dynamics, competitive landscape, and end-use demand patterns. Every source is evaluated for credibility, recency, geographic relevance, and methodological soundness before inclusion.
Industry Associations
Sources include ACC, CEFIC, ICCA, JCIA, CPCIF, and SOCMA providing production volumes, consumption trends, capacity developments, and sustainability initiatives.
Company Disclosures
Annual reports, investor presentations, earnings transcripts, and regulatory filings reveal product portfolios, manufacturing footprints, capacity expansions, and revenue segmentation.
Government Databases
National statistical offices, customs authorities, environmental agencies, and industrial production databases provide verified statistics on output, trade flows, and regulatory compliance.
Trade Databases
UN Comtrade, ITC, Eurostat, and national customs authorities enable assessment of global product movement, import dependency, and export competitiveness across regions.
Our Secondary Research Sources
- Ministry of Chemicals and Fertilizers
- European Chemicals Agency
- United States Department of Energy
- Ministry of Industry and Information Technology
- Ministry of Economy Trade and Industry
- Ministry of Trade Industry and Energy
- National Institute of Standards and Technology
- Council of Scientific and Industrial Research
- Fraunhofer Society
- National Institute for Materials Science
Phase 2 — Supply-Side Assessment: Mapping Production Capabilities
Production Capacity Analysis
All major manufacturers are assessed for existing installed capacity, planned additions, expansions, new plant announcements, and technology adoption — mapped at global, regional, and country levels.
Capacity Utilization Adjustment
Installed capacity is adjusted using utilization rates based on demand conditions, feedstock availability, plant operating rates, maintenance schedules, and regulatory restrictions.
Manufacturer Revenue Analysis
Product-specific revenues, segment-level performance, regional distribution, average selling prices, and margin trends are evaluated to establish market value estimates.
Supply-Side Assessment — Capacity vs. Effective Production by Region
Illustrative comparison of installed capacity vs. effective production volume (after utilization rate adjustment) across major regions

Phase 3 — Demand-Side Assessment: Quantifying Chemical Consumption
Demand-side analysis quantifies chemical consumption across industries, applications, and geographies — identifying where and how chemicals are consumed throughout the value chain with precision.
End-Use Industry Analysis
Chemical demand is evaluated across automotive, construction, packaging, electronics, agriculture, healthcare, consumer goods, industrial manufacturing, energy and utilities, and water treatment. Industry output, production trends, and consumption intensity are analyzed to determine demand patterns.
Consumption Modeling
Demand is estimated using measurable indicators: kilograms per vehicle, kilograms per square meter of construction, dosage per cubic meter of water treated, kilograms per hectare of agricultural land, and kilograms per ton of manufactured products. Consumption factors are validated through industry publications and primary interviews.
Application Analysis
The market is segmented by application area to understand product performance requirements, formulation trends, technology adoption, customer preferences, and regulatory requirements improving demand accuracy and segmentation granularity.
Demand-Side Assessment — End-Use Industry Demand Distribution
Illustrative distribution of chemical & materials demand across key end-use industries

Phase 4 - Trade Flow Analysis: Balancing Regional Supply and Demand
Trade flow analysis reconciles regional supply and demand estimates through import and export data, identifying net supply positions, regional dependencies, and market imbalances. It serves as an independent validation layer that tests the consistency of supply-side and demand-side estimates.
Import Analysis
Import data is evaluated to determine volumes, source countries, product dependency, regional supply gaps, and pricing trends — identifying markets that rely heavily on external supply and where domestic production is insufficient to meet demand.
Export Analysis
Export assessments reveal production surplus, export competitiveness, regional manufacturing strength, and global market participation. Export patterns also help validate domestic production estimates and identify net exporting regions.
Apparent Consumption Model
Regional consumption is assessed using the standard apparent consumption formula:
Results identify net importing regions, net exporting regions, regional deficits, and surpluses — serving as an independent validation of supply and demand estimates.
Trade Flow Analysis — Net Supply Position by Region
Illustrative apparent consumption vs. domestic production across major regions — positive gap indicates net import dependency

Phase 5 — Primary Research: The Critical Validation Layer
Primary research tests and refines findings from secondary research through direct engagement with industry participants across the supply chain, demand side, and expert community. It captures intelligence that no database or published report can provide — the real-world experience of manufacturers, buyers, and specialists operating in the market.

Supply-Side Interviews
Conversations with chemical manufacturers, raw material suppliers, contract manufacturers, technology providers, and plant operators cover production trends, capacity utilization, pricing developments, technology shifts, and competitive dynamics.

Demand-Side Interviews
Engagement with OEMs, industrial consumers, procurement managers, distributors, formulators, and end-use manufacturers focuses on consumption trends, purchasing behavior, product substitution, demand outlook, and emerging applications.

Industry Expert Consultations
Additional interviews with industry consultants, independent experts, regulatory specialists, technical professionals, and research institutions provide deeper market context and validate key analytical assumptions.
Focus Areas of Primary Research:
Market Size & Forecast Validation
Revenue estimates, volume consumption, growth rates, forecast assumptions, regional demand.Supply Chain & Value Chain Assessment
Raw material sourcing, supply chain challenges, distribution networks, procurement practices.Production & Capacity Analysis
Manufacturing capacity, utilization rates, expansion projects, plant investments.Pricing & Cost Structure Analysis
Product pricing trends, feedstock costs, energy costs, margin pressures, pricing outlook.Competitive Landscape Assessment
Volume and value estimates confirmed to be fully consistent with one another before publicationInterview Volume by Market Scope
| Study Scope | Number of Interviews |
|---|---|
| Niche Market | 20 – 30 |
| Mid-Sized Market | 30 – 50 |
| Global Market | 50 – 80 |
| Highly Fragmented Market | 80 – 120 |
Interview Details:
Category : Manufacturers, Suppliers, Distributors, End Users, Experts/Associations
Average Duration : 30–60 Minutes
Interview Mode : Video calls, telephonic interviews, expert consultations
Interview Format : Structured / Semi-Structured questionnaire
Focus Areas of Primary Research:
Market Size & Forecast Validation :
Revenue estimates, volume consumption, growth rates, forecast assumptions, regional demand.
Supply Chain & Value Chain Assessment :
Raw material sourcing, supply chain challenges, distribution networks, procurement practices.
Production & Capacity Analysis :
Manufacturing capacity, utilization rates, expansion projects, plant investments.
Pricing & Cost Structure Analysis :
Product pricing trends, feedstock costs, energy costs, margin pressures, pricing outlook.
Competitive Landscape Assessment :
Market share, competitor positioning, strategic initiatives, partnerships, acquisitions.
Primary Research — Stakeholder Coverage by Category
Distribution of interview respondents across stakeholder categories (% share from PPT data)

Primary Research — Respondent Designation Profile
Seniority breakdown of interview respondents (% share from PPT data)

Primary Research — Geographic Coverage of Interviews
Regional distribution of primary research engagement (% share from PPT data)

Phase 6 — Data Triangulation and Market Validation
No single methodology is relied upon in isolation. Multiple independent estimation approaches are combined and reconciled to ensure consistency, accuracy, and analytical defensibility. Any material deviations between approaches are investigated and adjusted through additional validation cycles.
The final market size is derived through weighted triangulation of all validated methodologies. Any material deviations between approaches are investigated and adjusted through additional validation cycles. The outcome represents the most realistic assessment of the market based on available evidence and expert confirmation ensuring that volume and value estimates are fully consistent with one another.
Triangulation Framework — Input Contribution Weight
Relative weight each sizing input contributes to the final reconciled market estimate

Phase 7 — Forecast Modeling: Projecting Future Market Evolution
Forecasting evaluates the future trajectory of the market using a combination of quantitative indicators and qualitative assessments across economic, industry, and regulatory dimensions. Rather than simple extrapolation, each driver is independently modeled and integrated into a composite forecast.
Macroeconomic Indicators
GDP growth, industrial production, manufacturing output, construction activity, consumer spending, and capital investment form the quantitative foundation of long-term demand projections. These are applied at country, regional, and global levels.
Industry Growth Drivers
Urbanization, infrastructure development, industrialization, technological innovation, sustainability initiatives, and evolving product performance requirements are assessed at regional and industry levels — capturing both structural and cyclical demand drivers.
Capacity Expansion Analysis
Announced plant expansions, new manufacturing facilities, technology upgrades, and strategic investments are evaluated to determine future supply-demand dynamics and potential market tightness or oversupply situations.
Regulatory & Sustainability
Environmental regulations, chemical safety standards, emission reduction targets, circular economy initiatives, and sustainability requirements are incorporated as they often influence product adoption rates and market growth trajectories.
Scenario Forecast Range — Indexed Market Growth (Year 1–10)
Illustrative indexed growth trajectories across Base, Optimistic, and Pessimistic scenarios over a 10-year forecast horizon

Forecast Drivers — Relative Impact Score by Category
Impact score (0–100) of each driver type on chemicals & materials market forecast




Comments
Share your thoughts, ask a question, or provide feedback about this report.