
Ethylene Oxide (EO) Market Size Analysis Report 2035
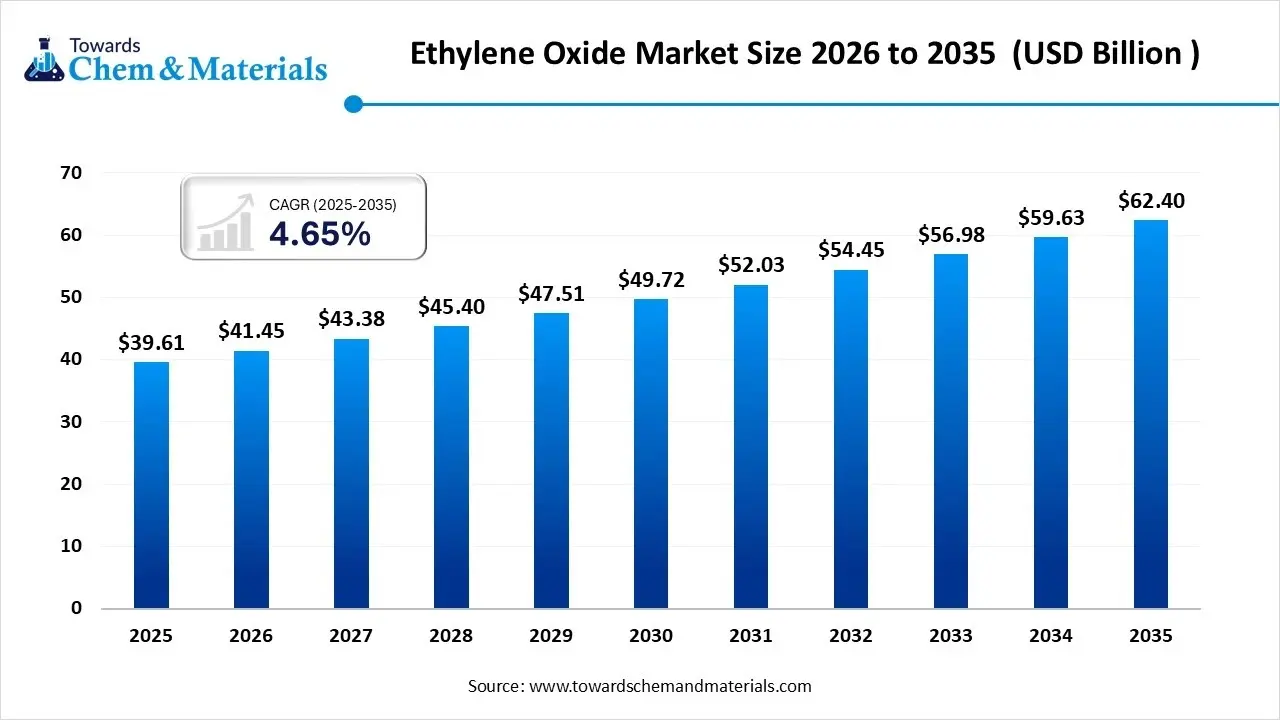
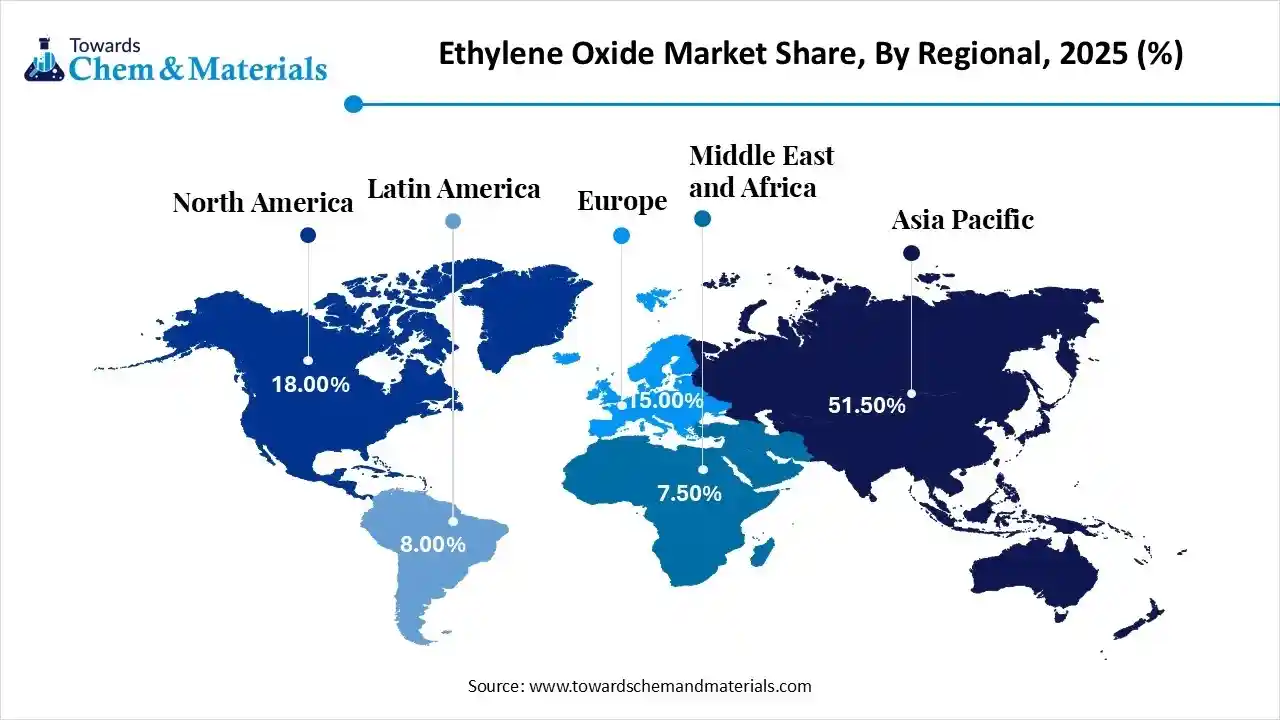
The global ethylene oxide (EO) market size was estimated at USD 39.61 billion in 2025 and is expected to increase from USD 41.45 billion in 2026 to USD 62.40 billion by 2035, growing at a CAGR of 4.65% from 2026 to 2035. Asia Pacific dominated the ethylene oxide (EO) market with the largest revenue share of 51.50% in 2025. The stable demand for everyday usage products has fueled the industry's growth in recent years.
Market Highlights
- The Asia Pacific dominated the ethylene oxide (EO) market with the largest revenue share of 50.5% in 2025, due to strong industrial growth, large population, and high demand for textiles, packaging, and chemicals.
- By derivative type, the ethylene glycols segment dominated the market and accounted for the largest revenue share of 75% in 2025,owing to they are widely used in daily life products.
- By application, the polyester fiber & PET resins segment led the market with the largest revenue share of 28% in 2025,as they are used in clothing, packaging, and plastic bottles.
- By feedstock, the petro-based ethylene segment dominated the market and accounted for the largest revenue share of 95.5% in 2025,owing to its being widely available and easy to produce from crude oil and natural gas.
Ethylene Oxide Powering Modern Industries
The common chemical gas, which is primarily used as a building block to produce every product called ethylene oxide. Moreover, the growing demand for detergents, antifreeze, textiles, and plastics is positively impacting the revenue potential and industry scalability of ethylene oxide nowadays. Also, ethylene oxide has been used to sterilize medical equipment in the past few years.
Market Recent Trends:
- The emergence of sterilisation and healthcare products is actively creating profitable pathways for the sector participants in the current period. Also, the major healthcare companies have observed using ethylene oxide gas to sterilize medical equipment, including surgical tools, syringes, and packaging materials.
- The greater integration into the development of everyday products is supporting economic activity and capital growth of industry nowadays. Furthermore, ethylene oxide is used to produce ethylene glycol, which is a key element in the production of antifreeze and polyester fibres.
- The sudden shift towards clean and safer production is expected to improve financial performance and sectoral scalability during the forecast period. Moreover, as ethylene oxide was detected as a hazardous chemical, the manufacturers are trying to produce with cleaner and ecofriendly methods in recent years.
Report Scope
| Report Attribute | Details |
| Market Size and Volume in 2026 | USD 41.45 Billion |
| Revenue Forecast in 2035 | USD 62.40 Billion |
| Growth Rate | CAGR 4.65% |
| Forecast Period | 2026 - 2035 |
| Base Year | 2025 |
| Dominant Region | Asia Pacific |
| Segment Covered | By Derivative, By Application, By Feedstock, By Region |
| Key companies profiled | Dow, SABIC, Shell plc, BASF SE, Sinopec, INEOS Oxide, Indorama Ventures, Formosa Plastics Corporation, LyondellBasell Industries, Reliance Industries Limited, Nippon Shokubai Co., Ltd., Lotte Chemical Corporation, Huntsman International LLC, India Glycols Limited (IGL), Clariant |
Smart Automation Boosts Manufacturing Returns
The use of advanced automation and digital monitoring systems has been expected to increase return on investment for manufacturers in recent years. Also, modern plants use sensors and data systems to control temperature, pressure, and chemical reactions more accurately. This helps improve safety and reduce waste. Predictive maintenance is also being used to prevent equipment failure before it happens.
Trade Analysis of the Ethylene Oxide (EO) Market:
Import, Export, Consumption, and Production Statistics
- The global exporter has heavily exported ethylene oxide with 1,205 shipments between Jul 2024 and June 2025, via 191 buyers, and 172 exporters have been reported as per the published report.
Also, Costa Rica has exported one of the leading amounts of ethylene oxide with 909 shipments, while India with 512 shipments, and United States 852 shipments. - Also, the leading importers included Belgium with 889 shipments and Vietnam with 385, and United States with 374 shipments in the earlier days.
Value Chain Analysis of the Ethylene Oxide (EO) Market:
Distribution to Industrial Users
- Industrial users receive Ethylene Oxide (EO) primarily through direct pipelines or specialized railcars and tankers, as its high reactivity makes long-distance transport complex.
- Key global producers and distributors include BASF, Dow Chemical, SABIC, Shell, and Indorama Ventures.
Chemical Synthesis and Processing
- Chemical synthesis of Ethylene Oxide (EO) primarily utilizes the silver-catalyzed direct oxidation of ethylene. This high-efficiency process reacts ethylene with oxygen at elevated temperatures and pressures to ensure maximum yield.
- Key Players: Scientific Design and Shell
Regulatory Compliance and Safety Monitoring
- Regulatory compliance for Ethylene Oxide (EO) is governed by stringent standards due to its toxicity and flammability.
- In the U.S., the EPA enforces the Clean Air Act, specifically the National Emission Standards for Hazardous Air Pollutants (NESHAP), while OSHA sets the Permissible Exposure Limit (PEL) at 1 ppm. Globally, the ECHA manages REACH regulations.
- Key monitoring entities and industry leaders like Steris, Sotera Health, and 3M implement rigorous leak detection and sterilization safety protocols.
Ethylene Oxide (EO) Market Regulatory Landscape: Global Regulations
| Country Region | Regulatory Body | Key Regulations | Focus Areas |
| United States | Environmental Protection Agency (EPA) | Clean Air Act (CAA) Section 112: Governs the National Emission Standards for Hazardous Air Pollutants (NESHAP). | Reducing "fugitive emissions" from sterilization facilities, protecting communities near plants, and implementing rigorous medical surveillance for exposed workers. |
| European Union | European Chemicals Agency (ECHA) | REACH Regulation (EC) No 1907/2006: Classified as a Category 1B carcinogen and mutagen; restricted under Annex XVII for supply to the general public | Total ban in food additives, strict residue monitoring in imported spices/seeds, and transition of sterilization oversight to the Medical Device Regulation (MDR) |
| China | Ministry of Ecology and Environment (MEE) | GBZ 2.1-2019: Sets the Occupational Exposure Limit (OEL) for EO at 2 mg/m³ (~1.1 ppm) for an 8-hour TWA. | Industrial safety in large-scale chemical manufacturing (China is a top global producer), strict control over residual EO in exported medical textiles |
Segmental Insights
Derivative Type Insights
How did the Ethylene Glycols Segment Dominate the Ethylene Oxide (EO) Market in 2025?
The ethylene glycols segment dominated the market with approximately to 75% share in 2025, because they are widely used in daily life products. They are mainly used to make antifreeze, coolants, and polyester materials for clothing and plastic bottles. The demand is very high from the textile and packaging industries. Ethylene glycols are easy to produce and cost-effective, which makes them popular.
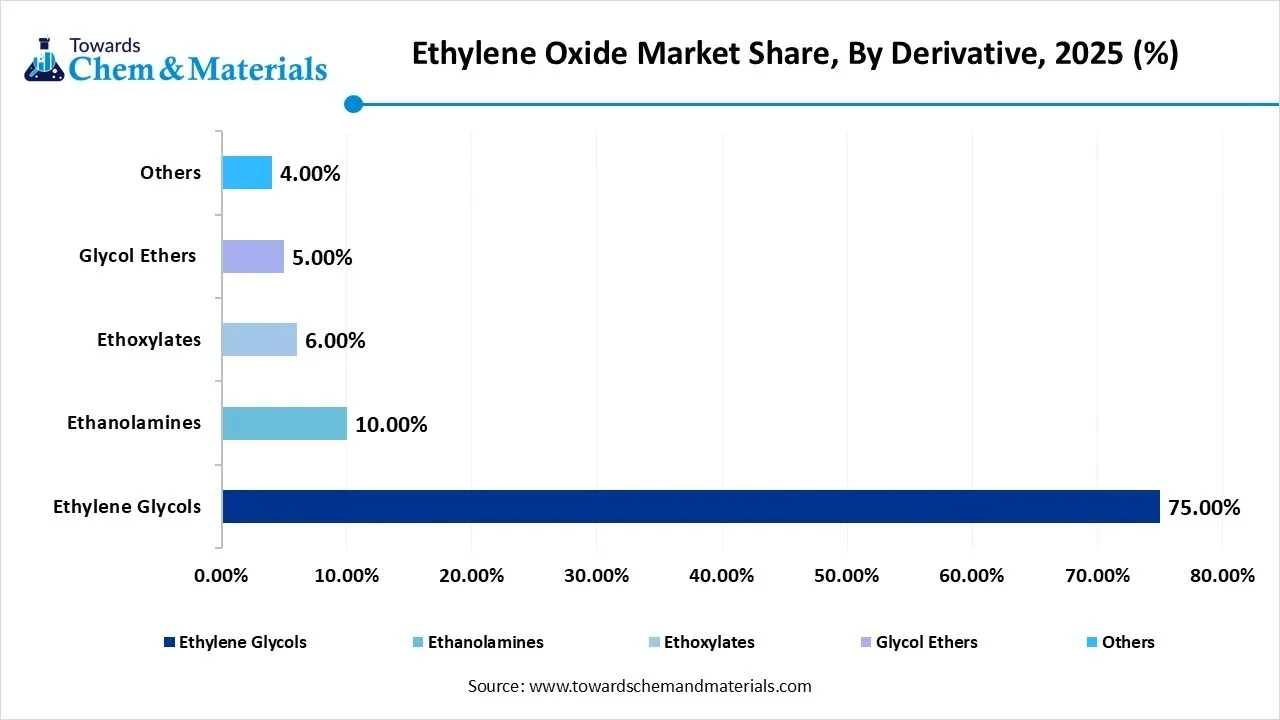
The ethanolamines segment is expected to grow with a rapid CAGR, owing to they are used in many growing industries like agriculture, personal care, and gas treatment. They help remove harmful gases in industries, making them important for environmental safety. They are also used in detergents, cosmetics, and herbicides. As environmental rules become stricter, demand for ethanolamines will increase.
Ethylene Oxide Market Share, By Derivative, 2025 (%)
| By Derivative | Revenue Share, 2025 (%) |
| Ethylene Glycols | 75.00% |
| Ethanolamines | 10.00% |
| Ethoxylates | 6.00% |
| Glycol Ethers | 5.00% |
| Others | 4.00% |
Application Insights
How did the Polyester Fiber & PET Resins Dominate the Ethylene Oxide (EO) Market in 2025?
The polyester fiber & PET resins segment dominated the market with 28% share in 2025, because they are used in clothing, packaging, and plastic bottles. These products are part of everyday life, so demand is very high. PET is lightweight, strong, and recyclable, making it popular in packaging. Polyester fibres are widely used in the textile industry. Another reason is low production cost and easy processing. The rise of recycled PET, where used bottles are turned into new fibres and packaging is driving the industry nowadays.
The medical sterilization segment is expected to grow, akin to ethylene oxide is very effective in killing bacteria and viruses. It is widely used to sterilize medical equipment like syringes, surgical tools, and packaging. Many devices cannot be sterilized with heat, so ethylene oxide is the best option. Demand is increasing due to growing healthcare needs worldwide in the current period.
Ethylene Oxide Market Share, By Application, 2025 (%)
| By Application | Revenue Share, 2025 (%) |
| Polyester Fiber & PET Resins | 28.00% |
| Medical Sterilization | 20.00% |
| Antifreeze & Coolants | 15.00% |
| Detergents & Personal Care | 12.00% |
| Agrochemicals & Others | 25.00% |
Feedstock Insights
How did the Petro-based Ethylene Segment Dominate the Ethylene Oxide (EO) Market in 2025?
The petro-based ethylene segment dominated the market with 95.5% share in 2025, due to its being widely available and easy to produce from crude oil and natural gas. The infrastructure for petrochemicals is already well developed, making production efficient and cost-effective. Industries depend on stable and large-scale supply, which petro-based sources provide. The existing global supply chains have provided a sophisticated consumer base to the industry.
The bio-based ethylene segment is expected to grow with a rapid CAGR, owing to industries moving towards sustainability and reducing carbon emissions. Governments are supporting green chemicals through policies and incentives. Companies want to reduce their environmental impact, so they are shifting to bio-based materials in the current period.
Ethylene Oxide Market Share,By Feedstock, 2025 (%)
| By Feedstock | Revenue Share, 2025 (%) |
| Petro-based Ethylene | 95.50% |
| Bio-based Ethylene | 4.50% |
Regional Insights
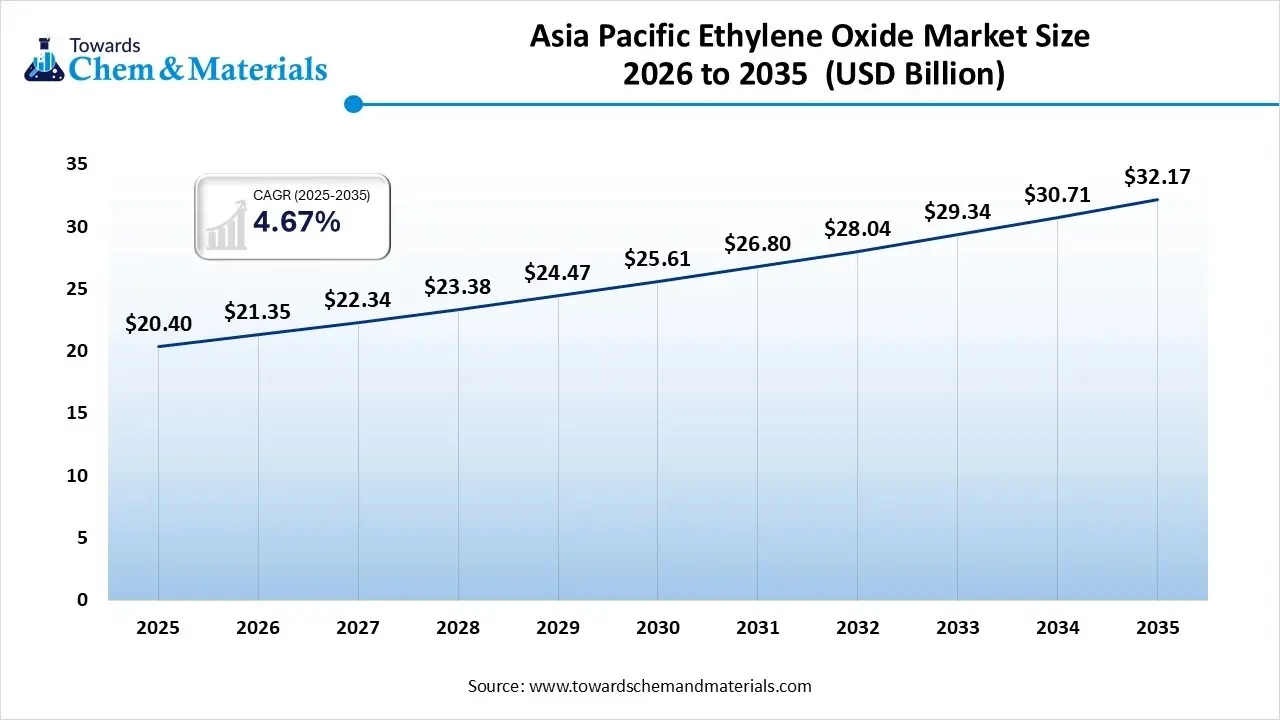
The Asia Pacific ethylene oxide (EO) market size was valued at USD 20.40 billion in 2025 and is expected to be worth around USD 32.17 billion by 2035, exhibiting at a compound annual growth rate (CAGR) of 5.27% over the forecast period from 2026 to 2035.Asia Pacific dominated the ethylene oxide (EO) market with approximately 50.5% share in 2025, due to strong industrial growth, large population, and high demand for textiles, packaging, and chemicals.
Countries in this region have large manufacturing bases and lower production costs. The demand for PET bottles and polyester fibres is very high. Governments also support industrial development. Another reason is the availability of raw materials and labor. Many companies in the region are building integrated chemical plants in this region, reducing costs and improving efficiency as per the recent observation.
China’s Polyester Demand Drives Growth
China maintained its dominance in the market, owing to its massive manufacturing sector and high demand for polyester and packaging materials. The country produces large volumes of ethylene oxide and its derivatives. Government policies support industrial growth and recycling initiatives. China also leads in textile production, increasing demand for ethylene glycol. The development of green chemical plants using renewable energy, where the companies are also focusing on recycling PET waste into new materials in the country.
Ethylene Oxide (EO) Market Evaluation in North America
The North America dominated the ethylene oxide with the largest revenue share of 18.00% in 2025. North America is expected to capture a major share of the ethylene oxide (EO) market with a rapid CAGR, owing to advanced technology, strong research, and strict environmental regulations. Companies are investing in sustainable chemicals and carbon reduction technologies. The region also has strong demand from healthcare and packaging industries. Innovation plays a key role in market growth. Also, the focus is on carbon capture and bio-based chemicals, while the regional companies are seen shifting towards the development of new methods to produce ethylene oxide with lower emissions.
Advanced Manufacturing Fuels the Ethylene Oxide (EO) Market in the United States
The United States is expected to emerge as a prominent country for the ethylene oxide (EO) market in the coming years, due to its strong chemical industry and advanced infrastructure. The country has a high demand for ethylene oxide in healthcare, packaging, and automotive sectors. Many companies are investing in new technologies and sustainable production methods. Government regulations encourage cleaner processes. The use of digital technologies to optimize chemical production and reduce waste has driven industry’s growth.
Europe Ethylene Oxide (EO) Market Examination
The Europe dominated the ethylene oxide market with the largest revenue share of 18.00% in 2025. Europe is notably growing in the market, owing to strong environmental policies and a focus on sustainability. Governments are reducing plastic waste and promoting recycling. Companies are investing in eco-friendly chemicals and materials. Consumers also prefer sustainable products, increasing demand. Another reason is innovation in green chemistry. The greater push for carbon neutrality, which is driving the use of bio-based ethylene nowadays.
Ethylene Oxide Market Share, By Regional, 2025 (%)
| Regional | Revenue Share, 2025 (%) |
| North America | 18.00% |
| Europe | 15.00% |
| Asia Pacific | 51.50% |
| Latin America | 8.00% |
| Middle East & Africa | 7.50% |
Germany Driving Sustainable Industrial Growth
Germany is expected to gain a significant industry share owing to its strong industrial and chemical sectors. The country focuses on high-quality production and sustainability. German companies invest heavily in research and green technologies. Government policies support environmental protection and innovation. A unique trend is the development of bio-based and recyclable materials for industrial use. Germany also leads in advanced manufacturing and automation, improving efficiency.
Recent Developments
- In May 2024, L&T completed the delivery of the ethylene oxide reactor to China, which is claimed as it is worlds heaviest ethylene oxide reactor. Also, this reactor has relied on BASF’s developed technology as per published report.(Source: www.indianchemicalnews.com)
Top Vendors in the Ethylene Oxide (EO) Market & Their Offerings:
- Dow: As the largest U.S.-based producer, Dow leverages massive vertical integration to dominate the Ethylene Oxide market. It utilizes high-purity EO primarily for downstream production of surfactants, performance plastics, and industrial intermediates.
- SABIC: Saudi Basic Industries Corporation is a Middle Eastern powerhouse and a global leader in diversified chemicals. By utilizing vast regional feedstock advantages, SABIC produces EO at a massive scale, primarily as a precursor for glycols and polyester.
- Shell plc: A pioneer in EO production, Shell is renowned for its proprietary OMEGA technology, which offers high-purity yields with minimal energy consumption. The company operates significant manufacturing hubs globally, integrating EO production into their broader energy and chemical portfolio to supply the automotive, detergent, and pharmaceutical industries worldwide.
- BASF SE: This German chemical giant focuses on the "Verbund" integration model, using Ethylene Oxide to create high-value specialty derivatives. BASF’s production is tailored for sophisticated applications, including home care, nutrition, and crop protection.
- Sinopec
- INEOS Oxide
- Indorama Ventures
- Formosa Plastics Corporation
- LyondellBasell Industries
- Reliance Industries Limited
- Nippon Shokubai Co., Ltd.
- Lotte Chemical Corporation
- Huntsman International LLC
- India Glycols Limited (IGL)
- Clariant
Segments Covered in the Report
By Derivative
- Ethylene Glycols
- Ethanolamines
- Ethoxylates
- Glycol Ethers & Others
By Application
- Polyester Fiber & PET Resins
- Medical Sterilization
- Antifreeze & Coolants
- Detergents & Personal Care
- Agrochemicals & Others
By Feedstock
- Petro-based Ethylene
- Bio-based Ethylene
By Region
- North America
- U.S.
- Canada
- Mexico
- Europe
- Germany
- UK
- France
- Italy
- Spain
- Asia Pacific
- China
- India
- Japan
- South Korea
- Latin America
- Brazil
- Argentina
- Middle East & Africa
- Saudi Arabia
- South Africa
A Seven-Phase Framework
Our methodology is designed to be universally applicable across commodity chemicals, specialty chemicals, petrochemicals, construction chemicals, coatings, electronic chemicals, industrial gases, agrochemicals, water treatment chemicals, and performance materials. Each phase builds upon the last, creating a layered validation structure that minimizes estimation error and maximizes analytical confidence.
The framework ensures comprehensive market coverage, robust cross-validation, and reliable long-term forecasting — producing market estimates that withstand scrutiny from investors, regulators, and corporate strategy teams.

Seven-Phase Framework — Analytical Effort Distribution
Relative analytical effort allocated across each phase of the Chemicals & Materials research framework

Phase 1 - Secondary Research: Establishing the Foundation
Secondary research collects and evaluates publicly available information from authoritative sources, establishing the foundational understanding of market structure, value chain dynamics, competitive landscape, and end-use demand patterns. Every source is evaluated for credibility, recency, geographic relevance, and methodological soundness before inclusion.
Industry Associations
Sources include ACC, CEFIC, ICCA, JCIA, CPCIF, and SOCMA providing production volumes, consumption trends, capacity developments, and sustainability initiatives.
Company Disclosures
Annual reports, investor presentations, earnings transcripts, and regulatory filings reveal product portfolios, manufacturing footprints, capacity expansions, and revenue segmentation.
Government Databases
National statistical offices, customs authorities, environmental agencies, and industrial production databases provide verified statistics on output, trade flows, and regulatory compliance.
Trade Databases
UN Comtrade, ITC, Eurostat, and national customs authorities enable assessment of global product movement, import dependency, and export competitiveness across regions.
Our Secondary Research Sources
- Ministry of Chemicals and Fertilizers
- European Chemicals Agency
- United States Department of Energy
- Ministry of Industry and Information Technology
- Ministry of Economy Trade and Industry
- Ministry of Trade Industry and Energy
- National Institute of Standards and Technology
- Council of Scientific and Industrial Research
- Fraunhofer Society
- National Institute for Materials Science
Phase 2 — Supply-Side Assessment: Mapping Production Capabilities
Production Capacity Analysis
All major manufacturers are assessed for existing installed capacity, planned additions, expansions, new plant announcements, and technology adoption — mapped at global, regional, and country levels.
Capacity Utilization Adjustment
Installed capacity is adjusted using utilization rates based on demand conditions, feedstock availability, plant operating rates, maintenance schedules, and regulatory restrictions.
Manufacturer Revenue Analysis
Product-specific revenues, segment-level performance, regional distribution, average selling prices, and margin trends are evaluated to establish market value estimates.
Supply-Side Assessment — Capacity vs. Effective Production by Region
Illustrative comparison of installed capacity vs. effective production volume (after utilization rate adjustment) across major regions

Phase 3 — Demand-Side Assessment: Quantifying Chemical Consumption
Demand-side analysis quantifies chemical consumption across industries, applications, and geographies — identifying where and how chemicals are consumed throughout the value chain with precision.
End-Use Industry Analysis
Chemical demand is evaluated across automotive, construction, packaging, electronics, agriculture, healthcare, consumer goods, industrial manufacturing, energy and utilities, and water treatment. Industry output, production trends, and consumption intensity are analyzed to determine demand patterns.
Consumption Modeling
Demand is estimated using measurable indicators: kilograms per vehicle, kilograms per square meter of construction, dosage per cubic meter of water treated, kilograms per hectare of agricultural land, and kilograms per ton of manufactured products. Consumption factors are validated through industry publications and primary interviews.
Application Analysis
The market is segmented by application area to understand product performance requirements, formulation trends, technology adoption, customer preferences, and regulatory requirements improving demand accuracy and segmentation granularity.
Demand-Side Assessment — End-Use Industry Demand Distribution
Illustrative distribution of chemical & materials demand across key end-use industries

Phase 4 - Trade Flow Analysis: Balancing Regional Supply and Demand
Trade flow analysis reconciles regional supply and demand estimates through import and export data, identifying net supply positions, regional dependencies, and market imbalances. It serves as an independent validation layer that tests the consistency of supply-side and demand-side estimates.
Import Analysis
Import data is evaluated to determine volumes, source countries, product dependency, regional supply gaps, and pricing trends — identifying markets that rely heavily on external supply and where domestic production is insufficient to meet demand.
Export Analysis
Export assessments reveal production surplus, export competitiveness, regional manufacturing strength, and global market participation. Export patterns also help validate domestic production estimates and identify net exporting regions.
Apparent Consumption Model
Regional consumption is assessed using the standard apparent consumption formula:
Results identify net importing regions, net exporting regions, regional deficits, and surpluses — serving as an independent validation of supply and demand estimates.
Trade Flow Analysis — Net Supply Position by Region
Illustrative apparent consumption vs. domestic production across major regions — positive gap indicates net import dependency

Phase 5 — Primary Research: The Critical Validation Layer
Primary research tests and refines findings from secondary research through direct engagement with industry participants across the supply chain, demand side, and expert community. It captures intelligence that no database or published report can provide — the real-world experience of manufacturers, buyers, and specialists operating in the market.

Supply-Side Interviews
Conversations with chemical manufacturers, raw material suppliers, contract manufacturers, technology providers, and plant operators cover production trends, capacity utilization, pricing developments, technology shifts, and competitive dynamics.

Demand-Side Interviews
Engagement with OEMs, industrial consumers, procurement managers, distributors, formulators, and end-use manufacturers focuses on consumption trends, purchasing behavior, product substitution, demand outlook, and emerging applications.

Industry Expert Consultations
Additional interviews with industry consultants, independent experts, regulatory specialists, technical professionals, and research institutions provide deeper market context and validate key analytical assumptions.
Focus Areas of Primary Research:
Market Size & Forecast Validation
Revenue estimates, volume consumption, growth rates, forecast assumptions, regional demand.Supply Chain & Value Chain Assessment
Raw material sourcing, supply chain challenges, distribution networks, procurement practices.Production & Capacity Analysis
Manufacturing capacity, utilization rates, expansion projects, plant investments.Pricing & Cost Structure Analysis
Product pricing trends, feedstock costs, energy costs, margin pressures, pricing outlook.Competitive Landscape Assessment
Volume and value estimates confirmed to be fully consistent with one another before publicationInterview Volume by Market Scope
| Study Scope | Number of Interviews |
|---|---|
| Niche Market | 20 – 30 |
| Mid-Sized Market | 30 – 50 |
| Global Market | 50 – 80 |
| Highly Fragmented Market | 80 – 120 |
Interview Details:
Category : Manufacturers, Suppliers, Distributors, End Users, Experts/Associations
Average Duration : 30–60 Minutes
Interview Mode : Video calls, telephonic interviews, expert consultations
Interview Format : Structured / Semi-Structured questionnaire
Focus Areas of Primary Research:
Market Size & Forecast Validation :
Revenue estimates, volume consumption, growth rates, forecast assumptions, regional demand.
Supply Chain & Value Chain Assessment :
Raw material sourcing, supply chain challenges, distribution networks, procurement practices.
Production & Capacity Analysis :
Manufacturing capacity, utilization rates, expansion projects, plant investments.
Pricing & Cost Structure Analysis :
Product pricing trends, feedstock costs, energy costs, margin pressures, pricing outlook.
Competitive Landscape Assessment :
Market share, competitor positioning, strategic initiatives, partnerships, acquisitions.
Primary Research — Stakeholder Coverage by Category
Distribution of interview respondents across stakeholder categories (% share from PPT data)

Primary Research — Respondent Designation Profile
Seniority breakdown of interview respondents (% share from PPT data)

Primary Research — Geographic Coverage of Interviews
Regional distribution of primary research engagement (% share from PPT data)

Phase 6 — Data Triangulation and Market Validation
No single methodology is relied upon in isolation. Multiple independent estimation approaches are combined and reconciled to ensure consistency, accuracy, and analytical defensibility. Any material deviations between approaches are investigated and adjusted through additional validation cycles.
The final market size is derived through weighted triangulation of all validated methodologies. Any material deviations between approaches are investigated and adjusted through additional validation cycles. The outcome represents the most realistic assessment of the market based on available evidence and expert confirmation ensuring that volume and value estimates are fully consistent with one another.
Triangulation Framework — Input Contribution Weight
Relative weight each sizing input contributes to the final reconciled market estimate

Phase 7 — Forecast Modeling: Projecting Future Market Evolution
Forecasting evaluates the future trajectory of the market using a combination of quantitative indicators and qualitative assessments across economic, industry, and regulatory dimensions. Rather than simple extrapolation, each driver is independently modeled and integrated into a composite forecast.
Macroeconomic Indicators
GDP growth, industrial production, manufacturing output, construction activity, consumer spending, and capital investment form the quantitative foundation of long-term demand projections. These are applied at country, regional, and global levels.
Industry Growth Drivers
Urbanization, infrastructure development, industrialization, technological innovation, sustainability initiatives, and evolving product performance requirements are assessed at regional and industry levels — capturing both structural and cyclical demand drivers.
Capacity Expansion Analysis
Announced plant expansions, new manufacturing facilities, technology upgrades, and strategic investments are evaluated to determine future supply-demand dynamics and potential market tightness or oversupply situations.
Regulatory & Sustainability
Environmental regulations, chemical safety standards, emission reduction targets, circular economy initiatives, and sustainability requirements are incorporated as they often influence product adoption rates and market growth trajectories.
Scenario Forecast Range — Indexed Market Growth (Year 1–10)
Illustrative indexed growth trajectories across Base, Optimistic, and Pessimistic scenarios over a 10-year forecast horizon

Forecast Drivers — Relative Impact Score by Category
Impact score (0–100) of each driver type on chemicals & materials market forecast




Comments
Share your thoughts, ask a question, or provide feedback about this report.