
Copper Products Market Size, Competitive Landscape Analysis Report 2035
The global copper products market size is calculated at USD 375.85 billion in 2025 and is predicted to increase from USD 397.09 billion in 2026 and is projected to reach around USD 651.19 billion by 2035, The market is expanding at a CAGR of 5.65% between 2026 and 2035. Asia Pacific dominated the copper products market with a market share of 75.55% the global market in 2025. The growth of the market is driven by the growing demand for copper from various industries, especially electronics and electricals, which drives the growth of the market.

The copper products market is crucial for modern infrastructure and technology, thanks to coppers excellent electrical and thermal conductivity, durability, and recyclability. Its growth is mainly fueled by the rise of renewable energy, electric vehicles (EVs), electronics, and large infrastructure projects such as smart cities. Additionally, improving living standards worldwide, especially in developing countries, boosts demand for copper as these regions develop more infrastructure and integrate new technologies.
Key Takeaway
- Asia Pacific dominated the global copper products market with the largest revenue share of 75.55% in 2025.
- The China copper products market is projected to grow during the forecast period.
- By type, the primary copper segment accounted for the largest revenue share of 84.8% in 2025.
- By product, the wire segment dominated with the largest revenue share of 61.7% in 2025.
- By end use, the building and construction segment dominated with the largest revenue share of 28.4% in 2025.
Copper Products Market Growth Trends:
- Electrification and Decarbonization: This is the single largest driver of copper demand. Coppers superior electrical conductivity makes it essential for renewable energy systems, electric vehicles, charging infrastructure, and modernising power grids.
- Urbanisation and Infrastructure Growth: Rapid industrialisation and population growth are fueling large-scale construction projects, smart city rollouts, and infrastructure expansion, which require vast amounts of copper wiring and pipes.
- Focus on Recycling: Due to the environmental impact of mining and declining ore grades in existing mines, copper recycling is a major trend. Recycling is energy-efficient and helps ensure raw material stability, aligning with sustainability goals.
- Technological Advancements: The proliferation of electronic devices, 5G networks, data centres, and Artificial Intelligence infrastructure is increasing demand for copper foils, strips, and wires in high-performance applications.
- Advancements in Copper Alloys: Innovations in copper alloy formulation and manufacturing are expanding their use in high-performance industries like marine, aerospace, and automotive due to enhanced durability and corrosion resistance.
Report Scope
| Report Attribute | Details |
| Market Size Value in 2026 | USD 397.09 Billion |
| Revenue Forecast in 2035 | USD 651.19 Billion |
| Growth Rate | CAGR 5.65% |
| Forecast Period | 2026 - 2035 |
| Base Year | 2025 |
| Dominant Region | Asia Pacific |
| Fastest Growing Region | Europe |
| Segments covered | By Type, By Product, By End Use, By Region |
| Key companies profiled | Aurubis AG (Germany), Jiangxi Copper Corporation, KME SE (Italy), Wieland Group (Germany), Mitsubishi Materials Corporation (Japan), KGHM Polska Miedz SA, Glencore BHP , Hindalco Industries Ltd. , Mueller Industries , Hailiang Group , Nexans , Codelco , Freeport-McMoRan , Southern Copper Corporation , Metropolitan Industries, Alara Resources Limited , National Iranian Copper Industries Company, Saudi Arabian Mining Company (Maaden), Nexa Resources, Oriental Copper , Sumitomo Metal Mining |
Key Technological Shifts In The Copper Products Market:
Key technological shifts in the copper products market are primarily driven by the transition to a green and digital economy, with major innovations in sustainable production, digitalisation, and advanced manufacturing. The global transition to electric vehicles and renewable energy sources is a primary driver of new copper technology applications.
Trade Analysis Of Copper Products Market: Import & Export Statistics
- According to Volzas Global Export data, the World exported 154,354 shipments of Copper products. These exports were made by 19,026 Exporters to 15,765 Buyers.
- Most of the Copper products exported from the World go to Vietnam, Russia, and the United States.
- Globally, the top three exporters of Copper products are Vietnam, China, and India. Vietnam leads the world in
- Copper Products exports with 47,542 shipments, followed by China with 45,685 shipments, and India taking the third spot with 19,467 shipments.
- According to Volzas Global Export data, the World exported 14,428 shipments of Copper Packages from Nov 2023 to Oct 2025 (TTM). These exports were made by 1,346 Exporters to 333 Buyers, marking a growth rate of -42% compared to the preceding twelve months
- Most of the Copper Packages exported from the World go to Malaysia, China, and India.
- Globally, the top three exporters of Copper Packages are the United States, Peru, and India. The United States leads the world in Copper Packages exports with 39,659 shipments, followed by Peru with 1,923 shipments, and India taking the third spot with 1,418 shipments.
Copper Products Market Value Chain Analysis
- Chemical Synthesis and Processing : Copper products are manufactured through processes such as mining & ore concentration, electrolytic refining, smelting, casting, extrusion, rolling, and drawing to produce wires, rods, sheets, tubes, and alloys. Surface finishing and heat treatment further enhance conductivity and durability.
- Key players: Aurubis AG, KME Group, Mitsubishi Materials Corporation, Wieland Group, Hindalco Industries Ltd.
- Quality Testing and Certification: Copper products undergo rigorous testing for electrical conductivity, tensile strength, corrosion resistance, and dimensional accuracy under standards like ASTM B152 (copper sheet/strip), ASTM B170 (refinery shapes), and ISO 9001.
- Key players: ASTM International, SGS, Intertek, TÜV SÜD.
- Distribution to Industrial Users : Copper products are distributed to electrical & electronics, construction, automotive, and HVAC industries through direct supply contracts, metal distributors, and OEM partnerships..
- Key players: Wieland Group, Aurubis AG, KME Group, Mitsubishi Materials Corporation.
Copper Products Regulatory Landscape: Global Regulations
| Region | Regulatory Body | Key Regulations | Focus Areas | Notable Notes |
| North America | U.S. EPA; OSHA; U.S. Dept. of Commerce; Mine Safety & Health Administration (MSHA); Environment and Climate Change Canada | - Clean Air Act (emissions controls) - Clean Water Act / NPDES (effluent limits) - RCRA (waste & spent catalyst) - TSCA (chemical substances in processing) - Canada: Fisheries Act & provincial mining/environment laws |
- Smelter/refinery emissions and effluent control - Worker health & safety in processing and fabrication - Scrap/recycling rules and hazardous by-product management - Trade & anti-dumping enforcement |
U.S. and Canada require strict air/waste permits for smelters and enforce strong workplace safety. Growing focus on domestic processing and supply-chain resilience. |
| Europe | European Commission / ECHA; National environment & mining authorities; CEN / ISO standards bodies | - REACH & CLP (chemical registration, hazard classification) - Industrial Emissions Directive (IED) - Waste Framework Directive & Circular Economy rules - National mine permitting & EIA requirements |
- Chemical/metal emissions and BAT for smelting - Product standards (electrical conductivity, alloys) and end-of-life recycling - Traceability and conflict-free sourcing (supply chain due diligence) |
EU places heavy emphasis on recycling targets, lifecycle EPDs, and restrictions on hazardous substances in alloys. IED/BAT decisions drive abatement tech investments. |
| Asia-Pacific | China MEE / SAC; India MoEFCC & Mines; Japan METI / JIS; Australia Dept. of Industry & State regulators | - China: GB product and emissions standards; MEE chemical/air rules - India: Mines & Minerals Acts, environmental clearance; BIS standards for wire/rod - Australia: EPBC Act & state mining approvals |
- Large share of refining & fabrication capacity in China - Local product/quality certification (GB / BIS / JIS) - Scrap processing, export/import controls and pollution control at clusters |
China dominates refining and downstream production; Indonesia/SE Asia is increasingly important for scrap and secondary processing. Environmental inspections and stricter emissions norms have raised compliance costs. |
| Latin America | Chile: Sernageomin / SMA; Peru: Ministry of Energy & Mines; Brazil: ANM / IBAMA | - National mining laws and concession frameworks - Environmental impact assessment (EIA) and water use regulations - Local product standards & export controls |
- Mining permitting and social / community consent - Water/tailings management and smelter emissions - Local value-addition policies (encouraging smelting/refining domestically) |
Chile and Peru are leading copper ore suppliers; national rules strongly influence global concentrate flows. Increased local value-add requirements and social licence to operate are material for project economics. |
| Middle East & Africa | South Africa: DMR / Department of Environment; DRC: Ministry of Mines; GCC: National Standards & Environment Agencies | - South Africa: Mining Charter / Occupational & environmental laws - DRC: Mining Code & export regulation (including traceability) - Regional hazardous waste and import/export controls |
- Artisanal & large-scale mining governance - Conflict-mineral due diligence (where relevant) - Smelter emissions & local processing incentives |
Africa contains major ore resources, but regulatory complexity (licensing, artisanal mining, conflict-risk) affects supply reliability. The Middle East mainly imports/processes markets with growing standards alignment. |
Segmental Insights
Type Insights
The primary copper segment dominated the copper products market with a share of 84.8% in 2025. It offers high purity and consistent metallurgical performance, making it widely used in electrical applications, construction wiring, electronics, and industrial components. This segment is driven by rising demand for high-conductivity metals in the energy transition, EV infrastructure, and advanced manufacturing. Primary copper manufacturers also benefit from stable supply chains and technological improvements in extraction and refining.
The Secondary copper segment expects significant growth in the copper products market during the forecast period. It offers cost advantages, a lower carbon footprint, and strong circular economy benefits. With increasing sustainability regulations and industry pressures to reduce emissions, demand for secondary copper continues to grow across construction, electrical systems, and consumer appliances. Its performance is comparable to primary copper, making it a preferred choice for manufacturers seeking environmentally responsible materials.
Product Insights
The wire segment dominated the copper products market with a share of 61.7% in 2025. Copper wire remains the largest product category due to coppers exceptional electrical and thermal conductivity. It is used in power transmission, electrical wiring, electronics manufacturing, renewable energy systems, and EV charging networks.
Copper wire is also essential for telecom, automotive harnesses, and industrial automation equipment, ensuring it remains a core segment of the global copper products market.
The flat-rolled products segment expects significant growth in the copper products market during the forecast period. Their excellent workability, corrosion resistance, and thermal performance make them suitable for both heavy industrial use and precision electronics manufacturing. Growth in semiconductor packaging, green buildings, and heat management solutions is expanding demand for high-quality, precision-rolled copper materials across global markets.
The tube segment has seen notable growth in the copper products market. Copper tubes are extensively used in plumbing, refrigeration, HVAC systems, medical gas pipelines, and industrial fluid transfer. They offer durability, antimicrobial properties, high corrosion resistance, and reliability under pressure. Growth in renewable energy systems, especially solar thermal panels and heat pumps, further strengthens this segments market momentum.
End Use Insights
The building and construction segment dominated the copper products market with a share of 28.4% in 2025. Building and construction forms a major end-use segment driven by coppers essential role in wiring, plumbing, roofing, fire-safety systems, and energy-efficient building components. The segment is also supported by increased adoption of copper tubes in HVAC systems and higher demand for corrosion-resistant architectural components, ensuring sustained long-term growth.
The infrastructure segment expects significant growth in the copper products market during the forecast period. Infrastructure uses copper for power grids, transportation networks, telecommunications, renewable energy installations, and large-scale public utility projects. Governments investing in modernisation and climate-resilient infrastructure continue to drive strong demand, positioning this segment as a key contributor to market growth globally.
The industrial equipment segment has seen notable growth in the copper products market. Industrial equipment applications include motors, transformers, heat exchangers, manufacturing machinery, and heavy industrial systems where coppers electrical and thermal performance is essential. Copper consumption is further strengthened by rising production of industrial machinery for mining, processing, and metal fabrication sectors, maintaining steady long-term demand.
Regional Analysis
The Asia Pacific copper products market size was estimated at USD 283.95 billion in 2025 and is projected to reach USD 492.23 billion by 2035, growing at a CAGR of 5.67% from 2026 to 2035. Asia Pacific dominated the market with a share of 75.55% in 2025.
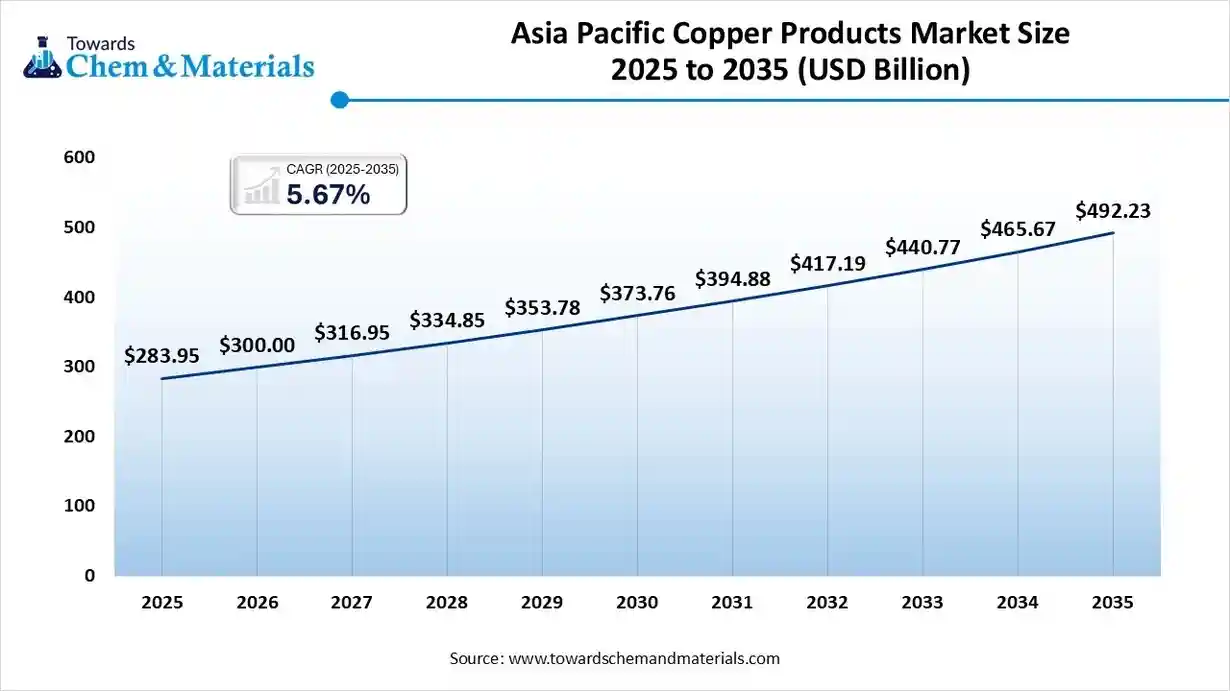
Asia Pacific leads global copper consumption driven by large-scale electrification, electronics manufacturing, and rapidly growing EV markets. China, India, Japan, and Southeast Asian economies drive demand for copper wire, tubing, and foil used in transformers, motors, and PCBs. The region also invests heavily in recycling and beneficiation to meet raw material needs amid rising environmental standards and import-dependency mitigation efforts.
China Copper Products Market Growth Trends
China is the worlds largest consumer and processor of copper products, with enormous demand across power transmission, electronics, and electric vehicles. Extensive domestic refining capacity and integrated supply chains support large-scale downstream manufacturing of cables, foils, and connectors. Policy emphasis on renewable energy and electrification further amplifies copper demand, while strategic stockpiling and import partnerships stabilise feedstock availability.
Europe Has Seen Growth Driven By The Strong Demand From The Manufacturers.
Europe is expected to have significant growth in the market in the forecast period. Europes copper market is shaped by strong demand from renewable energy, construction retrofits, and advanced manufacturing. The transition to electrified transport and expansion of grid infrastructure stimulate demand for high-purity copper products and speciality alloys. Circularity is a priority: high scrap recovery rates, regulatory focus on sustainable sourcing, and investments in domestic recycling enhance Europes ability to meet copper needs with lower environmental impact.
Germany Copper Products Market Growth Trends:
Germany is a major European consumer of copper products, driven by automotive, industrial machinery, and electrical equipment sectors. The countrys advanced manufacturing base demands high-quality copper alloys, precision foils, and conductor components. Germanys policies on energy transition and EV manufacturing support steady copper usage, while strong recycling systems and supplier networks help secure feedstock for industrial requirements.
The North America Copper Products Market Is Supported By The Demand From Various Sectors
North Americas copper products market is supported by robust demand from the electrical, construction, and renewable energy sectors. Grid modernisation, EV charging infrastructure, and broadband rollouts drive consumption of copper wire, busbars, and conductor products. Recycling and secondary copper supply are important for sustainability goals, while investments in local smelting and refining capacities aim to reduce import dependency and strengthen supply chain resilience.
United States Copper Products Market Growth Trends:
The U.S. market is characterised by high demand for refined copper in building wiring, power distribution, and electric vehicle components. Infrastructure stimulus and grid upgrade programs boost long-term copper usage. Domestic scrap recovery and advanced recycling capabilities supply a significant portion of requirements, while strategic investments in mining, smelting, and downstream processing seek to secure supply for critical electrification projects.
South Americas Growth Of The Market Is Driven By The Infrastructure Development
South America is an important copper supplier and growing consumer, with mining-rich countries supplying global markets while domestic downstream consumption increases. Infrastructure development and electrification initiatives across the region expand demand for copper cables, transformers, and construction wiring. Local smelting and refining capacities are growing, but export-focused raw material flows remain a defining feature of the regional market.
Brazil Copper Products Market Growth Trends:
Brazils copper products market is expanding with infrastructure projects, power transmission upgrades, and manufacturing development. While not the largest copper miner, Brazil is increasing downstream processing and recycling to support domestic consumption. Growth in renewable installations and electrified transport initiatives encourages higher local demand for copper conductors, cabling, and electrical components across industrial and urban projects.

Middle East & Africa (MEA) Has Seen Significant Growth Driven By The Large-Scale Urban Projects
MEAs copper market is evolving with investments in industrialisation, energy infrastructure, and large-scale urban projects. Demand arises from power grid expansion, telecom rollout, and construction in key economies. The region increasingly values local value-addition refining and processing to capture more of the copper value chain. Recycling activity is growing, though feedstock reliance on imports remains a strategic challenge for many countries.
GCC Countries Copper Products Market Growth Trends:
GCC nations (Saudi Arabia, UAE, Qatar) drive regional copper consumption through heavy infrastructure, petrochemical, and utilities projects. Rapid urbanisation and smart-city initiatives increase demand for cables, busbars, and electrical components. Governments are investing in industrial diversification and local metals processing to reduce import dependence. Growing renewable and desalination installations further support long-term copper product demand across the Gulf region.
Recent Developments
- In October 2025, JTL Industries expanded its non-ferrous product line by launching. Continuous Cast (CC) Copper, aimed at the electric vehicle (EV), renewable energy, and infrastructure sectors. The new product offers a thickness of 0.08 mm for enhanced electrical and thermal performance, with plans to increase production capacity from 100 MT to 500 MT per month by the end of Q4 (FY26).(Source: scanx.trade)
- In January 2025, JX Advanced Metals Corporation launched new lines of 100% recycled high-performance copper alloys, including Copper Titanium Alloys and Corson Alloys, as an expansion of its "Cu again" project.
- These materials, available in strip and foil forms, utilise proprietary recycling technologies and are certified as 100% recycled, designed for advanced ICT devices(Source: www.jx-nmm.com)
- In January 2025, Super Copper established a new Materials Science and Technology Division focused on creating biopolymer-based chemical solutions for the global mining industry. This initiative aims to address industry challenges related to efficiency and environmental impact through products for copper extractions, higher-value compound formation, and tailings remediation.(Source: www.newswire.ca)
Top players in the Copper Products Market & Their Offerings:
- Aurubis AG (Germany): Aurubis is one of the worlds leading copper manufacturers, offering high-purity copper cathodes, wire rods, shapes, and flat rolled products. The company serves industries such as electrical engineering, automotive, construction, and renewable energy with advanced and sustainable copper solutions.
- Jiangxi Copper Corporation (China): Jiangxi Copper is a dominant player in Asias copper industry, producing a wide range of copper rods, plates, strips, and tubes. Its extensive smelting and refining capabilities support global demand across electronics, infrastructure, and industrial machinery sectors.
- KME SE (Italy): KME is a major European supplier of copper and copper alloy products, including tubes, sheets, coils, and speciality semi-finished components. Its offerings cater primarily to HVAC, plumbing, electrical systems, and precision engineering applications.
- Wieland Group (Germany): Wieland specialises in high-performance copper and copper alloy products such as rods, strips, tubes, and components. Known for precision and quality, it supplies to automotive, electronics, and industrial equipment manufacturers worldwide.
- Mitsubishi Materials Corporation (Japan): Mitsubishi Materials provides high-quality copper cathodes, rolled copper products, and advanced alloys for the electrical, automotive, and semiconductor industries. The company focuses on sustainable refining and resource recycling to support eco-efficient copper manufacturing.
Top Players:
- KGHM Polska Miedz SA
- Glencore BHP
- Hindalco Industries Ltd.
- Mueller Industries
- Hailiang Group
- Nexans
- Codelco
- Freeport-McMoRan
- Southern Copper Corporation
- Metropolitan Industries
- Alara Resources Limited
- National Iranian Copper Industries Company
- Saudi Arabian Mining Company (Maaden)
- Nexa Resources
- Oriental Copper
- Sumitomo Metal Mining
Segments Covered:
By Type
- Primary Copper
- Secondary Copper
By Product
- Wire
- Rods, Bars & Sections
- Flat Rolled Products
- Tube
- Foil
By End Use
- Industrial Equipment
- Transport
- Infrastructure
- Building & Construction
- Consumer & General Products
- Others
By Region
- North America
- U.S.
- Canada
- Mexico
- Europe
- Germany
- UK
- France
- Italy
- Spain
- Asia Pacific
- China
- India
- Japan
- South Korea
- Latin America
- Brazil
- Argentina
- Middle East & Africa
- Saudi Arabia
- South Africa
A Seven-Phase Framework
Our methodology is designed to be universally applicable across commodity chemicals, specialty chemicals, petrochemicals, construction chemicals, coatings, electronic chemicals, industrial gases, agrochemicals, water treatment chemicals, and performance materials. Each phase builds upon the last, creating a layered validation structure that minimizes estimation error and maximizes analytical confidence.
The framework ensures comprehensive market coverage, robust cross-validation, and reliable long-term forecasting — producing market estimates that withstand scrutiny from investors, regulators, and corporate strategy teams.

Seven-Phase Framework — Analytical Effort Distribution
Relative analytical effort allocated across each phase of the Chemicals & Materials research framework

Phase 1 - Secondary Research: Establishing the Foundation
Secondary research collects and evaluates publicly available information from authoritative sources, establishing the foundational understanding of market structure, value chain dynamics, competitive landscape, and end-use demand patterns. Every source is evaluated for credibility, recency, geographic relevance, and methodological soundness before inclusion.
Industry Associations
Sources include ACC, CEFIC, ICCA, JCIA, CPCIF, and SOCMA providing production volumes, consumption trends, capacity developments, and sustainability initiatives.
Company Disclosures
Annual reports, investor presentations, earnings transcripts, and regulatory filings reveal product portfolios, manufacturing footprints, capacity expansions, and revenue segmentation.
Government Databases
National statistical offices, customs authorities, environmental agencies, and industrial production databases provide verified statistics on output, trade flows, and regulatory compliance.
Trade Databases
UN Comtrade, ITC, Eurostat, and national customs authorities enable assessment of global product movement, import dependency, and export competitiveness across regions.
Our Secondary Research Sources
- Ministry of Chemicals and Fertilizers
- European Chemicals Agency
- United States Department of Energy
- Ministry of Industry and Information Technology
- Ministry of Economy Trade and Industry
- Ministry of Trade Industry and Energy
- National Institute of Standards and Technology
- Council of Scientific and Industrial Research
- Fraunhofer Society
- National Institute for Materials Science
Phase 2 — Supply-Side Assessment: Mapping Production Capabilities
Production Capacity Analysis
All major manufacturers are assessed for existing installed capacity, planned additions, expansions, new plant announcements, and technology adoption — mapped at global, regional, and country levels.
Capacity Utilization Adjustment
Installed capacity is adjusted using utilization rates based on demand conditions, feedstock availability, plant operating rates, maintenance schedules, and regulatory restrictions.
Manufacturer Revenue Analysis
Product-specific revenues, segment-level performance, regional distribution, average selling prices, and margin trends are evaluated to establish market value estimates.
Supply-Side Assessment — Capacity vs. Effective Production by Region
Illustrative comparison of installed capacity vs. effective production volume (after utilization rate adjustment) across major regions

Phase 3 — Demand-Side Assessment: Quantifying Chemical Consumption
Demand-side analysis quantifies chemical consumption across industries, applications, and geographies — identifying where and how chemicals are consumed throughout the value chain with precision.
End-Use Industry Analysis
Chemical demand is evaluated across automotive, construction, packaging, electronics, agriculture, healthcare, consumer goods, industrial manufacturing, energy and utilities, and water treatment. Industry output, production trends, and consumption intensity are analyzed to determine demand patterns.
Consumption Modeling
Demand is estimated using measurable indicators: kilograms per vehicle, kilograms per square meter of construction, dosage per cubic meter of water treated, kilograms per hectare of agricultural land, and kilograms per ton of manufactured products. Consumption factors are validated through industry publications and primary interviews.
Application Analysis
The market is segmented by application area to understand product performance requirements, formulation trends, technology adoption, customer preferences, and regulatory requirements improving demand accuracy and segmentation granularity.
Demand-Side Assessment — End-Use Industry Demand Distribution
Illustrative distribution of chemical & materials demand across key end-use industries

Phase 4 - Trade Flow Analysis: Balancing Regional Supply and Demand
Trade flow analysis reconciles regional supply and demand estimates through import and export data, identifying net supply positions, regional dependencies, and market imbalances. It serves as an independent validation layer that tests the consistency of supply-side and demand-side estimates.
Import Analysis
Import data is evaluated to determine volumes, source countries, product dependency, regional supply gaps, and pricing trends — identifying markets that rely heavily on external supply and where domestic production is insufficient to meet demand.
Export Analysis
Export assessments reveal production surplus, export competitiveness, regional manufacturing strength, and global market participation. Export patterns also help validate domestic production estimates and identify net exporting regions.
Apparent Consumption Model
Regional consumption is assessed using the standard apparent consumption formula:
Results identify net importing regions, net exporting regions, regional deficits, and surpluses — serving as an independent validation of supply and demand estimates.
Trade Flow Analysis — Net Supply Position by Region
Illustrative apparent consumption vs. domestic production across major regions — positive gap indicates net import dependency

Phase 5 — Primary Research: The Critical Validation Layer
Primary research tests and refines findings from secondary research through direct engagement with industry participants across the supply chain, demand side, and expert community. It captures intelligence that no database or published report can provide — the real-world experience of manufacturers, buyers, and specialists operating in the market.

Supply-Side Interviews
Conversations with chemical manufacturers, raw material suppliers, contract manufacturers, technology providers, and plant operators cover production trends, capacity utilization, pricing developments, technology shifts, and competitive dynamics.

Demand-Side Interviews
Engagement with OEMs, industrial consumers, procurement managers, distributors, formulators, and end-use manufacturers focuses on consumption trends, purchasing behavior, product substitution, demand outlook, and emerging applications.

Industry Expert Consultations
Additional interviews with industry consultants, independent experts, regulatory specialists, technical professionals, and research institutions provide deeper market context and validate key analytical assumptions.
Focus Areas of Primary Research:
Market Size & Forecast Validation
Revenue estimates, volume consumption, growth rates, forecast assumptions, regional demand.Supply Chain & Value Chain Assessment
Raw material sourcing, supply chain challenges, distribution networks, procurement practices.Production & Capacity Analysis
Manufacturing capacity, utilization rates, expansion projects, plant investments.Pricing & Cost Structure Analysis
Product pricing trends, feedstock costs, energy costs, margin pressures, pricing outlook.Competitive Landscape Assessment
Volume and value estimates confirmed to be fully consistent with one another before publicationInterview Volume by Market Scope
| Study Scope | Number of Interviews |
|---|---|
| Niche Market | 20 – 30 |
| Mid-Sized Market | 30 – 50 |
| Global Market | 50 – 80 |
| Highly Fragmented Market | 80 – 120 |
Interview Details:
Category : Manufacturers, Suppliers, Distributors, End Users, Experts/Associations
Average Duration : 30–60 Minutes
Interview Mode : Video calls, telephonic interviews, expert consultations
Interview Format : Structured / Semi-Structured questionnaire
Focus Areas of Primary Research:
Market Size & Forecast Validation :
Revenue estimates, volume consumption, growth rates, forecast assumptions, regional demand.
Supply Chain & Value Chain Assessment :
Raw material sourcing, supply chain challenges, distribution networks, procurement practices.
Production & Capacity Analysis :
Manufacturing capacity, utilization rates, expansion projects, plant investments.
Pricing & Cost Structure Analysis :
Product pricing trends, feedstock costs, energy costs, margin pressures, pricing outlook.
Competitive Landscape Assessment :
Market share, competitor positioning, strategic initiatives, partnerships, acquisitions.
Primary Research — Stakeholder Coverage by Category
Distribution of interview respondents across stakeholder categories (% share from PPT data)

Primary Research — Respondent Designation Profile
Seniority breakdown of interview respondents (% share from PPT data)

Primary Research — Geographic Coverage of Interviews
Regional distribution of primary research engagement (% share from PPT data)

Phase 6 — Data Triangulation and Market Validation
No single methodology is relied upon in isolation. Multiple independent estimation approaches are combined and reconciled to ensure consistency, accuracy, and analytical defensibility. Any material deviations between approaches are investigated and adjusted through additional validation cycles.
The final market size is derived through weighted triangulation of all validated methodologies. Any material deviations between approaches are investigated and adjusted through additional validation cycles. The outcome represents the most realistic assessment of the market based on available evidence and expert confirmation ensuring that volume and value estimates are fully consistent with one another.
Triangulation Framework — Input Contribution Weight
Relative weight each sizing input contributes to the final reconciled market estimate

Phase 7 — Forecast Modeling: Projecting Future Market Evolution
Forecasting evaluates the future trajectory of the market using a combination of quantitative indicators and qualitative assessments across economic, industry, and regulatory dimensions. Rather than simple extrapolation, each driver is independently modeled and integrated into a composite forecast.
Macroeconomic Indicators
GDP growth, industrial production, manufacturing output, construction activity, consumer spending, and capital investment form the quantitative foundation of long-term demand projections. These are applied at country, regional, and global levels.
Industry Growth Drivers
Urbanization, infrastructure development, industrialization, technological innovation, sustainability initiatives, and evolving product performance requirements are assessed at regional and industry levels — capturing both structural and cyclical demand drivers.
Capacity Expansion Analysis
Announced plant expansions, new manufacturing facilities, technology upgrades, and strategic investments are evaluated to determine future supply-demand dynamics and potential market tightness or oversupply situations.
Regulatory & Sustainability
Environmental regulations, chemical safety standards, emission reduction targets, circular economy initiatives, and sustainability requirements are incorporated as they often influence product adoption rates and market growth trajectories.
Scenario Forecast Range — Indexed Market Growth (Year 1–10)
Illustrative indexed growth trajectories across Base, Optimistic, and Pessimistic scenarios over a 10-year forecast horizon

Forecast Drivers — Relative Impact Score by Category
Impact score (0–100) of each driver type on chemicals & materials market forecast




Comments
Share your thoughts, ask a question, or provide feedback about this report.