
Copper Market Size Analysis Report 2035
The global copper market size was estimated at USD 265.51 billion in 2025 and is expected to increase from USD 265.51 billion in 2026 to USD 469.96 billion by 2035, growing at a CAGR of 6.55% from 2026 to 2035. In terms of volume, the market is projected to grow from 27.11 million tons in 2025 to 42.30 million tons by 2035. growing at a CAGR of 4.66% from 2026 to 2035. Asia Pacific dominated the copper market with the largest volume share of 63.11% in 2025. The ongoing shift towards electrification and renewable energy has fueled the industry's potential in recent years. The copper market refers to the global industry involved in the mining, refining, processing, distribution, and utilization of copper, a versatile and highly conductive metal essential to multiple industrial and consumer applications. Copper is widely used in electrical wiring, electronics, construction, transportation, and renewable energy systems due to its thermal and electrical conductivity, ductility, and corrosion resistance. The market includes various forms such as refined copper, copper alloys, and semi-finished products (e.g., rods, plates, wires). Moreover, the increased industrialization is effectively contributing to the industry's growth in the current period. China maintained its dominance with a huge copper supply. Additionally, Vietnam ranks second in this supply. Other countries also have higher shipment numbers during these years, according to the pie chart.
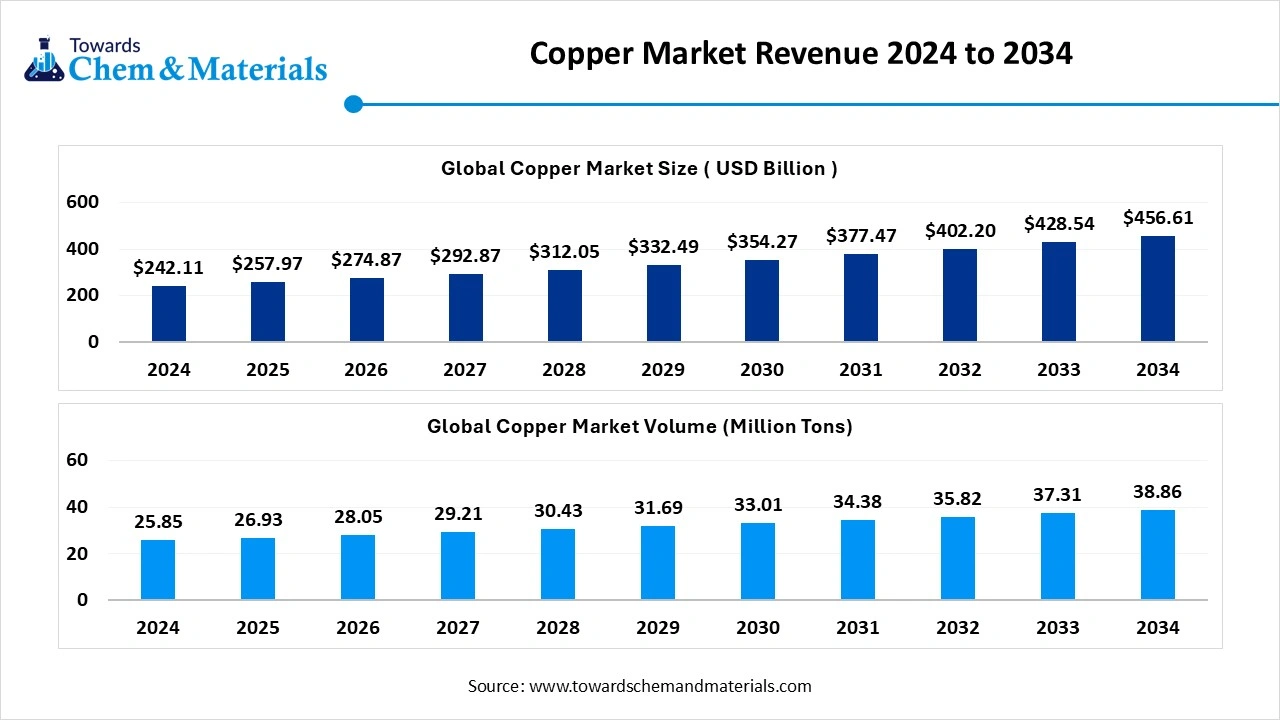
Market Highlights
- Asia Pacific held the largest hot rolled coil steel market share of 65.00% in 2025.
- By product type, the refined copper segment dominated the market and accounted for the largest revenue share of 29.00% in 2025, due to its wide application, such as the refined copper use in the electric wiring, roofing, plumbing, and electronics in the current period.
- By product type, the copper wire rods segment is expected to grow at the fastest CAGR of 64.32% from 2026 to 2035 in terms of share, owing to the rapid expansion of sectors like renewable energy, electric vehicles, and telecommunications in recent years.
- By application type, the electrical & electronics segment led the market with the largest revenue share of 34.00% in 2025, due to the excellent electrical conductivity of copper.
- By end-use industry, the power generation & construction segment dominated the market and accounted for the largest revenue share of 38.00% in 2025, owing to the large-scale use of copper in electrical systems, cables, transformers, and building infrastructure.
- By form type, the bare copper segment dominated the market and accounted for the largest revenue share of 41.00% in 2025, owing to its high conductivity, durability, and cost-effectiveness. It is used in power distribution, telecom wiring, and building infrastructure.
- By distribution channel, the direct sales led the market with the largest revenue share of 43.00% in 2025, as it allows manufacturers to maintain better control over pricing, supply chain, and customer relationships.
Which Factor Is Driving the Growth of the Copper market?
The sudden shift towards electrification and energy-efficient technologies is driving the industry's growth in recent years. Furthermore, several major manufacturers such as automakers, solar plants, and wind turbine manufacturers have been increasingly seen under the heavy usage of copper for motors and wiring in recent years. Also, the global push towards clean energy is expected to create beneficial advantages for the copper product manufacturers in the coming years, as per the recent industry observations.
Market Trends
- The sudden surge in electric vehicle adoption is spearheading industry growth in the current period. As the copper is playing a major role in EV manufacturing, as per the recent automotive industry observation.
- The ongoing shift towards sustainability is contributing to the copper market growth in recent years, as several manufacturers have been observing the recycled copper in their manufacturing plants over the past few years, as per the recent survey.
Report Scope
| Report Attributes | Details |
| Market Volume in 2026 | USD 265.51 Billion |
| Market Volume by 2035 | USD 469.96 Billion |
| Growth rate from 2026 to 2025 | CAGR 6.55% |
| Base Year of Estimation | 2025 |
| Forecast Period | 2026 - 2035 |
| Dominant Region | Asia Pacific |
| Segment Covered | By Product Type, By Application, By End-User Industry, By Form, By Distribution Channel, By Region |
| Key Profiled Companies | Codelco, BHP Group , Freeport-McMoRan Inc. , Glencore International AG , Jiangxi Copper Corporation , Anglo American plc , First Quantum Minerals Ltd., Antofagasta PLC , Grupo México S.A.B. de C.V., KGHM Polska Miedź S.A. , Southern Copper Corporation , Teck Resources Limited , Vedanta Resources Limited , Aurubis AG, Hindustan Copper Limited , Sumitomo Metal Mining Co., Ltd. , OZ Minerals Limited , China Nonferrous Metal Mining Group , Boliden AB , Norilsk Nickel |
Market Dynamics
Market Drivers
The copper market is driven by rising global demand for electrification, renewable energy deployment, and infrastructure development across both developed and emerging economies. Copper’s high electrical conductivity makes it a critical material for power generation, transmission, electric vehicles, and charging infrastructure. Expanding construction activity, urbanization, and industrialization are reinforcing consumption in wiring, plumbing, and building systems. Growth in electronics manufacturing and data centers is further increasing demand for copper in circuit boards, connectors, and cooling systems. In addition, government-led investments in grid modernization and clean energy transition initiatives are sustaining long-term copper demand.
Market Restraints
The copper market faces restraints from supply-side constraints, including declining ore grades, longer mine development timelines, and rising capital intensity for new projects. Price volatility driven by global economic cycles, geopolitical uncertainty, and currency fluctuations can affect investment planning and downstream demand.
Environmental regulations, permitting delays, and community opposition to mining activities are increasing compliance costs and slowing capacity expansion. Energy and labor cost inflation in key producing regions further pressures production economics. In some applications, substitution with aluminum or alternative materials can limit copper demand growth.
Market Opportunities
Significant opportunities exist in the accelerating transition to electric vehicles, renewable energy systems, and energy storage, all of which are copper-intensive. Expansion of solar, wind, and battery infrastructure is increasing copper requirements per unit of installed capacity. Growth in recycling and secondary copper production is creating opportunities to improve supply security and reduce environmental impact. Technological advancements in mining, processing, and digital mine management are improving productivity and recovery rates. Emerging markets investing in power infrastructure, telecommunications, and urban development present additional long-term growth potential.
Market Challenges
The copper market faces challenges in balancing rising demand with sustainable and reliable supply. Long project lead times and capital-intensive investments make rapid supply response difficult. Managing environmental, social, and governance expectations while expanding mining operations remains complex. Concentration of copper production in a limited number of countries increases exposure to geopolitical and operational risks. Ensuring sufficient skilled labor, water availability, and energy access for mining operations also poses ongoing challenges for the global copper industry.
Value Chain Analysis
- Mining and Concentration: This involves the exploration, extraction, crushing, and grinding of copper ore to produce copper concentrate.
- Key Players: Codelco, BHP Group Limited, Southern Copper Corporation, and Glencore plc.
- Smelting and Refining: In this, copper concentrates and recycled scrap are processed at high temperatures to produce blister and then refined into 99.99% pure copper cathodes.
- Key Players: Glencore plc, Aurubis AG, Jiangxi Copper Corporation Ltd., and Hindalco Industries Limited.
- Fabrication and Manufacturing: In this, refined copper is transformed into semi-finished products such as wire rods, plates, sheets, tubes, and bars.
- Key Players: Aurubis, the Wieland Group, KME, and Jiangxi Copper.
- Recycling and End-of-Life Management: In this copper products can be recycled indefinitely without loss of quality, contributing to a circular economy.
- Key Players: Recyclers, Glencore plc, and Aurubis AG.
Segment Insights
Product Type Insights
How the Refined Copper Segment Dominated the Copper Market in 2025?
The refined copper segment held the largest share of the market in 2025, due to its wide application, such as the refined copper use in the electric wiring, roofing, plumbing, and electronics in the current period. By having better conductivity and purity, the refined copper emerged as the ideal component in several sectors over time. Moreover, easy process and high-quality standards can maintain their dominance in the coming years as per the industry’s expectations.
The copper wire rods segment is expected to grow at a notable rate during the predicted timeframe, owing to the rapid expansion of sectors like renewable energy, electric vehicles, and telecommunications in recent years. The manufacturers are seen under the heavy usage of copper wire in the supply, akin to reliability and high conductivity in recent years. Moreover, as modern technology grows, the copper wire is likely to gain significant industry share in the coming years.
Copper Market Share, By Product Type , 2025(%)
| By Product Type | Revenue Share, 2025 (%) |
| Refined Copper | 29.00% |
| Copper Wire Rods | 20.00% |
| Copper Cathodes | 15.00% |
| Copper Tubes & Pipes | 8.00% |
| Copper Sheets & Plates | 6.00% |
| Copper Alloys (e.g., Brass, Bronze) | 8.00% |
| Copper Concentrates | 14.00% |
Application Insights
Why Do Electrical and Electronic Segments Dominated the Copper Market by Product Type?
The electrical and electronics segment held the largest share of the market in 2025, owing to the excellent electrical conductivity of copper. Moreover, the sudden surge of modern appliances, smartphones, and industrial automation has contributed to the segment's growth in recent years. Also, the trend for compact electronics has increased the need for high-performance copper in the past few years, as per recent observations.The renewable energy segment is expected to grow at a notable rate during the forecast period, owing to solar, wind, and hydropower systems, which all require large amounts of copper for wiring, turbines, inverters, and grid connections.
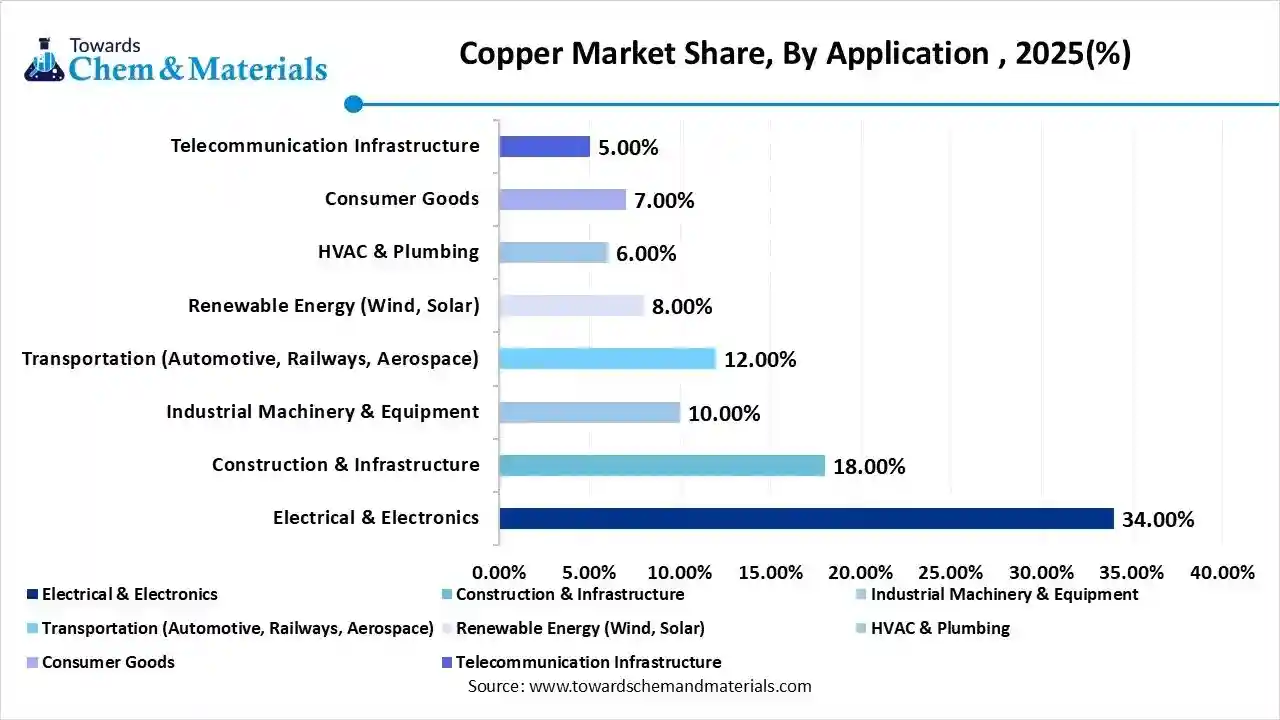
As the world transitions away from fossil fuels, green energy projects are increasing worldwide. Copper is crucial for building the infrastructure needed for sustainable energy transmission. Additionally, the global push for carbon reduction and energy efficiency means more investment in renewable installations, which will significantly boost copper consumption. Since copper is irreplaceable in many clean energy systems, this segment will see major growth and could eventually surpass traditional copper-consuming industries.
Copper Market Share, By Application , 2025(%)
| By Application | Revenue Share, 2025 (%) |
| Electrical & Electronics | 34.00% |
| Construction & Infrastructure | 18.00% |
| Industrial Machinery & Equipment | 10.00% |
| Transportation (Automotive, Railways, Aerospace) | 12.00% |
| Renewable Energy (Wind, Solar) | 8.00% |
| HVAC & Plumbing | 6.00% |
| Consumer Goods | 7.00% |
| Telecommunication Infrastructure | 5.00% |
End User Insights
Why Did the Power Generation & Construction Segment Dominate the Copper Market in 2025?
The power generation & construction segment dominated the market with the largest share in 2025, owing to the large-scale use of copper in electrical systems, cables, transformers, and building infrastructure. Power stations and transmission networks rely on copper for its high conductivity. Meanwhile, the construction industry uses copper for plumbing, HVAC, and electrical installations. The growing demand for urban housing, smart buildings, and power grid upgrades has pushed copper consumption higher in this segment. Also, government-funded infrastructure projects often require large copper volumes, making this a consistently strong sector in the copper market.
The automotive and EV segment is expected to grow at a notable rate during the forecast period, due to the rapid global shift toward electric vehicles, which use 3-4 times more copper than traditional vehicles.
EVs require copper for batteries, wiring, motors, and charging systems. As countries adopt emission reduction targets and promote electric mobility, demand for copper in this sector will soar. Additionally, connected and autonomous vehicle technologies also increase copper usage. With many major automakers investing heavily in EV production, copper will play a vital role, making this segment a future powerhouse in the copper market.
Copper Market Share, By End-User Industry , 2025(%)
| By End-User Industry | Revenue Share, 2025 (%) |
| Power Generation & Transmission | 38.00% |
| Building & Construction | 15.00% |
| Automotive & EV Industry | 12.00% |
| Electronics & Semiconductors | 10.00% |
| Mining & Heavy Machinery | 8.00% |
| Marine & Defense | 9.00% |
| Healthcare Equipment | 8.00% |
Form Insights
Why is Bare Copper Dominating Copper Market?
The bare copper segment held the largest share of the market share 41.00% in 2025 because of its high conductivity, durability, and cost-effectiveness. It is used in power distribution, telecom wiring, and building infrastructure. Bare copper is easy to install and does not require additional coating or insulation in many standard applications. It is the go-to choice for grounding wires and utility systems due to its performance and simplicity. As these applications remain essential across industries, bare copper continues to be widely preferred, especially in markets that prioritize traditional wiring methods.
The recycled copper segment is observed to grow at the fastest rate during the forecast period, owing to increasing environmental concerns, cost savings, and resource conservation. Recycling copper requires up to 85% less energy than mining and refining new copper. As industries and governments push for circular economic practices, the demand for sustainable materials like recycled copper is rising. Technological advancements now allow for high-purity recovery, making recycled copper just as useful as virgin material. With growing global scrap availability and policies encouraging recycling, this segment is expected to significantly expand and support long-term copper market sustainability.
Copper Market Share, By Form , 2025(%)
| By Form | Revenue Share, 2025 (%) |
| Bare Copper | 41.00% |
| Insulated Copper | 15.00% |
| Rolled Products | 12.00% |
| Forged Products | 8.00% |
| Powdered Copper | 5.00% |
| Recycled Copper | 19.00% |
Distribution Channel Insights
How Does Direct Sales Segment Dominated Copper Market Growth?
The direct sales segment led the market share 43.00% in 2025 as it allows manufacturers to maintain better control over pricing, supply chain, and customer relationships. Selling directly to end users like construction firms or OEMs ensures faster delivery and customized service. It also avoids middlemen, which helps reduce costs and improve profit margins. This model works well for large-volume orders, where clients require high-quality material on consistent terms. Industrial buyers often prefer direct engagement for long-term contracts and technical support, making this channel very efficient for bulk copper transactions.
The online metal marketplaces segment is expected to grow at the fastest rate in the market during the forecast period, owing to growing digital adoption, convenience, and transparency in pricing. Buyers can now easily compare different suppliers, review certifications, and place orders instantly. This model also benefits small and mid-sized customers who need smaller quantities without negotiating large contracts. With supply chain digitization and B2B e-commerce expanding, online platforms offer scalability and faster logistics. Many metal platforms are also integrating smart tools like AI and blockchain for real-time inventory and secure payments. As copper trading becomes more digital, online sales will capture a bigger market share.
Copper Market Share, By Distribution Channel , 2025(%)
| By Distribution Channel | Revenue Share, 2025 (%) |
| Direct Sales (B2B Contracts) | 43.00% |
| Distributors & Wholesalers | 25.00% |
| Online Metals Marketplaces | 14.00% |
| Metal Exchanges (e.g., LME) | 10.00% |
| Stockists & Local Dealers | 8.00% |
Regional Insights
The Asia Pacific copper market size was valued at USD 161.97 billion in 2025 and is expected to be worth around USD 307.82 billion by 2035, exhibiting at a compound annual growth rate (CAGR) of 6.63% over the forecast period from 2026 to 2035, growing at a CAGR of 5.76% throughout the forecast period from 2025 to 2035 The Asia Pacific volume was estimated at 17.62 million tons in 2025 and is projected to reach 27.71 million tons by 2035, growing at a CAGR of 4.45% from 2026 to 2035. Asia Pacific dominated the market share 65% in 2025, akin to the presence of strong industrial bases in the region.
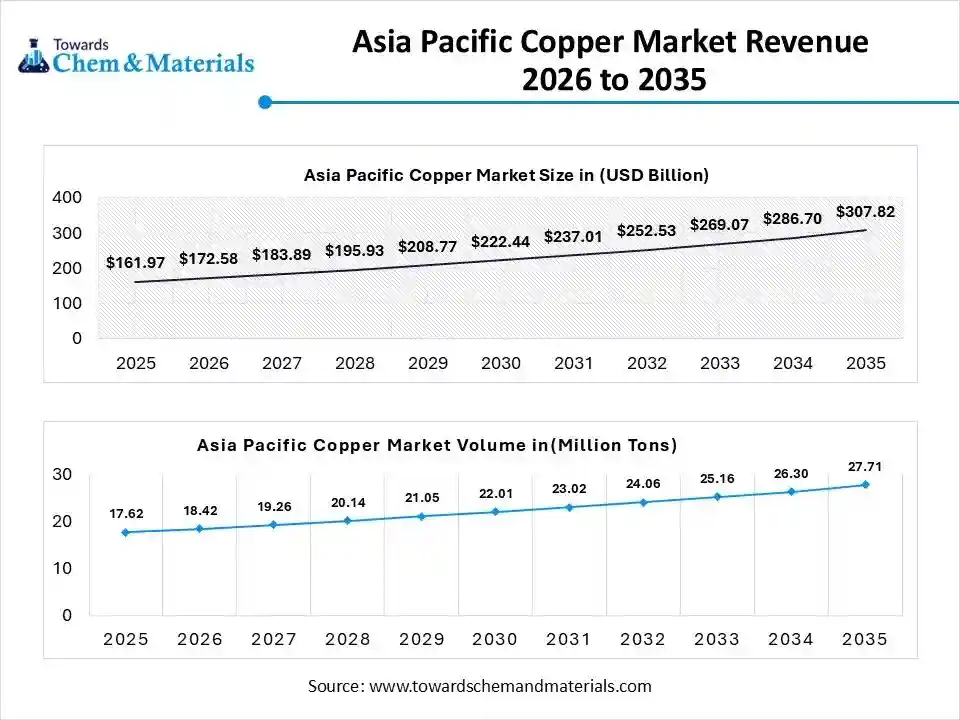
The increased demand for major sectors such as power, construction, and electronics is increasingly contributing to the industry's growth in the current period. Moreover, the regional countries such as China, India, and Japan have a unique advantage, like low labor cost and raw material availability, maintaining the regional dominance in recent years, as per the regional observation.
What Makes China the Driving Force Behind Global Copper Wire Trends?
China maintained its dominance in the copper market, owing to its huge electronic manufacturing base. As China is considered the world's largest consumer of copper, as per the report observation, which has led to the industry's growth in the past few years. Moreover, the country's sudden shift towards green energy and infrastructure mega projects created huge demand for copper wiring in recent years.
How will Europe be considered a Notable Region in the Copper Market?
Europe is also considered a notably growing area, primarily due to its extensive industrial base, high demand driven by the green energy transition, and world-leading copper recycling capabilities. Europe encompasses the entire copper value chain, from mining and smelting to fabricating semi-finished and end-use products for diverse sectors, including electrical, construction, and automotive industries. Key players such as Aurubis and KGHM are based in the region and contribute to global expansion through improved efficiency and product quality.
Germany Copper Market Trends
Germany stands out as a distinctive market within Europe, serving as a major industrial consumer, importer, and top exporter of high-value copper products. The country relies heavily on imported copper to support its extensive manufacturing base, particularly in the automotive, electrical equipment, and construction sectors. Major players like Aurubis AG, Europe's largest copper producer, are focused on both primary production and recycling.
How did North America contribute to the Copper Market?
North America plays a significant role in the global market, with growth primarily driven by the clean energy transition, massive infrastructure development, the boom in AI and data centers, and efforts to enhance supply chain resilience. Recognizing the strategic importance of copper and the risks of relying on imports, the U.S. is pushing to secure a more robust domestic supply chain through mining and recycling, which encourages market growth and investment. Government initiatives and investments in upgrading aging power grids and telecommunications networks are also significantly copper-intensive.
The U.S. Copper Market Trends
The U.S. is a substantial producer, major consumer, and significant importer of copper, with demand increasing rapidly due to the energy transition. Copper is critical to the U.S. economy, especially in building and construction, electrical infrastructure, renewable energy systems, and electric vehicles. Key U.S. companies include Freeport-McMoRan Inc., the largest publicly traded copper producer with significant operations across the Americas.
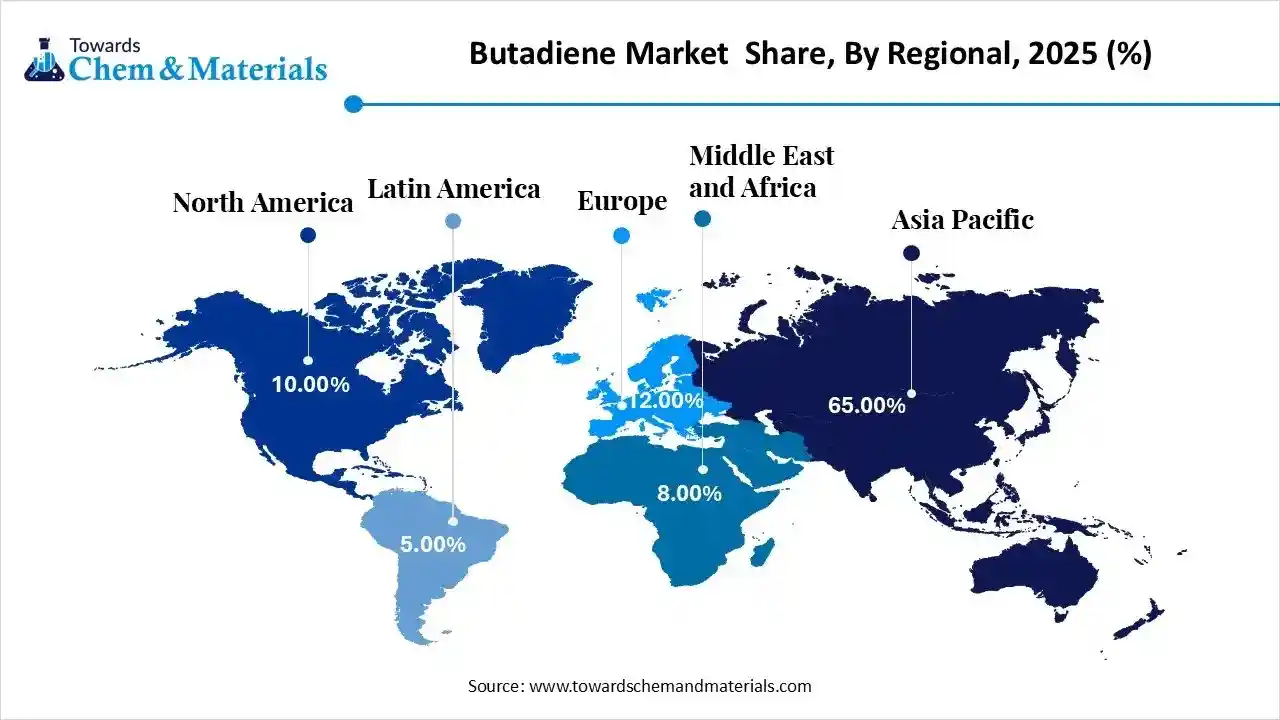
Latin America expects significant growth in the market during the forecast period, owing to the presence of huge copper reserves and the sudden increased investment in mining. Also, the regional countries such as Chile and Peru have seen the heavy copper availability in their mines, as per recent observations. Moreover, the rising adoption of renewable energy initiatives and electric vehicles is anticipated to contribute heavily to the regional market growth in the coming years.
Could Copper Become the Backbone of the Brazil Economic Expansion?
The Brazil is expected to rise as a dominant country in the Latin American region in the coming years, owing to its rapidly changing infrastructure needs and industry standards. The country has seen heavy infrastructure development, where copper can play a major role in the coming years. Moreover, the rising huge investment in mining is projected to drive industry growth in the upcoming years.
Copper Market Share, By Region, 2025(%)
| By Region | Revenue Share, 2025 (%) |
| North America | 10.00% |
| Europe | 12.00% |
| Asia Pacific | 65.00% |
| Latin America | 5.00% |
| Middle East & Africa | 8.00% |
How will the Middle East and Africa contribute to the Copper Market?
The Middle East and Africa are also significant contributors to the global market, mainly due to vast copper ore reserves and production capabilities, as well as rapidly growing demand driven by infrastructure development, urbanization, and energy transition projects. Countries like the UAE are establishing themselves as major metal trading and re-export centers, linking African raw material sources with global markets. The Central African Copperbelt, which spans the Democratic Republic of Congo and Zambia, is the world's largest mineralized sediment-hosted copper province and provides a strong resource base.
The UAE Copper Market Trends
The UAE is emerging as a player in the global market, driven by rapid urbanization, extensive infrastructure projects, and investments in renewable energy and smart city initiatives, which are spurring significant domestic demand for copper products. The country also focuses on processing imported materials into value-added products such as rods and wires for construction and electrical applications.
Recent Developments
- In January 2026, the CSIR–Institute of Minerals and Materials Technology (CSIR-IMMT) entered into a research and development agreement with Hindustan Copper Limited (HCL) to explore the recovery of critical minerals, including rare earth elements, trace elements, and copper from copper ores, concentrates, and tailings.(Source: orissadiary.com)
- In January 2026, Amazon’s data centers will reportedly utilize copper from a mine in Arizona that’s leaching metal from ores using microorganisms, the Wall Street Journal reports. Amazon Web Services will be the first customer for Nuton Technologies, which developed the “bioleaching” technology. AWS will also be providing “cloud-based data and analytics support,” helping to optimize Nuton’s mining process.(Source: www.theverge.com)
Top Companies List
- Codelco
- BHP Group
- Freeport-McMoRan Inc.
- Glencore International AG
- Jiangxi Copper Corporation
- Anglo American plc
- First Quantum Minerals Ltd.
- Antofagasta PLC
- Grupo México S.A.B. de C.V.
- KGHM Polska Miedź S.A.
- Southern Copper Corporation
- Teck Resources Limited
- Vedanta Resources Limited
- Aurubis AG
- Hindustan Copper Limited
- Sumitomo Metal Mining Co., Ltd.
- OZ Minerals Limited
- China Nonferrous Metal Mining Group
- Boliden AB
- Norilsk Nickel
Segment Covered
By Product Type
- Refined Copper
- Copper Wire Rods
- Copper Cathodes
- Copper Tubes & Pipes
- Copper Sheets & Plates
- Copper Alloys (e.g., Brass, Bronze)
- Copper Concentrates
By Application
- Electrical & Electronics
- Construction & Infrastructure
- Industrial Machinery & Equipment
- Transportation (Automotive, Railways, Aerospace)
- Renewable Energy (Wind, Solar)
- HVAC & Plumbing
- Consumer Goods
- Telecommunication Infrastructure
By End-User Industry
- Power Generation & Transmission
- Building & Construction
- Automotive & EV Industry
- Electronics & Semiconductors
- Mining & Heavy Machinery
- Marine & Defense
- Healthcare Equipment
By Form
- Bare Copper
- Insulated Copper
- Rolled Products
- Forged Products
- Powdered Copper
- Recycled Copper
By Distribution Channel
- Direct Sales (B2B Contracts)
- Distributors & Wholesalers
- Online Metals Marketplaces
- Metal Exchanges (e.g., LME)
- Stockists & Local Dealers
By Region
- North America
- U.S.
- Mexico
- Canada
- Europe
- Germany
- UK
- France
- Italy
- Asia Pacific
- China
- India
- Japan
- South Korea
- Central & South America
- Brazil
- Argentina
- Middle East & Africa
- Saudi Arabia
- UAE
A Seven-Phase Framework
Our methodology is designed to be universally applicable across commodity chemicals, specialty chemicals, petrochemicals, construction chemicals, coatings, electronic chemicals, industrial gases, agrochemicals, water treatment chemicals, and performance materials. Each phase builds upon the last, creating a layered validation structure that minimizes estimation error and maximizes analytical confidence.
The framework ensures comprehensive market coverage, robust cross-validation, and reliable long-term forecasting — producing market estimates that withstand scrutiny from investors, regulators, and corporate strategy teams.

Seven-Phase Framework — Analytical Effort Distribution
Relative analytical effort allocated across each phase of the Chemicals & Materials research framework

Phase 1 - Secondary Research: Establishing the Foundation
Secondary research collects and evaluates publicly available information from authoritative sources, establishing the foundational understanding of market structure, value chain dynamics, competitive landscape, and end-use demand patterns. Every source is evaluated for credibility, recency, geographic relevance, and methodological soundness before inclusion.
Industry Associations
Sources include ACC, CEFIC, ICCA, JCIA, CPCIF, and SOCMA providing production volumes, consumption trends, capacity developments, and sustainability initiatives.
Company Disclosures
Annual reports, investor presentations, earnings transcripts, and regulatory filings reveal product portfolios, manufacturing footprints, capacity expansions, and revenue segmentation.
Government Databases
National statistical offices, customs authorities, environmental agencies, and industrial production databases provide verified statistics on output, trade flows, and regulatory compliance.
Trade Databases
UN Comtrade, ITC, Eurostat, and national customs authorities enable assessment of global product movement, import dependency, and export competitiveness across regions.
Our Secondary Research Sources
- Ministry of Chemicals and Fertilizers
- European Chemicals Agency
- United States Department of Energy
- Ministry of Industry and Information Technology
- Ministry of Economy Trade and Industry
- Ministry of Trade Industry and Energy
- National Institute of Standards and Technology
- Council of Scientific and Industrial Research
- Fraunhofer Society
- National Institute for Materials Science
Phase 2 — Supply-Side Assessment: Mapping Production Capabilities
Production Capacity Analysis
All major manufacturers are assessed for existing installed capacity, planned additions, expansions, new plant announcements, and technology adoption — mapped at global, regional, and country levels.
Capacity Utilization Adjustment
Installed capacity is adjusted using utilization rates based on demand conditions, feedstock availability, plant operating rates, maintenance schedules, and regulatory restrictions.
Manufacturer Revenue Analysis
Product-specific revenues, segment-level performance, regional distribution, average selling prices, and margin trends are evaluated to establish market value estimates.
Supply-Side Assessment — Capacity vs. Effective Production by Region
Illustrative comparison of installed capacity vs. effective production volume (after utilization rate adjustment) across major regions

Phase 3 — Demand-Side Assessment: Quantifying Chemical Consumption
Demand-side analysis quantifies chemical consumption across industries, applications, and geographies — identifying where and how chemicals are consumed throughout the value chain with precision.
End-Use Industry Analysis
Chemical demand is evaluated across automotive, construction, packaging, electronics, agriculture, healthcare, consumer goods, industrial manufacturing, energy and utilities, and water treatment. Industry output, production trends, and consumption intensity are analyzed to determine demand patterns.
Consumption Modeling
Demand is estimated using measurable indicators: kilograms per vehicle, kilograms per square meter of construction, dosage per cubic meter of water treated, kilograms per hectare of agricultural land, and kilograms per ton of manufactured products. Consumption factors are validated through industry publications and primary interviews.
Application Analysis
The market is segmented by application area to understand product performance requirements, formulation trends, technology adoption, customer preferences, and regulatory requirements improving demand accuracy and segmentation granularity.
Demand-Side Assessment — End-Use Industry Demand Distribution
Illustrative distribution of chemical & materials demand across key end-use industries

Phase 4 - Trade Flow Analysis: Balancing Regional Supply and Demand
Trade flow analysis reconciles regional supply and demand estimates through import and export data, identifying net supply positions, regional dependencies, and market imbalances. It serves as an independent validation layer that tests the consistency of supply-side and demand-side estimates.
Import Analysis
Import data is evaluated to determine volumes, source countries, product dependency, regional supply gaps, and pricing trends — identifying markets that rely heavily on external supply and where domestic production is insufficient to meet demand.
Export Analysis
Export assessments reveal production surplus, export competitiveness, regional manufacturing strength, and global market participation. Export patterns also help validate domestic production estimates and identify net exporting regions.
Apparent Consumption Model
Regional consumption is assessed using the standard apparent consumption formula:
Results identify net importing regions, net exporting regions, regional deficits, and surpluses — serving as an independent validation of supply and demand estimates.
Trade Flow Analysis — Net Supply Position by Region
Illustrative apparent consumption vs. domestic production across major regions — positive gap indicates net import dependency

Phase 5 — Primary Research: The Critical Validation Layer
Primary research tests and refines findings from secondary research through direct engagement with industry participants across the supply chain, demand side, and expert community. It captures intelligence that no database or published report can provide — the real-world experience of manufacturers, buyers, and specialists operating in the market.

Supply-Side Interviews
Conversations with chemical manufacturers, raw material suppliers, contract manufacturers, technology providers, and plant operators cover production trends, capacity utilization, pricing developments, technology shifts, and competitive dynamics.

Demand-Side Interviews
Engagement with OEMs, industrial consumers, procurement managers, distributors, formulators, and end-use manufacturers focuses on consumption trends, purchasing behavior, product substitution, demand outlook, and emerging applications.

Industry Expert Consultations
Additional interviews with industry consultants, independent experts, regulatory specialists, technical professionals, and research institutions provide deeper market context and validate key analytical assumptions.
Focus Areas of Primary Research:
Market Size & Forecast Validation
Revenue estimates, volume consumption, growth rates, forecast assumptions, regional demand.Supply Chain & Value Chain Assessment
Raw material sourcing, supply chain challenges, distribution networks, procurement practices.Production & Capacity Analysis
Manufacturing capacity, utilization rates, expansion projects, plant investments.Pricing & Cost Structure Analysis
Product pricing trends, feedstock costs, energy costs, margin pressures, pricing outlook.Competitive Landscape Assessment
Volume and value estimates confirmed to be fully consistent with one another before publicationInterview Volume by Market Scope
| Study Scope | Number of Interviews |
|---|---|
| Niche Market | 20 – 30 |
| Mid-Sized Market | 30 – 50 |
| Global Market | 50 – 80 |
| Highly Fragmented Market | 80 – 120 |
Interview Details:
Category : Manufacturers, Suppliers, Distributors, End Users, Experts/Associations
Average Duration : 30–60 Minutes
Interview Mode : Video calls, telephonic interviews, expert consultations
Interview Format : Structured / Semi-Structured questionnaire
Focus Areas of Primary Research:
Market Size & Forecast Validation :
Revenue estimates, volume consumption, growth rates, forecast assumptions, regional demand.
Supply Chain & Value Chain Assessment :
Raw material sourcing, supply chain challenges, distribution networks, procurement practices.
Production & Capacity Analysis :
Manufacturing capacity, utilization rates, expansion projects, plant investments.
Pricing & Cost Structure Analysis :
Product pricing trends, feedstock costs, energy costs, margin pressures, pricing outlook.
Competitive Landscape Assessment :
Market share, competitor positioning, strategic initiatives, partnerships, acquisitions.
Primary Research — Stakeholder Coverage by Category
Distribution of interview respondents across stakeholder categories (% share from PPT data)

Primary Research — Respondent Designation Profile
Seniority breakdown of interview respondents (% share from PPT data)

Primary Research — Geographic Coverage of Interviews
Regional distribution of primary research engagement (% share from PPT data)

Phase 6 — Data Triangulation and Market Validation
No single methodology is relied upon in isolation. Multiple independent estimation approaches are combined and reconciled to ensure consistency, accuracy, and analytical defensibility. Any material deviations between approaches are investigated and adjusted through additional validation cycles.
The final market size is derived through weighted triangulation of all validated methodologies. Any material deviations between approaches are investigated and adjusted through additional validation cycles. The outcome represents the most realistic assessment of the market based on available evidence and expert confirmation ensuring that volume and value estimates are fully consistent with one another.
Triangulation Framework — Input Contribution Weight
Relative weight each sizing input contributes to the final reconciled market estimate

Phase 7 — Forecast Modeling: Projecting Future Market Evolution
Forecasting evaluates the future trajectory of the market using a combination of quantitative indicators and qualitative assessments across economic, industry, and regulatory dimensions. Rather than simple extrapolation, each driver is independently modeled and integrated into a composite forecast.
Macroeconomic Indicators
GDP growth, industrial production, manufacturing output, construction activity, consumer spending, and capital investment form the quantitative foundation of long-term demand projections. These are applied at country, regional, and global levels.
Industry Growth Drivers
Urbanization, infrastructure development, industrialization, technological innovation, sustainability initiatives, and evolving product performance requirements are assessed at regional and industry levels — capturing both structural and cyclical demand drivers.
Capacity Expansion Analysis
Announced plant expansions, new manufacturing facilities, technology upgrades, and strategic investments are evaluated to determine future supply-demand dynamics and potential market tightness or oversupply situations.
Regulatory & Sustainability
Environmental regulations, chemical safety standards, emission reduction targets, circular economy initiatives, and sustainability requirements are incorporated as they often influence product adoption rates and market growth trajectories.
Scenario Forecast Range — Indexed Market Growth (Year 1–10)
Illustrative indexed growth trajectories across Base, Optimistic, and Pessimistic scenarios over a 10-year forecast horizon

Forecast Drivers — Relative Impact Score by Category
Impact score (0–100) of each driver type on chemicals & materials market forecast




Comments
Share your thoughts, ask a question, or provide feedback about this report.