
Compound Semiconductor Materials Market Size and Forecast 2026 to 2035
The global compound semiconductor materials market size was valued at USD 38.40 billion in 2025 and is estimated to reach around USD 69.56 billion by 2035, exhibiting a compound annual growth rate (CAGR) of 6.12% during the forecast period 2025 to 2035. Asia Pacific dominated the compound semiconductor materials market with the largest revenue share of 46.19% in 2025.The growing demand for renewable energy, 5G networks, electric vehicles, and high-frequency communications drives the growth of the market.
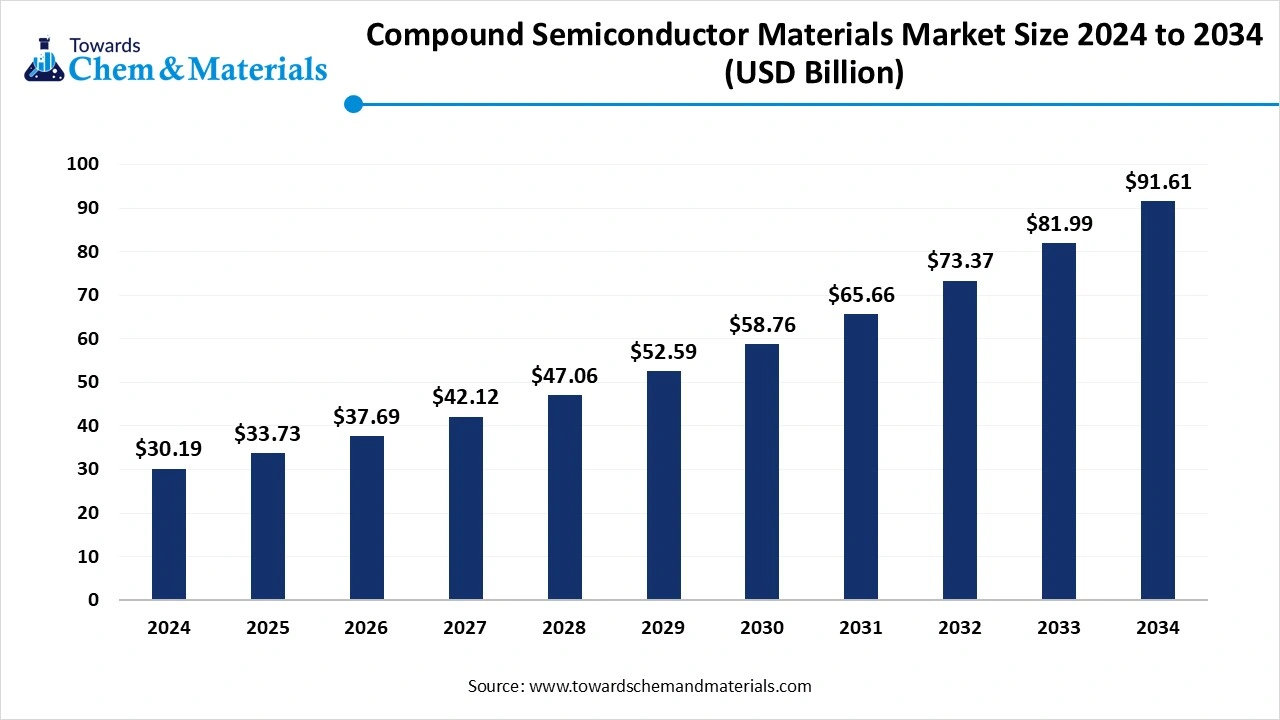
Key Takeaways
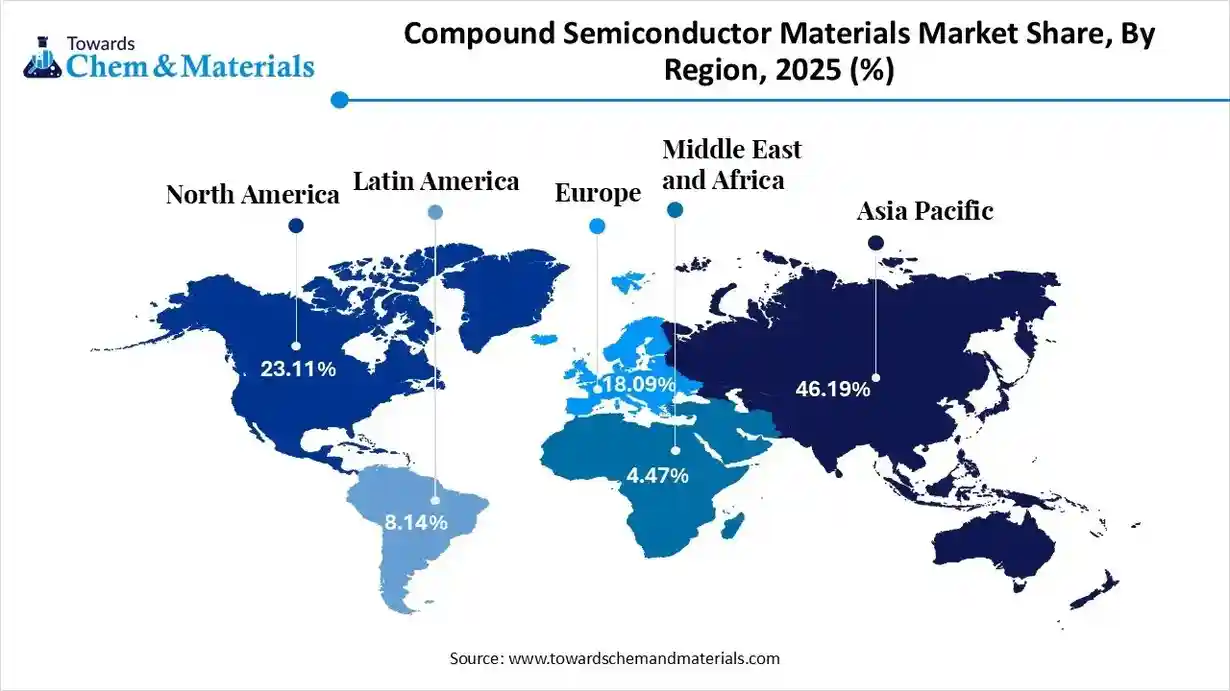
- The Asia Pacific dominated the global compound semiconductor materials market with the largest revenue share of 46.19% in 2025.
- North America is experiencing the fastest growth in the market due to the growing demand from end-user industries like aerospace, defense, and telecommunications.
- By product, the Group III-V segment dominated the compound semiconductor materials market in 2025.
- By product, the Group IV-IV segment is expected to grow at the fastest rate in the market during the forecast period due to the growing demand for silicon carbide in various industries.
- By application, the telecommunication segment dominated the compound semiconductor materials market with the largest share in 2025 due to the growing adoption of 5G networks.
- By application, the electronics & consumer goods segment is expected to grow at the fastest rate in the market during the forecast period due to the growing demand for various consumer electronics devices like laptops, computers, smartphones, and tablets.
Compound semiconductor materials power behind the technology revolution
Compound semiconductor materials are semiconductors made up of two or more elements of the periodic table. These materials have unique thermal, electrical, and optical properties. They are widely used for optoelectronic, high-speed electronic, and high-power devices due to their properties, like the ability to handle high voltages & frequencies and superior electron mobility.
The group III-V semiconductor materials are made up by combining group III and group V elements, and examples are InP, GaAs, and GaN. The group II-Vi is made up by combining group II elements and VI elements, and examples are ZnSe, CdS, and CdTe. The group IV-IV is made by combining group IV of the periodic table, and examples are silicon germanium, and silicon carbide. Compound silicon materials are widely used in optoelectronic applications like photodetectors, LEDs, lasers, and optoelectronic devices.
The growing innovation in manufacturing processes and government investment in semiconductor development & research help in the market growth. The growing demand for high-power applications, renewable energy, and 5G infrastructure drives the market growth. Factors like the growing adoption of electric vehicles, the growing demand for high-frequency communication, and the increasing demand from end-user industries like telecommunication, electronics & consumer goods, automotive, and aerospace & defense contribute to the compound semiconductor materials market growth.
- According to OEC, Norway exported $142 million of silicon carbide in 2023 .
- According to OEC, Brazil exported $59.9 million of silicon carbide in 2023 .
- According to Volza’s India export data, Russia exported 10667 shipments of silicon carbide .
- In March 2025, € 250 mln invested in the UK’s largest compound semiconductor manufacturing facility. The investment is fueling the production of advanced silicon carbide semiconductors. Vishays investment is to support over 500 high-skilled, high-value jobs in the region .
The growing automotive industry drives the market
The rapid expansion of the automotive industry in various regions increases demand for compound semiconductor materials. The growing adoption of hybrid vehicles and electric vehicles is the key driver for market growth. Electric vehicles & hybrid vehicles require semiconductors for motor control, power electronics, and battery management. Modern vehicles consist of sophisticated technologies and advanced safety features that increase the demand for semiconductor devices per vehicle. The growing demand for compound electronics like silicon carbide & gallium nitride in electric vehicles helps in the market growth.
The advancement in infotainment systems in vehicles and the rise of connected cars increases demand for compound semiconductors for essential vehicle functions, communication, and data processing. The growing development of autonomous driving and the rise in advanced driver assistance systems are fueling demand for compound semiconductor materials for managing complex algorithms, sensor data, and controlling vehicle movements. Furthermore, the growing electrification of vehicles, the need for high-performance vehicles, the rise in connected cars, and the demand for advanced vehicle safety a key drivers for the growth of the compound semiconductor materials market.
- According to the India Brand Equity Foundation, the Indian automotive industry is experiencing growth. In 2023, automobile exports from India were 4761487 .
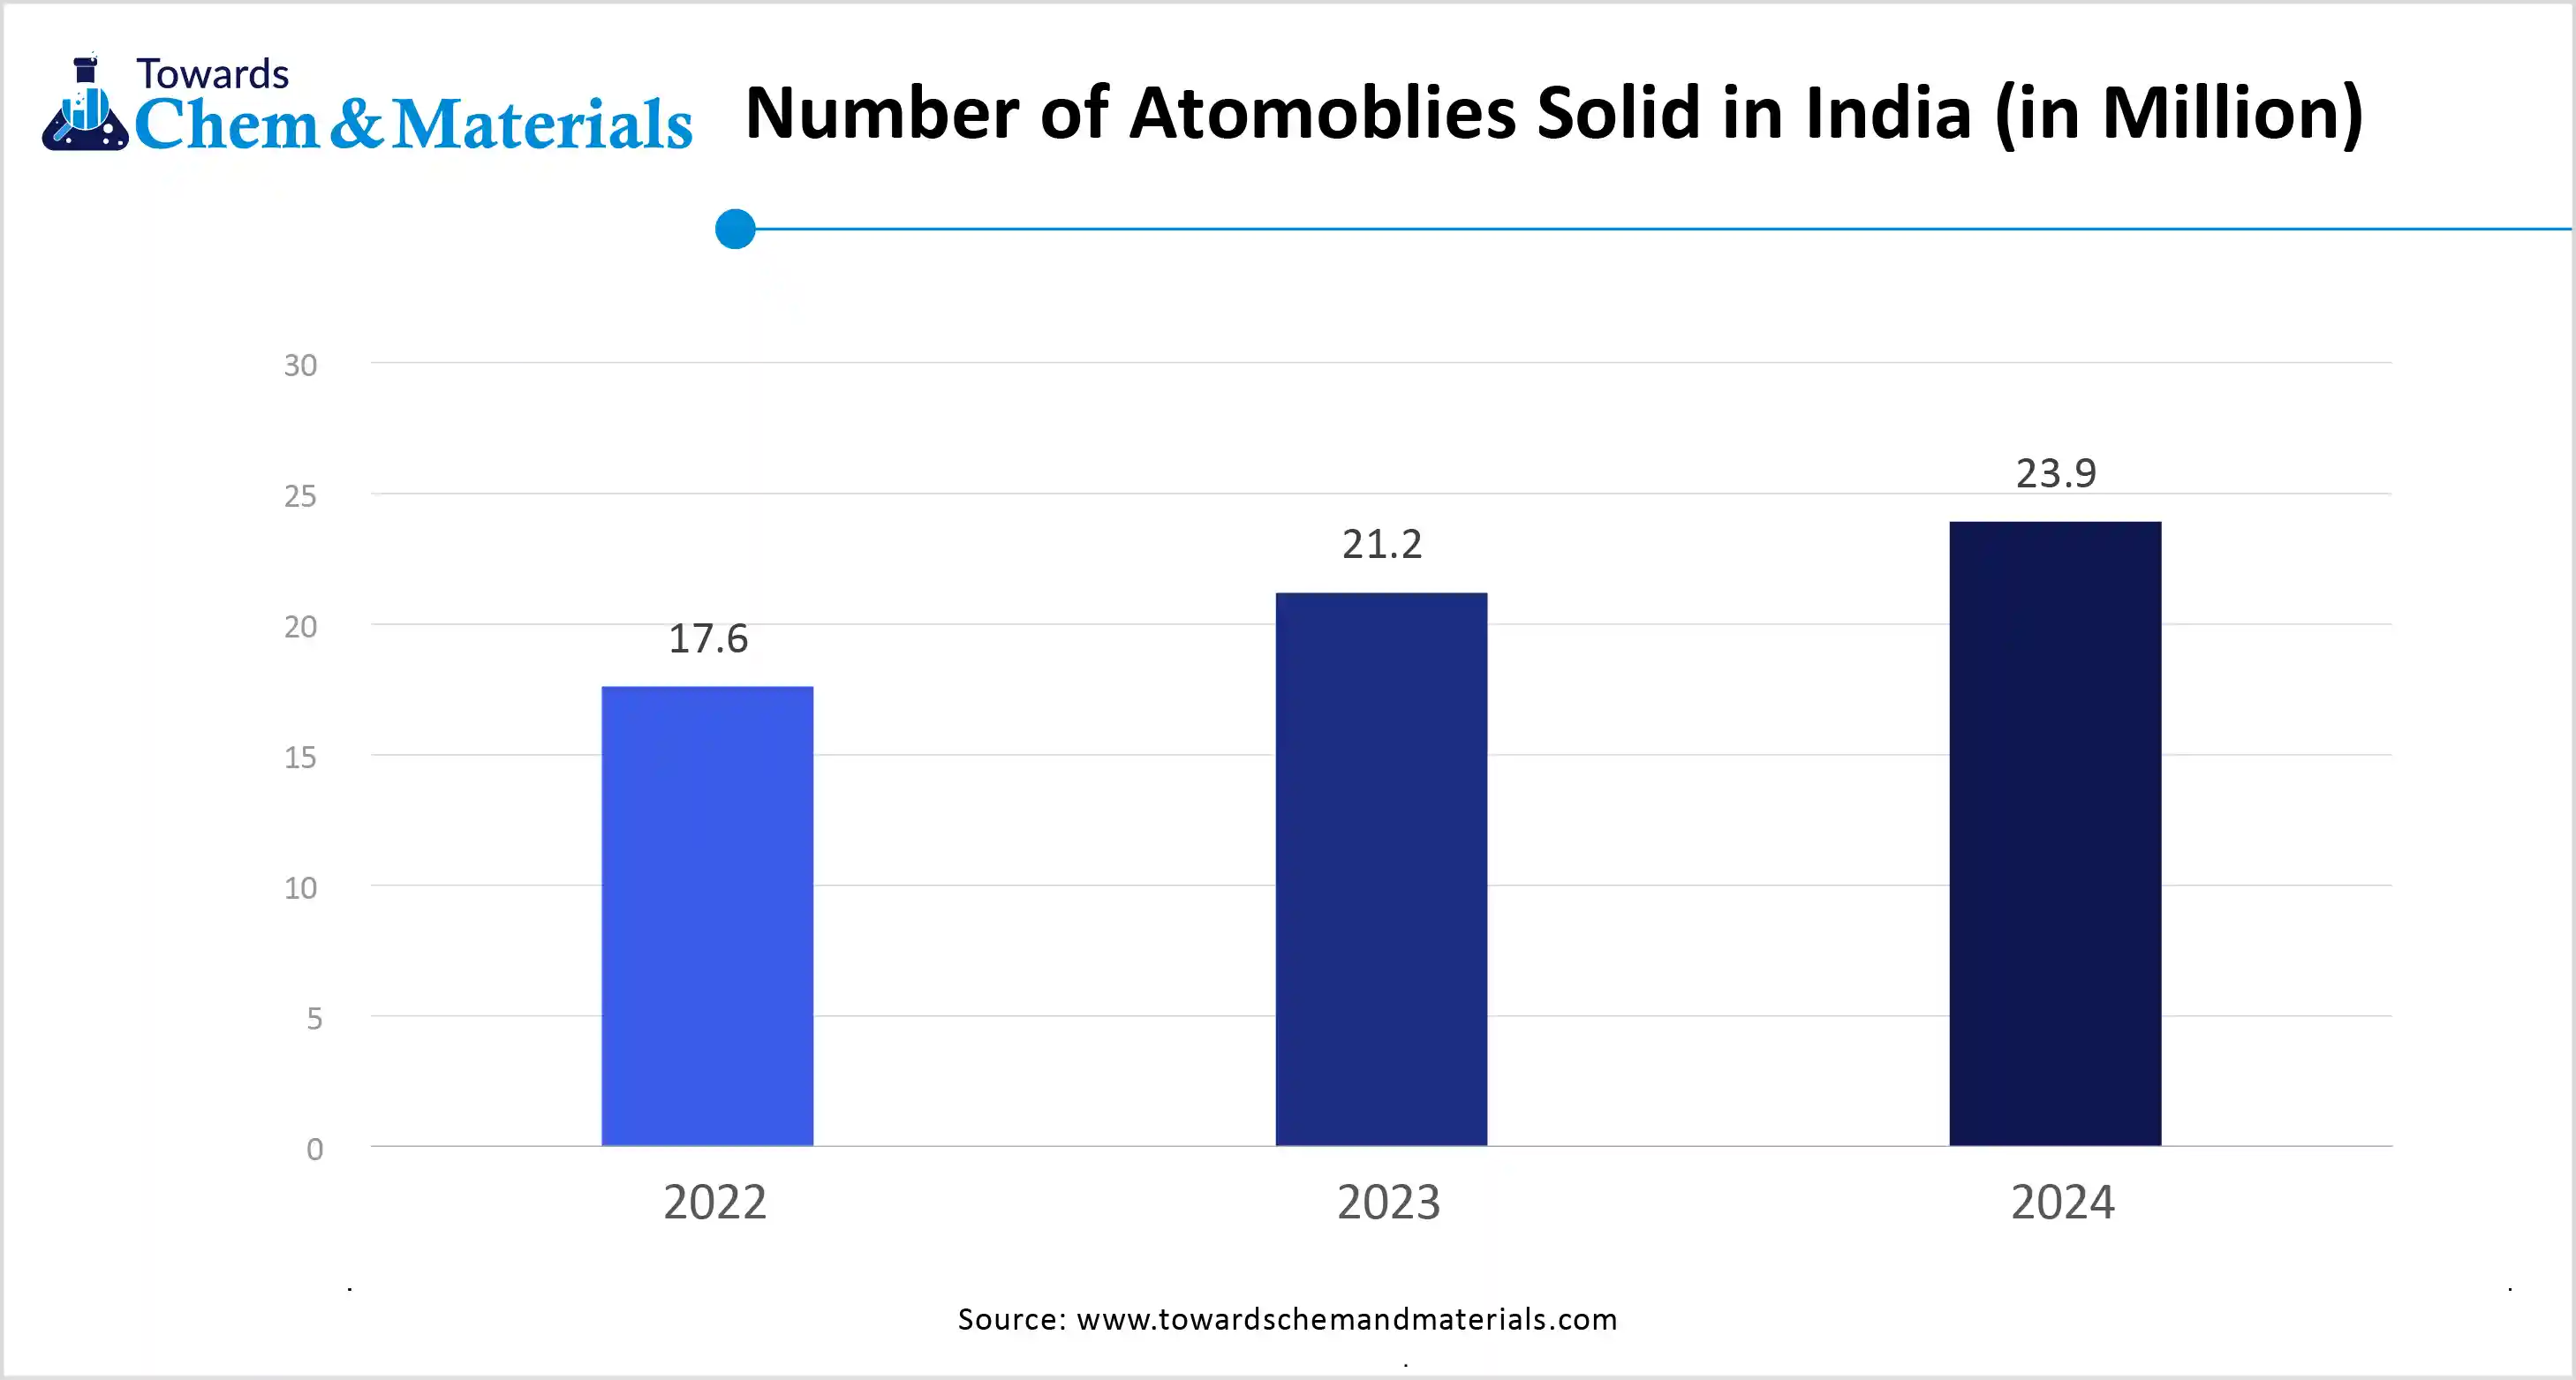
Compound Semiconductor Materials Market Trends
- Rise of 5G networks:- The growing adoption of 5G networks due to faster speed and enhanced connectivity increases demand for compound semiconductor materials. The growing 5G network increases demand for compound semiconductors like indium phosphide and gallium nitride. 5G infrastructure requires high-frequency components and high-speed for mobile devices and base stations. The growing expansion of 5G networks is a key trend for the market.
- Growing electric vehicle adoption:- The electric vehicle adoption in various regions is growing exponentially. The growing utilization of compound semiconductors like SiC in electric vehicles is due to properties like the ability to sustain high temperatures & voltages. For instance, according to the International Energy Agency, in 2023, nearly electric cars sales accounted nearly 14 million. The growing adoption of electric vehicles increases demand for compound semiconductor materials.
- Growing miniaturization of electronic devices:- The growing demand for small, compact, and lighter electronic devices like wearable devices, smartphones, and smartwatches increases demand for compound semiconductor materials to maintain reliability and performance. The miniaturization of devices increases demand for SiC and GaN compound semiconductors.
Report Scope
| Report Attributes | Details |
| Market Size in 2026 | USD 40.76 Billion |
| Expected Size By 2035 | USD 69.56 Billion |
| Growth Rate from 2026 to 2035 | CAGR 6.12% |
| Base Year of Estimation | 2025 |
| Forecast Period | 2026-2035 |
| Dominant Region | Asia Pacific |
| Segment Covered | By Product, By Application, By Region |
| Key Companies Profiled | Sumitomo Electric Industries, Ltd, FURUKAWA CO., LTD., SK siltron Co., Ltd., JX Nippon Mining & Metals, SHOWA DENKO K.K., Freiberger Compound Materials GmbH, Shin-Etsu Chemical Co., Ltd., Xiamen Powerway Advanced Materials Co., IQE PLC, WIN Semiconductors Corp |
Market Dynamics
Market Drivers
The compound semiconductor materials market is driven by rising demand for high-performance and energy-efficient electronic devices across power electronics, optoelectronics, and high-frequency applications. Rapid adoption of electric vehicles, renewable energy systems, and fast-charging infrastructure is accelerating use of materials such as silicon carbide and gallium nitride due to their superior thermal stability, high breakdown voltage, and efficiency. Growth of 5G infrastructure, data centers, and advanced communication systems is further increasing demand for gallium arsenide and indium phosphide in RF and microwave components. Increasing miniaturization and higher power density requirements in consumer and industrial electronics are reinforcing the shift away from traditional silicon.
Market Opportunities
Significant opportunities are emerging from the accelerating transition to electric mobility, particularly in traction inverters, onboard chargers, and fast-charging stations that require high-efficiency power devices. Expansion of renewable energy generation and smart grid infrastructure is creating demand for robust, high-voltage compound semiconductor components.
Growth in advanced sensing, lidar, and photonics for autonomous systems and industrial automation is expanding application scope. Government-backed investments in semiconductor manufacturing capacity and strategic supply chain localization are opening new regional production opportunities. Advances in wafer scaling and epitaxial growth technologies are improving cost structures and yield performance.
Market Challenges
A major challenge lies in achieving cost parity with silicon while maintaining the superior performance advantages of compound semiconductors. Scaling manufacturing capacity without compromising material quality and reliability remains technically demanding. Workforce shortages in specialized semiconductor materials science and device engineering add operational pressure.
Ensuring long-term reliability and qualification for automotive and aerospace applications requires extensive testing and certification. Additionally, aligning global standards for device performance, safety, and interoperability continues to challenge widespread adoption across diverse end-use markets.
Value Chain Analysis
- Research & Development (R&D): This involves innovating new materials and developing the architecture and circuitry designs for specific applications like 5G, EV power electronics, and photonics.
- Key Players: Synopsys, Cadence, ARM, Intel, Wolfspeed, Infineon Technologies AG, and Sumitomo Electric Industries.
- Raw Material and Substrate Manufacturing: This focuses on producing ultra-pure base materials and cutting them into highly flat, circular wafers suitable for chip fabrication.
- Key Players: Shin-Etsu Chemical Co., Ltd., Sumco, GlobalWafers, SK Siltron Co., Ltd., and Silex Microsystems.
- Wafer Fabrication: This involves building the actual integrated circuits on the wafer surface in highly advanced, capital-intensive facilities.
- Key Players: Taiwan Semiconductor Manufacturing Company (TSMC), Samsung Electronics Co., Ltd., GlobalFoundries, and Tokyo Electron Limited.
- Assembly, Testing, and Packaging: After fabrication, wafers are cut into individual dies and then assembled into protective packages and rigorously tested for quality and performance.
- Key Players: ASE Group, Amkor Technology, STMicroelectronics, Infineon Technologies AG, Renesas Electronics Corporation.
- Distribution and End-Product Integration: In this, finished, tested chips are shipped to original equipment manufacturers for integration into final electronic products.
- Key Players: DHL Group, FedEx Logistics, UPS Healthcare, Apple, Samsung, Qualcomm, and Bosch.
Segmental Insights
By product
The Group III-V segment dominated the compound semiconductor materials market in 2025. The growing demand from optoelectronic applications like lasers and LEDs helps in the growth of the market. The rapid growth in 5G wireless communication increases demand for Group III-V compound semiconductors to use in amplifiers & other components.
This kind of semiconductor exhibits a direct bandgap, high electron mobility, and high efficiency. The growing demand from powerless electronics and wireless communication helps in the market. The growing demand for gallium nitride, gallium arsenide, and indium phosphide in optoelectronics & power electronics contributes to the market growth.
The Group IV-IV segment is the fastest growing in the market during the forecast period. The growing demand for silicon carbide in automotive applications and power electronics helps in the growth of the market. This kind of semiconductor offers higher voltage tolerance, higher breakdown electric field strength, and higher operating temperature. The growing adoption of silicon carbide in electric vehicles for DC-DC converters drives the market growth.
The growing demand for optoelectronics devices for controlling & detecting light increases demand for Group IV-IV compound semiconductors. The growing advancements in SiC to enhance capabilities & performance help in the growth of the market. Additionally, growing demand from end-user industries like wind turbines, sensors, systems, military systems, and solar power inverters supports the overall growth of the market.
By application
The telecommunication segment held the largest share of the compound semiconductor materials market in 2025. The growing expansion & adoption of high-speed connectivity for more efficient communication helps in the market growth. The growing shift towards 5G increases demand for power amplifiers, which increases demand for compound semiconductor materials.
The growing development & adoption of mobile & wireless communication require efficient data transmission & high-frequency signals increase demand for compound semiconductor materials. The growing mobile data usage and the growing requirement for higher bandwidth networks help in the market growth. The growing utilization of a wide range of telecommunication devices, like optoelectronic devices, radio frequency devices, & data centers, and the rise of data-intensive services contribute to overall market growth.
The electronics & consumer goods segment experiences the fastest growth in the market during the forecast period. The growing miniaturization of electronic devices like compact, smaller & more lighter devices helps in the market growth. The growing production and adoption of various consumer electronic devices like smartphones, computers, laptops, tablets, and wearable devices increases demand for compound semiconductor materials.
The growing demand for lower energy consumption and longer battery life of consumer electronics increases demand for GaN and SiC. The growing utilization of LEDs in both residential & commercial sectors drives the market growth. The growing expansion of electronics and consumer goods in various regions supports the overall growth of the market.
Regional Insights
The Asia Pacific compound semiconductor materials market size was valued at USD 17.74 billion in 2025 and is expected to be worth around USD 32.13 billion by 2035, exhibiting at a compound annual growth rate (CAGR) of 6.14% over the forecast period from 2026 to 2035.
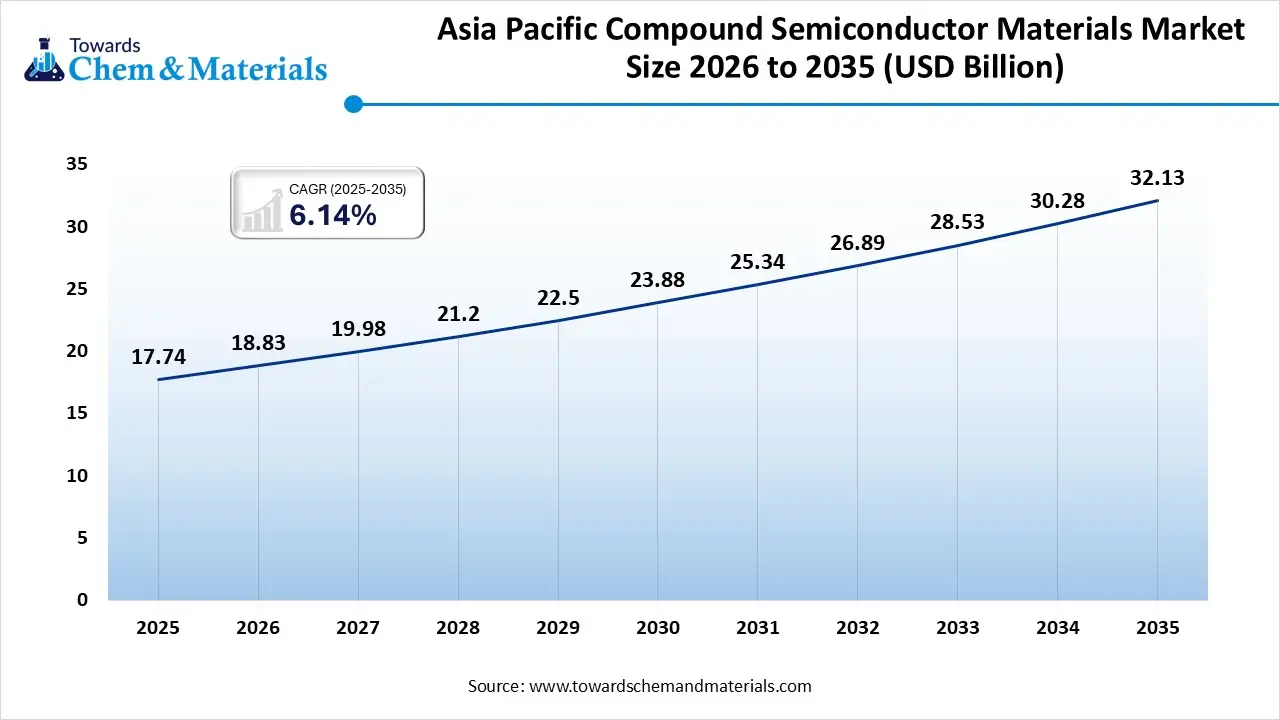
Asia Pacific dominance in the compound semiconductor materials market, Asia Pacific dominated the compound semiconductor materials market share 46.19% in 2025. The well-established electronics manufacturing hub in the region increases demand for compound semiconductor materials to be used in various devices like laptops, smartphones, tablets, and TVs. The presence of major semiconductor foundries and manufacturers helps in the market growth. The growing urbanizations and increasing disposable income in the region increases spending on various electronics devices, fueling demand for compound semiconductor materials.
The easy availability of raw materials and rapid technological innovation in areas like electric vehicles, 5G technology, and other technologies drive the market growth. The investment in defense modernization and growing industrial automation increases demand for compound semiconductor materials. The strong presence of semiconductor manufacturing in countries like South Korea, China, Taiwan, and Japan contributes to the growth of the market.
China’s strong influence on the compound semiconductor materials market. China is a major contributor to the compound semiconductor materials market. The strong presence of electronics manufacturing, like consumer electronics & smartphones, helps in the growth of the market. The research & development initiatives and financial investments in semiconductor production drive the market growth. The major production of raw materials like gallium and the rapid expansion of electric vehicles help in the growth of the market. The growing expansion of 5 G infrastructure and the automotive sector support the market growth.
- According to OEC, China exported $497 million of silicon carbide in 2023 .
- According to Volza’s India export data, China exported 50345 shipments of silicon carbide .
Expansion of compound semiconductor materials in India. Indian is significantly growing in the compound semiconductor materials market. The governments focus on digitalization and growing adoption of electronic devices in the region helps in the market growth. The growing strategic partnerships with other countries and global technology leaders, and government initiatives to support the semiconductor industry, drive the market growth.
- For instance, the India Semiconductor Mission aims to develop a strong display and semiconductor ecosystem and position India as a global hub for design and electronics manufacturing. Additionally, increasing demand for semiconductors and the presence of a skilled & large workforce of designers & engineers contribute to the growth of the market.
- According to Volza’s India export data, India exported 49902 shipments of silicon carbide .
- According to Volza’s India export data, from November 2023 to October 2024, India exported 4067 shipments of silicon carbide with a growth rate of 4%.
In January 2025, SiCSem invests Rs 2,500 crore in Bhubaneshwar, Odisha, for a compound semiconductor manufacturing facility. The facility provides the entire process of manufacturing power devices. The manufactured electronic power devices cater to sectors like industrial tools, energy storage, consumer appliances, green energy, electric vehicles, fast chargers, and data centers. The state government provided 14.32 acres of land for the project .
North America’s rapid growth in compound semiconductor materials. North America experiences the fastest growth in the market during the forecast period. The growing demand from industries like defense, telecommunications, and aerospace drives the market growth. The growing demand from high-frequency applications like radar systems, consumer electronics, and satellite communication increases demand for compound semiconductor materials.
The rapid adoption of the 5G network in the region increases demand for compound semiconductors like SiC and GaN. The growing government investment in semicon-ductor manufacturing and strong spending on the defense sector are fueling demand for compound semiconductors. The growing adoption of electric vehicles in the region helps in the market growth. Furthermore, growth in industries like automotive, AI & IoT, and growing technological advancements support the overall growth of the market.
Rise of compound semiconductor materials in the United States, The United States is a key contributor to the compound semiconductor materials market. The presence of strong research & innovation in semiconductor technology helps in the market growth. The presence of government initiatives and policies to support the domestic manufacturing of semiconductors drives the market growth. The increasing demand for wireless communication and the rapid deployment of 5G networks increases demand for compound semiconductor materials. The strong presence of leading semiconductor companies and growing demand from end-user industries like defense, telecommunications, automotive, and aerospace support the overall growth of the market.
- The United States government initiative, the CHIPS and Science Act, aims to boost the research & development, manufacturing of semiconductors domestically, and STEM education. The initiative provides $52.7 billion for semiconductor production over five years and an additional $174 billion for broader STEM efforts.
- According to OEC, the United States exported $28.6 million of silicon carbide in 2024 .
Why Is Europe Considered a Notable Region in the Compound Semiconductor Materials Market?
Europe is a notable region in the global market for compound semiconductor materials, primarily due to its strong industrial base, particularly in automotive and industrial applications, as well as its world-class research and development capabilities. Significant government initiatives, such as the European Chips Act, are also contributing to this growth. The region leads in semiconductor research and development, housing renowned research and technology organizations like CEA-Leti, IMEC, and Fraunhofer, which foster continuous innovation in material science and manufacturing techniques.
Germany Compound Semiconductor Materials Market Trends
Germany plays a pivotal role in the global market, largely driven by its robust automotive and industrial automation sectors. The country has a strong research ecosystem and serves as a hub for innovation, with companies such as Infineon Technologies and Bosch being global leaders in specialized applications. Supported by the EU Chips Act, the German government is investing billions in new fabrication facilities to enhance supply chain resilience and technological sovereignty.
What Has Caused the Emergence of Latin America in the Compound Semiconductor Materials Market?
Latin America is an emerging player in the global compound semiconductor market. This growth is fueled by rising domestic demand for electronics, the expansion of advanced technologies like 5G and electric vehicles, and a strategic emphasis on supply chain diversification, along with government support. The region boasts advantages such as abundant raw materials and a growing skilled workforce. It is experiencing an accelerated rollout of 5G networks, the rise of the Internet of Things across various sectors, and a shift towards electric mobility and advanced driver-assistance systems.
Brazil Compound Semiconductor Materials Market Trends
Brazil is positioning itself as a developing market within this region, focusing on building its domestic semiconductor ecosystem and integrating into the global supply chain. The Brazilian government is actively promoting the sector through initiatives such as the Brasil Semicon program and the PADIS tax incentive program, aimed at attracting investment and developing local research and development capabilities, as well as manufacturing, positioning it as a long-term strategic source for raw materials.
How will the Middle East and Africa Compound Semiconductor Materials Market?
The Middle East and Africa are key contributors to the global market, driven by strong government-led economic diversification initiatives, heavy investments in smart infrastructure projects, and access to crucial raw materials. Countries like Saudi Arabia and the UAE are making significant investments in high-tech industries to reduce their reliance on oil-based economies. The MEA regions strategic location between major markets in Europe and Asia provides logistical advantages for trade and distribution operations, enhancing its appeal as a potential hub for the global supply chain.
UAE Compound Semiconductor Materials Market Trends
The UAE is a significant market in this region, leveraging strategic government initiatives and high-tech ambitions to establish a regional semiconductor presence. The UAE aims to diversify its economy beyond oil by investing in high-tech industries, focusing on reshoring production and enhancing local manufacturing. The UAE is attracting investments and collaborations from major international companies such as Intel, Qualcomm, and GlobalFoundries to develop local design centers.
Recent Developments
- In November 2025, India-based SiCSem Pvt. Ltd. saw its facility’s groundbreaking completed at the behest of Odisha Chief Minister Mohan Charan Majhi. The compound semiconductor fabrication and ATMP facility at Info Valley-II is set to process 60,000 SIC wafers annually and package around 96 million MOSFETs and diodes, catering to critical sectors such as EV, renewable energy, and smart grid systems. SiCSem, a subsidiary of Archean Chemical Industries Ltd., ended up investing over Rs. 2,067 crore into the facility. (Source: www.newindianexpress.com )
- In May 2025, German researchers at the Fraunhofer Institute for Solar Energy Systems ISE (Fraunhofer ISE) reported producing high-quality indium phosphide on gallium arsenide substrates (InP-on-GaAs wafers) with up to 150 mm diameter. According to the researchers, the wafers can effectively replace classic indium phosphide in a variety of applications, offering a scalable pathway to lower cost.(Source: www.photonics.com)
Top Companies List
- Sumitomo Electric Industries, Ltd
- FURUKAWA CO., LTD.
- SK siltron Co., Ltd.
- JX Nippon Mining & Metals
- SHOWA DENKO K.K.
- Freiberger Compound Materials GmbH
- Shin-Etsu Chemical Co., Ltd.
- Xiamen Powerway Advanced Materials Co.
- IQE PLC
- WIN Semiconductors Corp
Segments Covered in the Report
By product
- Group III-V
- Group IV-IV
- Group II-VI
By application
- Telecommunications
- Electronics & Consumer Goods
- Aerospace & Defense
- Others
By region
- North America
- U.S.
- Canada
- Europe
- Germany
- UK
- France
- Italy
- Spain
- Sweden
- Denmark
- Norway
- Asia Pacific
- China
- Japan
- India
- South Korea
- Thailand
- Latin America
- Brazil
- Mexico
- Argentina
- Middle East & Africa
- South Africa
- UAE
- Saudi Arabia
- Kuwait
A Seven-Phase Framework
Our methodology is designed to be universally applicable across commodity chemicals, specialty chemicals, petrochemicals, construction chemicals, coatings, electronic chemicals, industrial gases, agrochemicals, water treatment chemicals, and performance materials. Each phase builds upon the last, creating a layered validation structure that minimizes estimation error and maximizes analytical confidence.
The framework ensures comprehensive market coverage, robust cross-validation, and reliable long-term forecasting — producing market estimates that withstand scrutiny from investors, regulators, and corporate strategy teams.

Seven-Phase Framework — Analytical Effort Distribution
Relative analytical effort allocated across each phase of the Chemicals & Materials research framework

Phase 1 - Secondary Research: Establishing the Foundation
Secondary research collects and evaluates publicly available information from authoritative sources, establishing the foundational understanding of market structure, value chain dynamics, competitive landscape, and end-use demand patterns. Every source is evaluated for credibility, recency, geographic relevance, and methodological soundness before inclusion.
Industry Associations
Sources include ACC, CEFIC, ICCA, JCIA, CPCIF, and SOCMA providing production volumes, consumption trends, capacity developments, and sustainability initiatives.
Company Disclosures
Annual reports, investor presentations, earnings transcripts, and regulatory filings reveal product portfolios, manufacturing footprints, capacity expansions, and revenue segmentation.
Government Databases
National statistical offices, customs authorities, environmental agencies, and industrial production databases provide verified statistics on output, trade flows, and regulatory compliance.
Trade Databases
UN Comtrade, ITC, Eurostat, and national customs authorities enable assessment of global product movement, import dependency, and export competitiveness across regions.
Our Secondary Research Sources
- Ministry of Chemicals and Fertilizers
- European Chemicals Agency
- United States Department of Energy
- Ministry of Industry and Information Technology
- Ministry of Economy Trade and Industry
- Ministry of Trade Industry and Energy
- National Institute of Standards and Technology
- Council of Scientific and Industrial Research
- Fraunhofer Society
- National Institute for Materials Science
Phase 2 — Supply-Side Assessment: Mapping Production Capabilities
Production Capacity Analysis
All major manufacturers are assessed for existing installed capacity, planned additions, expansions, new plant announcements, and technology adoption — mapped at global, regional, and country levels.
Capacity Utilization Adjustment
Installed capacity is adjusted using utilization rates based on demand conditions, feedstock availability, plant operating rates, maintenance schedules, and regulatory restrictions.
Manufacturer Revenue Analysis
Product-specific revenues, segment-level performance, regional distribution, average selling prices, and margin trends are evaluated to establish market value estimates.
Supply-Side Assessment — Capacity vs. Effective Production by Region
Illustrative comparison of installed capacity vs. effective production volume (after utilization rate adjustment) across major regions

Phase 3 — Demand-Side Assessment: Quantifying Chemical Consumption
Demand-side analysis quantifies chemical consumption across industries, applications, and geographies — identifying where and how chemicals are consumed throughout the value chain with precision.
End-Use Industry Analysis
Chemical demand is evaluated across automotive, construction, packaging, electronics, agriculture, healthcare, consumer goods, industrial manufacturing, energy and utilities, and water treatment. Industry output, production trends, and consumption intensity are analyzed to determine demand patterns.
Consumption Modeling
Demand is estimated using measurable indicators: kilograms per vehicle, kilograms per square meter of construction, dosage per cubic meter of water treated, kilograms per hectare of agricultural land, and kilograms per ton of manufactured products. Consumption factors are validated through industry publications and primary interviews.
Application Analysis
The market is segmented by application area to understand product performance requirements, formulation trends, technology adoption, customer preferences, and regulatory requirements improving demand accuracy and segmentation granularity.
Demand-Side Assessment — End-Use Industry Demand Distribution
Illustrative distribution of chemical & materials demand across key end-use industries

Phase 4 - Trade Flow Analysis: Balancing Regional Supply and Demand
Trade flow analysis reconciles regional supply and demand estimates through import and export data, identifying net supply positions, regional dependencies, and market imbalances. It serves as an independent validation layer that tests the consistency of supply-side and demand-side estimates.
Import Analysis
Import data is evaluated to determine volumes, source countries, product dependency, regional supply gaps, and pricing trends — identifying markets that rely heavily on external supply and where domestic production is insufficient to meet demand.
Export Analysis
Export assessments reveal production surplus, export competitiveness, regional manufacturing strength, and global market participation. Export patterns also help validate domestic production estimates and identify net exporting regions.
Apparent Consumption Model
Regional consumption is assessed using the standard apparent consumption formula:
Results identify net importing regions, net exporting regions, regional deficits, and surpluses — serving as an independent validation of supply and demand estimates.
Trade Flow Analysis — Net Supply Position by Region
Illustrative apparent consumption vs. domestic production across major regions — positive gap indicates net import dependency

Phase 5 — Primary Research: The Critical Validation Layer
Primary research tests and refines findings from secondary research through direct engagement with industry participants across the supply chain, demand side, and expert community. It captures intelligence that no database or published report can provide — the real-world experience of manufacturers, buyers, and specialists operating in the market.

Supply-Side Interviews
Conversations with chemical manufacturers, raw material suppliers, contract manufacturers, technology providers, and plant operators cover production trends, capacity utilization, pricing developments, technology shifts, and competitive dynamics.

Demand-Side Interviews
Engagement with OEMs, industrial consumers, procurement managers, distributors, formulators, and end-use manufacturers focuses on consumption trends, purchasing behavior, product substitution, demand outlook, and emerging applications.

Industry Expert Consultations
Additional interviews with industry consultants, independent experts, regulatory specialists, technical professionals, and research institutions provide deeper market context and validate key analytical assumptions.
Focus Areas of Primary Research:
Market Size & Forecast Validation
Revenue estimates, volume consumption, growth rates, forecast assumptions, regional demand.Supply Chain & Value Chain Assessment
Raw material sourcing, supply chain challenges, distribution networks, procurement practices.Production & Capacity Analysis
Manufacturing capacity, utilization rates, expansion projects, plant investments.Pricing & Cost Structure Analysis
Product pricing trends, feedstock costs, energy costs, margin pressures, pricing outlook.Competitive Landscape Assessment
Volume and value estimates confirmed to be fully consistent with one another before publicationInterview Volume by Market Scope
| Study Scope | Number of Interviews |
|---|---|
| Niche Market | 20 – 30 |
| Mid-Sized Market | 30 – 50 |
| Global Market | 50 – 80 |
| Highly Fragmented Market | 80 – 120 |
Interview Details:
Category : Manufacturers, Suppliers, Distributors, End Users, Experts/Associations
Average Duration : 30–60 Minutes
Interview Mode : Video calls, telephonic interviews, expert consultations
Interview Format : Structured / Semi-Structured questionnaire
Focus Areas of Primary Research:
Market Size & Forecast Validation :
Revenue estimates, volume consumption, growth rates, forecast assumptions, regional demand.
Supply Chain & Value Chain Assessment :
Raw material sourcing, supply chain challenges, distribution networks, procurement practices.
Production & Capacity Analysis :
Manufacturing capacity, utilization rates, expansion projects, plant investments.
Pricing & Cost Structure Analysis :
Product pricing trends, feedstock costs, energy costs, margin pressures, pricing outlook.
Competitive Landscape Assessment :
Market share, competitor positioning, strategic initiatives, partnerships, acquisitions.
Primary Research — Stakeholder Coverage by Category
Distribution of interview respondents across stakeholder categories (% share from PPT data)

Primary Research — Respondent Designation Profile
Seniority breakdown of interview respondents (% share from PPT data)

Primary Research — Geographic Coverage of Interviews
Regional distribution of primary research engagement (% share from PPT data)

Phase 6 — Data Triangulation and Market Validation
No single methodology is relied upon in isolation. Multiple independent estimation approaches are combined and reconciled to ensure consistency, accuracy, and analytical defensibility. Any material deviations between approaches are investigated and adjusted through additional validation cycles.
The final market size is derived through weighted triangulation of all validated methodologies. Any material deviations between approaches are investigated and adjusted through additional validation cycles. The outcome represents the most realistic assessment of the market based on available evidence and expert confirmation ensuring that volume and value estimates are fully consistent with one another.
Triangulation Framework — Input Contribution Weight
Relative weight each sizing input contributes to the final reconciled market estimate

Phase 7 — Forecast Modeling: Projecting Future Market Evolution
Forecasting evaluates the future trajectory of the market using a combination of quantitative indicators and qualitative assessments across economic, industry, and regulatory dimensions. Rather than simple extrapolation, each driver is independently modeled and integrated into a composite forecast.
Macroeconomic Indicators
GDP growth, industrial production, manufacturing output, construction activity, consumer spending, and capital investment form the quantitative foundation of long-term demand projections. These are applied at country, regional, and global levels.
Industry Growth Drivers
Urbanization, infrastructure development, industrialization, technological innovation, sustainability initiatives, and evolving product performance requirements are assessed at regional and industry levels — capturing both structural and cyclical demand drivers.
Capacity Expansion Analysis
Announced plant expansions, new manufacturing facilities, technology upgrades, and strategic investments are evaluated to determine future supply-demand dynamics and potential market tightness or oversupply situations.
Regulatory & Sustainability
Environmental regulations, chemical safety standards, emission reduction targets, circular economy initiatives, and sustainability requirements are incorporated as they often influence product adoption rates and market growth trajectories.
Scenario Forecast Range — Indexed Market Growth (Year 1–10)
Illustrative indexed growth trajectories across Base, Optimistic, and Pessimistic scenarios over a 10-year forecast horizon

Forecast Drivers — Relative Impact Score by Category
Impact score (0–100) of each driver type on chemicals & materials market forecast




Comments
Share your thoughts, ask a question, or provide feedback about this report.