
Asia-Pacific Copper Market Size and Forecast 2024 to 2034
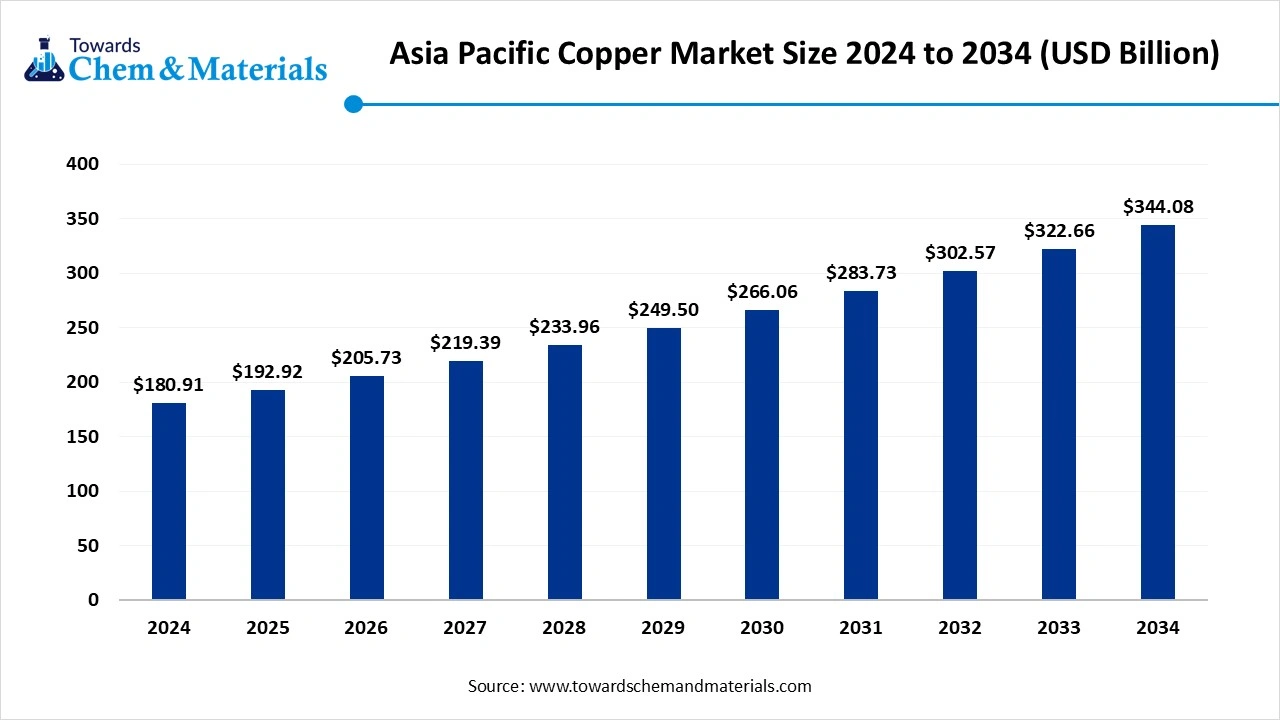
The Asia-Pacific copper market size is calculated at USD 180.91 billion in 2024, grew to USD 192.92 billion in 2025, and is projected to reach around USD 344.08 billion by 2034. The market is expanding at a CAGR of 6.64% between 2025 and 2034. The growth of the market is driven by the growing demand for copper from various industries due to rapid industrialisation and urbanization, which fuels the growth of the market.
Key Takeaways
- By product form, the wires segment dominated the market with a share of approximately 35% in 2024.
- By product form, the foil segment is expected to grow significantly in the market during the forecast period.
- By copper grade, the high-purity copper segment dominated the market with a share of approximately 40% in 2024.
- By copper grade, the oxygen-free copper segment is expected to grow in the forecast period.
- By copper processing, the mining segment dominated the market with a share of approximately 45% in 2024.
- By copper processing, the recycling segment is expected to grow in the forecast period.
- By temper, the soft segment dominated the market with a share of approximately 50% in 2024.
By temper, the extra-spring segment is expected to grow in the forecast period. - By application, the electrical & electronics segment dominated the market with a share of approximately 30% in 2024.
- By application, the renewable energy systems segment is expected to grow in the forecast period.
Market Overview
What is the significance of the Asia-Pacific Copper Market?
The market is observing and experiencing significant growth in the Asia Pacific copper market, with the growing consumer demand and demand from various industries driven by rapid urbanization and industrialization, fueling the growth of the market.
The increased adoption of electric vehicles and renewable energy sources also increases the demand for copper, especially in China and India, where there is a surge in the automotive industry, and also in demand, fueling the growth and expansion of the market in the region.
Asia Pacific Copper Market Outlook:
- Industry Growth Overview: Between 2025 and 2034, the Asia-Pacific copper market is expected to witness steady expansion, supported by strong demand from construction, electrical, electronics, and renewable energy sectors. China and India remain the dominant consumers, driven by rapid urbanization, power infrastructure upgrades, and growth in electric vehicle (EV) manufacturing.
- Sustainability Trends: Sustainability initiatives are reshaping copper production and usage across the Asia-Pacific. Smelters and refiners are adopting cleaner technologies to reduce carbon emissions and improve energy efficiency. Recycling is becoming central to supply strategies, with increasing investment in secondary copper recovery to ensure circular economy alignment.
- Regional Expansion & Investments: Leading mining and smelting companies are expanding capacity and forming strategic partnerships across China, India, Indonesia, and Australia to secure raw material supply and meet rising domestic demand. Investments in refining and processing infrastructure are increasing, particularly in Southeast Asia, to strengthen regional value chains.
Key Technological Shifts In The Asia-Pacific Copper Market:
The key technological shift in the Asia Pacific copper market is the shift towards electrification and the use of renewable energy sources due to expanding projects such as wind and solar, which increases the demand for copper wiring and copper components, boosting the growth of the market, and creating opportunities for future growth.
The deployment of 5G infrastructure is creating a greater need for high-performance, high-conductivity copper for use in cables, antennas, and other components for faster data transmission is also a factor for growth.
Report Scope
| Report Attributes | Details |
| Market Size in 2025 | USD 192.92 Billion |
| Expected Size by 2034 | USD 344.08 Billion |
| Growth Rate from 2025 to 2034 | CAGR 6.64% |
| Base Year of Estimation | 2024 |
| Forecast Period | 2025 - 2034 |
| Segment Covered | By Product Form , By Copper Grade, By Copper Processing, By Temper, By Application, |
| Key Companies Profiled | Mitsubishi Materials Corporation (Japan) , KME Group SpA (Italy) , Aurubis AG (Germany) , Wieland-Werke AG (Germany) , KGHM Polska Miedź S.A. (Poland) , Poongsan Corporation (South Korea) , Zhejiang Hailiang Co., Ltd. (China) , Chinalco Mining Corporation International (China) , Yunnan Tin Company Limited (China) , Tongling Nonferrous Metals Group Holdings Co., Ltd. (China) , Jinchuan Group International Resources Co. Ltd. (China) , Vedanta Resources Limited (India) , BHP Group (Australia) , Rio Tinto Group (Australia) , Freeport-McMoRan Inc. (USA) , Antofagasta PLC (Chile) |
Trade Analysis Of the Asia Pacific Copper Market: Import & Export Statistics
- Vietnam, China, and the United States are top global copper exporters, with China and Vietnam having significant shares in the Asia Pacific region.(Source: www.volza.com)
- Vietnam leads the world in Copper exports with 305,442 shipments, followed by China with 289,500 shipments, and the United States taking the third spot with 233,183 shipments.(Source: www.volza.com)
- China: The leading exporter of copper tubes and pipes and a significant player in wire exports.
- Malaysia and Thailand: Key exporters of copper wire and other products.
- South Korea: A major exporter, particularly noted for its growth in overall copper exports in the past decade.
- India exported 20,315 shipments of Copper from Nov 2023 to Oct 2024 (TTM).(Source: www.volza.com)
- Most of the Copper exports from India go to the United States, the United Kingdom, and Mexico.(Source: www.volza.com)
Asia Pacific Copper Market Value Chain Analysis
- Chemical Synthesis and Processing : Copper is processed and synthesised via extraction and casting.
- Key players : Hindalco Industries, Vedanta Limited, Hindustan Copper (HCL), and Freeport-McMoRan.
- Quality Testing and Certification : The copper requires IS 191:2007, IS 12444:2020, and IS 613:2000, ISO 9001 certification.
- Key players: Bureau of Indian Standards (BIS) certification
- Distribution to Industrial Users : The copper is distributed to the packaging, automotive, electronics, and construction industries.
- Key players: Sterlite Copper, Polycab India Limited, Finolex Cables Limited, and Meck Industries.
Asia Pacific Copper Regulatory Landscape: Global Regulations
| Country / Region | Regulatory Body | Key Regulations / Standards | Focus Areas | Notable Notes |
| China | Ministry of Natural Resources (MNR), Ministry of Ecology and Environment (MEE), SAC (Standardization Administration of China) | - Mineral Resources Law (Revised 2020) – governs exploration, mining rights, and resource taxation - GB/T 2059 & GB/T 5231 – copper and copper alloy product standards - Environmental Protection Law (2015) – strict emissions & waste management in smelting/refining |
- Mining & smelting licensing - Pollution control - Product quality & recycling |
China is the world’s largest copper consumer. Tight environmental and waste import restrictions (post-2021 “solid waste ban”) encourage domestic recycling and refining efficiency. |
| India | Ministry of Mines, Ministry of Environment, Forest and Climate Change (MoEFCC), Bureau of Indian Standards (BIS) | - Mines and Minerals (Development & Regulation) Act (MMDR Act, 1957; amended 2021) - IS 191 (copper for electrical applications) - Environment Protection Act, 1986 |
- Mining leases & royalty - Emission control & waste management - Electrical & industrial grade quality standards |
India focuses on responsible mining, environmental restoration, and import substitution. BIS standards govern copper purity and application-specific properties. |
| Japan | Ministry of Economy, Trade and Industry (METI), JIS (Japanese Industrial Standards), Ministry of the Environment | - JIS H 3100 & H 3250 – standards for refined copper and copper alloys - Waste Management and Public Cleansing Law - PRTR Law (Pollutant Release and Transfer Register) |
- Product quality & recycling - Hazardous emissions tracking - Sustainable resource management |
Japan emphasizes closed-loop recycling of copper scrap. METI promotes circular economy initiatives under its Green Transformation (GX) strategy. |
| Australia | Department of Industry, Science and Resources, Department of Climate Change, Energy, the Environment and Water (DCCEEW), Safe Work Australia | - Environment Protection and Biodiversity Conservation (EPBC) Act, 1999 - Work Health and Safety (WHS) Regulations - JORC Code (Joint Ore Reserves Committee) – reporting standard for exploration and mining |
- Sustainable mining practices - Worker safety - Environmental approvals & reporting |
Australia enforces one of the most transparent mining frameworks globally. JORC reporting is mandatory for listed mining firms. Focus on ESG compliance and emissions reduction. |
| Indonesia | Ministry of Energy and Mineral Resources (MEMR), Ministry of Environment and Forestry | - Mining Law No. 3/2020 – covers mineral extraction, processing, and export obligations - Government Regulation No. 96/2021 (mining implementation) - Environmental Protection and Management Law (32/2009) |
- Export restrictions on raw ore - Smelting & local value addition - Environmental impact assessments (AMDAL) |
Indonesia bans the export of unprocessed copper ore to promote domestic smelting (e.g., Freeport Indonesia, Amman Mineral). Environmental compliance is critical for license retention. |
Segmental Insights
Product Form Insights
How Did Wires Segment Dominated The Asia Pacific Copper Market In 2024?
The wires segment dominated the Asia Pacific copper market with a share of approximately 35% in 2024. Copper wires represent the largest share of the Asia Pacific market due to their wide use in power transmission, distribution, and industrial automation systems. Their excellent conductivity, flexibility, and durability make them indispensable in the construction, energy, and automotive sectors. With the rapid expansion of smart cities and renewable energy grids, demand for high-performance copper wiring continues to surge across developing economies like India, Vietnam, and Indonesia.
The foil segment expects significant growth in the market during the forecast period. Copper foils are witnessing rising demand in electronics, lithium-ion batteries, and photovoltaic (solar) applications. The increasing production of electric vehicles and consumer electronics in China, Japan, and South Korea is fueling foil usage. These ultra-thin copper layers are key in printed circuit boards (PCBs) and energy storage devices, driving technological innovation and performance efficiency. Foil manufacturing is also benefiting from continuous investments in battery gigafactories across the region.
Copper Grade Insights
Which Copper Grade Segment Dominated The Asia Pacific Copper Market In 2024?
The high-purity copper segment dominated the market with a share of approximately 40% in 2024. High-purity copper is widely adopted for applications requiring superior electrical and thermal conductivity, such as in cables, transformers, and semiconductors. Its role in supporting industrial electrification and advanced manufacturing processes is critical. With regional economies focusing on smart infrastructure development, demand for high-purity copper in the power sector and electronics assembly has increased, supported by government-backed electrification and industrial modernization initiatives.
The oxygen-free copper segment expects significant growth in the Asia Pacific copper market during the forecast period. Oxygen-free copper (OFC) is gaining traction for high-frequency and precision electronic applications. The material’s ultra-low oxygen content enhances signal transmission and corrosion resistance, making it suitable for automotive electronics, aerospace systems, and telecommunications equipment. Japan and South Korea are at the forefront of OFC innovation, driven by their sophisticated semiconductor and 5G component industries. The trend toward high-speed data transfer and miniaturized circuits further strengthens OFC demand in the Asia Pacific.
Copper Processing Insights
How Did Mining Segment Dominated The Asia Pacific Copper Market In 2024?
The mining segment dominated the market with a share of approximately 45% in 2024. Mining remains the backbone of copper production in the Asia Pacific, with major output from China, Indonesia, and Mongolia. These countries collectively contribute a significant share of global copper supply, feeding the region’s manufacturing and infrastructure needs.
Investment in new mines and extraction technologies is increasing to ensure supply stability amid rising global consumption, especially for electric vehicles and renewable energy systems.
The recycling segment expects significant growth in the Asia Pacific copper market during the forecast period. Recycling is emerging as a sustainable and cost-effective alternative to primary copper production. Governments across the Asia Pacific are encouraging metal recovery from end-of-life electronics and industrial scrap to minimize environmental impact. The expansion of urban mining facilities in China, Japan, and India is strengthening regional supply chains, reducing carbon emissions, and aligning with global circular economy and resource efficiency goals.
Temper Insights
Which Temper Segment Dominated The Asia Pacific Copper Market In 2024?
The soft segment dominated the market with a share of approximately 50% in 2024. Soft copper is highly preferred in electrical wiring, plumbing, and cabling applications due to its flexibility and easy formability. Its malleable nature enables installation across diverse construction and industrial settings. The ongoing expansion of residential housing and urban infrastructure projects in emerging economies continues to boost demand for soft copper. Manufacturers are also focusing on improving alloy quality to ensure long-term durability and corrosion resistance.
The extra-spring segment expects significant growth in the market during the forecast period. Extra spring copper provides enhanced tensile strength and elasticity, making it ideal for connectors, switches, and precision engineering components. The material is increasingly used in automotive, aerospace, and electronics manufacturing, where performance and reliability are paramount. As industries move toward lightweight and compact designs, extra spring copper’s mechanical resilience and conductivity advantages position it as a preferred material for next-generation components.
Application Insights
How Did Electrical And Electronics Segment Dominated The Asia Pacific Copper Market In 2024?
The electrical & electronics segment dominated the market with a share of approximately 30% in 2024. The electrical and electronics segment dominates the market, driven by rapid industrialization and digital transformation. Copper is integral to producing motors, transformers, cables, and consumer devices, with China, Japan, and South Korea serving as global manufacturing hubs. The growth of semiconductor fabrication, home appliances, and telecom equipment further boosts copper consumption, making the sector one of the largest regional demand drivers.
The renewable energy systems segment expects significant growth in the market during the forecast period. The renewable energy sector is emerging as a strong growth frontier for copper demand. Copper’s superior conductivity and corrosion resistance make it essential in solar panels, wind turbines, and electric vehicle infrastructure. With countries such as India, China, and Australia ramping up clean energy investments and grid modernization, copper’s role as a critical enabler of the energy transition continues to strengthen across the Asia Pacific region.
Country Analysis
China Has Seen Growth In The Market, Driven By The Vast Manufacturing Sector In The Country.
China dominates the market, accounting for a major share of global consumption due to its vast manufacturing, electronics, and construction industries. The country’s focus on renewable energy expansion, electric vehicles, and grid modernization continues to drive copper demand. State-led investments in smart infrastructure and energy storage systems further strengthen its market position. Additionally, China’s advancements in copper recycling and refining technologies enhance supply chain stability and sustainability.
India Has Seen Growth In The Market, Driven By Rising Demand From Various Industries.
India’s copper market is witnessing steady growth, driven by rising demand from the electrical, construction, and renewable energy sectors. Increasing infrastructure development, government-backed initiatives like Make in India, and the rapid adoption of electric vehicles and solar energy projects are boosting copper consumption. Domestic refiners such as Hindalco and Vedanta are expanding capacities to meet growing demand, while recycling and circular economy practices are gaining traction to reduce import dependence.
Country-level Investments & Funding Trends for the Asia-Pacific Copper Industry:
- Chinese companies, backed by state-owned lenders, are heavily investing in copper and cobalt mines in countries like Peru and the Democratic Republic of Congo (DRC).(Source: www.aiddata.org)
- As a major integrated producer, Hindalco is making large investments in its copper business. The company is expanding its Dahej smelter by 300,000 TPA, making it one of the largest single-location copper smelters outside of China.
- JSW Group: The company has committed ₹2,600 crore toward investments in copper mines in Jharkhand.
- Provides financing to facilitate imports of copper concentrates from countries like Chile for Japanese manufacturers.(Source: www.jbic.go.jp)
Recent Developments
- In October 2025, Hindustan Copper Limited (HCL) launched an e-Office system as part of India's Digital India initiative to enhance internal operations through a paperless, efficient, transparent, and accountable work environment.(Source: www.facebook.com)
- In April 2025, Adani Enterprises launched the initial phase of its Kutch Copper complex in Mundra, Gujarat, which is planned to become the world's largest single-location copper smelter. The smelter began processing ores in April 2025 with an initial annual capacity of 500,000 tonnes and aims to expand to 1 million tonnes per annum by 2029.(Source : www.adanienterprises.com)
Top players in the Asia Pacific Copper Market & Their Offerings:
- Jiangxi Copper Corporation (China): It is China's largest integrated copper producer. Jiangxi Copper has a significant presence across the entire value chain, including mining, smelting, and processing.
- Sumitomo Metal Mining Co., Ltd. (Japan): A major Japanese player in copper production with a strong presence in the Asia Pacific market.
- Hindalco Industries Limited (India): A leading copper producer in India, Hindalco is a major player in the refining and manufacturing segment.
- Hailiang Group (China): One of the world's largest producers of copper and copper-alloy products, with multiple production bases throughout Asia.
Other Top Players Are
- Mitsubishi Materials Corporation (Japan)
- KME Group SpA (Italy)
- Aurubis AG (Germany)
- Wieland-Werke AG (Germany)
- KGHM Polska Miedź S.A. (Poland)
- Poongsan Corporation (South Korea)
- Zhejiang Hailiang Co., Ltd. (China)
- Chinalco Mining Corporation International (China)
- Yunnan Tin Company Limited (China)
- Tongling Nonferrous Metals Group Holdings Co., Ltd. (China)
- Jinchuan Group International Resources Co. Ltd. (China)
- Vedanta Resources Limited (India)
- BHP Group (Australia)
- Rio Tinto Group (Australia)
- Freeport-McMoRan Inc. (USA)
- Antofagasta PLC (Chile)
Segments Covered:
By Product Form
- Wires
- Plates
- Sheets
- Strips
- Rods
- Bars & Sections
- Tubes
- Pipes
- Cathodes
- Foil
By Copper Grade
- High Purity Copper
- Oxygen-Free Copper
- Electrolytic Tough Pitch (ETP) Copper
- Alloyed Copper
By Copper Processing
- Mining
- Extraction & Electrorefining
- Purification & Alloying
- Recycling
By Temper
- Soft
- Half-Hard
- Hard-Spring
- Extra-Spring
By Application
- Electrical & Electronics
- Power Generation & Transmission
- Automotive & Transportation
- Industrial Machinery
- Renewable Energy Systems
- Consumer Goods
A Seven-Phase Framework
Our methodology is designed to be universally applicable across commodity chemicals, specialty chemicals, petrochemicals, construction chemicals, coatings, electronic chemicals, industrial gases, agrochemicals, water treatment chemicals, and performance materials. Each phase builds upon the last, creating a layered validation structure that minimizes estimation error and maximizes analytical confidence.
The framework ensures comprehensive market coverage, robust cross-validation, and reliable long-term forecasting — producing market estimates that withstand scrutiny from investors, regulators, and corporate strategy teams.

Seven-Phase Framework — Analytical Effort Distribution
Relative analytical effort allocated across each phase of the Chemicals & Materials research framework

Phase 1 - Secondary Research: Establishing the Foundation
Secondary research collects and evaluates publicly available information from authoritative sources, establishing the foundational understanding of market structure, value chain dynamics, competitive landscape, and end-use demand patterns. Every source is evaluated for credibility, recency, geographic relevance, and methodological soundness before inclusion.
Industry Associations
Sources include ACC, CEFIC, ICCA, JCIA, CPCIF, and SOCMA providing production volumes, consumption trends, capacity developments, and sustainability initiatives.
Company Disclosures
Annual reports, investor presentations, earnings transcripts, and regulatory filings reveal product portfolios, manufacturing footprints, capacity expansions, and revenue segmentation.
Government Databases
National statistical offices, customs authorities, environmental agencies, and industrial production databases provide verified statistics on output, trade flows, and regulatory compliance.
Trade Databases
UN Comtrade, ITC, Eurostat, and national customs authorities enable assessment of global product movement, import dependency, and export competitiveness across regions.
Our Secondary Research Sources
- Ministry of Chemicals and Fertilizers
- European Chemicals Agency
- United States Department of Energy
- Ministry of Industry and Information Technology
- Ministry of Economy Trade and Industry
- Ministry of Trade Industry and Energy
- National Institute of Standards and Technology
- Council of Scientific and Industrial Research
- Fraunhofer Society
- National Institute for Materials Science
Phase 2 — Supply-Side Assessment: Mapping Production Capabilities
Production Capacity Analysis
All major manufacturers are assessed for existing installed capacity, planned additions, expansions, new plant announcements, and technology adoption — mapped at global, regional, and country levels.
Capacity Utilization Adjustment
Installed capacity is adjusted using utilization rates based on demand conditions, feedstock availability, plant operating rates, maintenance schedules, and regulatory restrictions.
Manufacturer Revenue Analysis
Product-specific revenues, segment-level performance, regional distribution, average selling prices, and margin trends are evaluated to establish market value estimates.
Supply-Side Assessment — Capacity vs. Effective Production by Region
Illustrative comparison of installed capacity vs. effective production volume (after utilization rate adjustment) across major regions

Phase 3 — Demand-Side Assessment: Quantifying Chemical Consumption
Demand-side analysis quantifies chemical consumption across industries, applications, and geographies — identifying where and how chemicals are consumed throughout the value chain with precision.
End-Use Industry Analysis
Chemical demand is evaluated across automotive, construction, packaging, electronics, agriculture, healthcare, consumer goods, industrial manufacturing, energy and utilities, and water treatment. Industry output, production trends, and consumption intensity are analyzed to determine demand patterns.
Consumption Modeling
Demand is estimated using measurable indicators: kilograms per vehicle, kilograms per square meter of construction, dosage per cubic meter of water treated, kilograms per hectare of agricultural land, and kilograms per ton of manufactured products. Consumption factors are validated through industry publications and primary interviews.
Application Analysis
The market is segmented by application area to understand product performance requirements, formulation trends, technology adoption, customer preferences, and regulatory requirements improving demand accuracy and segmentation granularity.
Demand-Side Assessment — End-Use Industry Demand Distribution
Illustrative distribution of chemical & materials demand across key end-use industries

Phase 4 - Trade Flow Analysis: Balancing Regional Supply and Demand
Trade flow analysis reconciles regional supply and demand estimates through import and export data, identifying net supply positions, regional dependencies, and market imbalances. It serves as an independent validation layer that tests the consistency of supply-side and demand-side estimates.
Import Analysis
Import data is evaluated to determine volumes, source countries, product dependency, regional supply gaps, and pricing trends — identifying markets that rely heavily on external supply and where domestic production is insufficient to meet demand.
Export Analysis
Export assessments reveal production surplus, export competitiveness, regional manufacturing strength, and global market participation. Export patterns also help validate domestic production estimates and identify net exporting regions.
Apparent Consumption Model
Regional consumption is assessed using the standard apparent consumption formula:
Results identify net importing regions, net exporting regions, regional deficits, and surpluses — serving as an independent validation of supply and demand estimates.
Trade Flow Analysis — Net Supply Position by Region
Illustrative apparent consumption vs. domestic production across major regions — positive gap indicates net import dependency

Phase 5 — Primary Research: The Critical Validation Layer
Primary research tests and refines findings from secondary research through direct engagement with industry participants across the supply chain, demand side, and expert community. It captures intelligence that no database or published report can provide — the real-world experience of manufacturers, buyers, and specialists operating in the market.

Supply-Side Interviews
Conversations with chemical manufacturers, raw material suppliers, contract manufacturers, technology providers, and plant operators cover production trends, capacity utilization, pricing developments, technology shifts, and competitive dynamics.

Demand-Side Interviews
Engagement with OEMs, industrial consumers, procurement managers, distributors, formulators, and end-use manufacturers focuses on consumption trends, purchasing behavior, product substitution, demand outlook, and emerging applications.

Industry Expert Consultations
Additional interviews with industry consultants, independent experts, regulatory specialists, technical professionals, and research institutions provide deeper market context and validate key analytical assumptions.
Focus Areas of Primary Research:
Market Size & Forecast Validation
Revenue estimates, volume consumption, growth rates, forecast assumptions, regional demand.Supply Chain & Value Chain Assessment
Raw material sourcing, supply chain challenges, distribution networks, procurement practices.Production & Capacity Analysis
Manufacturing capacity, utilization rates, expansion projects, plant investments.Pricing & Cost Structure Analysis
Product pricing trends, feedstock costs, energy costs, margin pressures, pricing outlook.Competitive Landscape Assessment
Volume and value estimates confirmed to be fully consistent with one another before publicationInterview Volume by Market Scope
| Study Scope | Number of Interviews |
|---|---|
| Niche Market | 20 – 30 |
| Mid-Sized Market | 30 – 50 |
| Global Market | 50 – 80 |
| Highly Fragmented Market | 80 – 120 |
Interview Details:
Category : Manufacturers, Suppliers, Distributors, End Users, Experts/Associations
Average Duration : 30–60 Minutes
Interview Mode : Video calls, telephonic interviews, expert consultations
Interview Format : Structured / Semi-Structured questionnaire
Focus Areas of Primary Research:
Market Size & Forecast Validation :
Revenue estimates, volume consumption, growth rates, forecast assumptions, regional demand.
Supply Chain & Value Chain Assessment :
Raw material sourcing, supply chain challenges, distribution networks, procurement practices.
Production & Capacity Analysis :
Manufacturing capacity, utilization rates, expansion projects, plant investments.
Pricing & Cost Structure Analysis :
Product pricing trends, feedstock costs, energy costs, margin pressures, pricing outlook.
Competitive Landscape Assessment :
Market share, competitor positioning, strategic initiatives, partnerships, acquisitions.
Primary Research — Stakeholder Coverage by Category
Distribution of interview respondents across stakeholder categories (% share from PPT data)

Primary Research — Respondent Designation Profile
Seniority breakdown of interview respondents (% share from PPT data)

Primary Research — Geographic Coverage of Interviews
Regional distribution of primary research engagement (% share from PPT data)

Phase 6 — Data Triangulation and Market Validation
No single methodology is relied upon in isolation. Multiple independent estimation approaches are combined and reconciled to ensure consistency, accuracy, and analytical defensibility. Any material deviations between approaches are investigated and adjusted through additional validation cycles.
The final market size is derived through weighted triangulation of all validated methodologies. Any material deviations between approaches are investigated and adjusted through additional validation cycles. The outcome represents the most realistic assessment of the market based on available evidence and expert confirmation ensuring that volume and value estimates are fully consistent with one another.
Triangulation Framework — Input Contribution Weight
Relative weight each sizing input contributes to the final reconciled market estimate

Phase 7 — Forecast Modeling: Projecting Future Market Evolution
Forecasting evaluates the future trajectory of the market using a combination of quantitative indicators and qualitative assessments across economic, industry, and regulatory dimensions. Rather than simple extrapolation, each driver is independently modeled and integrated into a composite forecast.
Macroeconomic Indicators
GDP growth, industrial production, manufacturing output, construction activity, consumer spending, and capital investment form the quantitative foundation of long-term demand projections. These are applied at country, regional, and global levels.
Industry Growth Drivers
Urbanization, infrastructure development, industrialization, technological innovation, sustainability initiatives, and evolving product performance requirements are assessed at regional and industry levels — capturing both structural and cyclical demand drivers.
Capacity Expansion Analysis
Announced plant expansions, new manufacturing facilities, technology upgrades, and strategic investments are evaluated to determine future supply-demand dynamics and potential market tightness or oversupply situations.
Regulatory & Sustainability
Environmental regulations, chemical safety standards, emission reduction targets, circular economy initiatives, and sustainability requirements are incorporated as they often influence product adoption rates and market growth trajectories.
Scenario Forecast Range — Indexed Market Growth (Year 1–10)
Illustrative indexed growth trajectories across Base, Optimistic, and Pessimistic scenarios over a 10-year forecast horizon

Forecast Drivers — Relative Impact Score by Category
Impact score (0–100) of each driver type on chemicals & materials market forecast




Comments
Share your thoughts, ask a question, or provide feedback about this report.