
3D Printing Construction Market Size Analysis Report 2035
The global 3D printing construction market size is calculated at USD 3.59 billion in 2025 and is predicted to increase from USD 6.52 billion in 2026 and is projected to reach around USD 1,389.08 billion by 2035, The market is expanding at a CAGR of 81.44% between 2025 and 2035. Asia Pacific dominated the 3D printing construction market with a market share of 46.50% the global market in 2024. The market's growth is driven by factors such as reduced waste, lower labour costs, and increased design freedom.
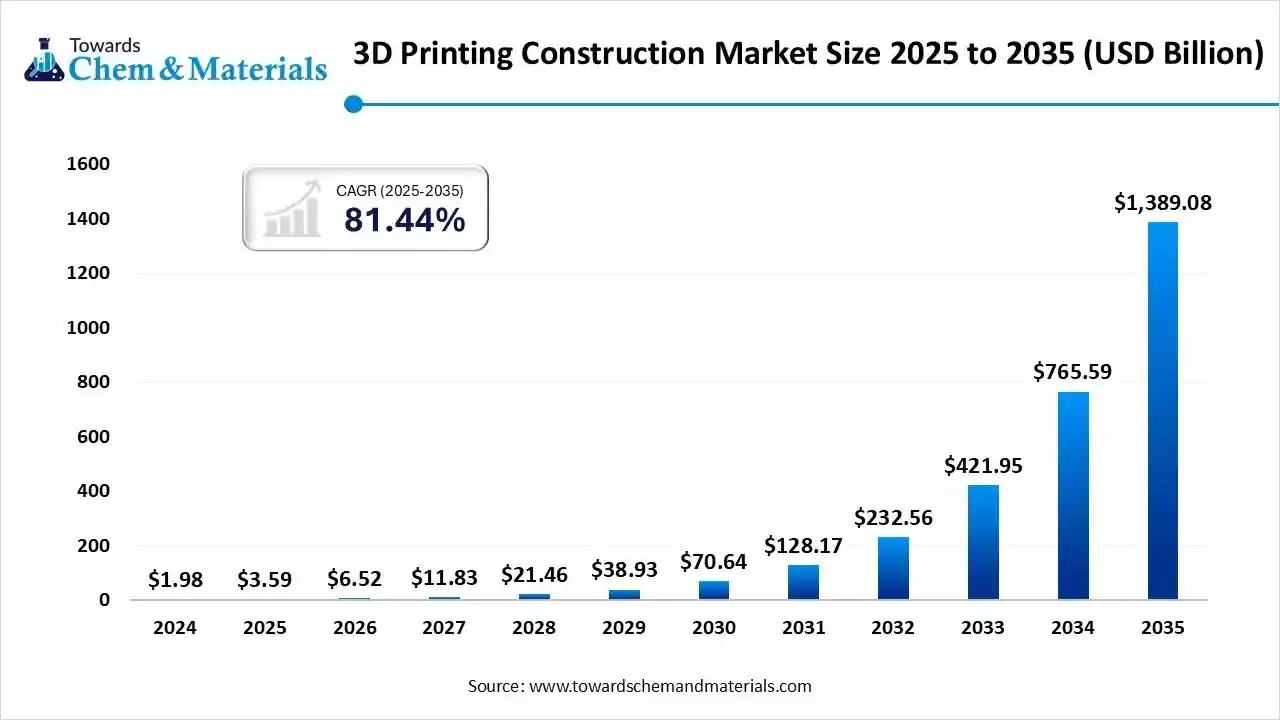
Key Takeaway
- By region, Asia Pacific dominated the market with a share of 46.5% in 2024.
- By region, Europe is expected to have significant growth in the market in the forecast period.
- By method/technology, the extrusion-based segment dominated the market with a share of 56.8% in 2024.
- By method/technology, the powder bonding segment is expected to grow significantly in the 3D printing construction market during the forecast period.
- By material type, the concrete segment dominated the market with a share of 56.4% in 2024.
- By material type, the composite segment is expected to grow in the forecast period.
- By application/end-use, the building segment dominated the market with a share of 75.5% in 2024.
- By application/end-use, the infrastructure segment is expected to grow in the forecast period.
- By construction form, the on-site segment dominated the 3D printing construction sector with a share of 72.3% in 2024.
- By construction form, the off-site/ prefabrication segment is expected to grow in the forecast period.
What Is the Significance of the 3D Printing Construction Market?
The 3D printing construction market encompasses the use of additive manufacturing techniques to build structural and architectural components, from walls and modules to full buildings and infrastructure elements, by layering materials such as concrete, metal, polymers, or composites. It enables rapid, customised, and sustainable construction solutions, reducing waste, labour, and lead times. Key applications span residential, commercial, industrial, and public-works projects, with large-format printers, site-based systems, and prefabricated modules driving adoption.
3D Printing Construction
- Industry Growth Overview: Between 2025 and 2034, the 3D printing construction industry is projected to grow rapidly, driven by the rising adoption of additive manufacturing technologies in housing, infrastructure, and commercial projects. Demand is fueled by faster build times, reduced labour costs, and design flexibility compared to conventional construction methods.
- Sustainability Trends: Sustainability is a core growth catalyst, with 3D printing enabling material efficiency and reduced construction waste. Companies are increasingly using low-carbon, recyclable, and bio-based concrete formulations to minimise environmental impact. On-site 3D printing also reduces transportation emissions and resource use.
- Global Expansion & Innovation: Major construction and technology firms are expanding their 3D printing capabilities through partnerships and pilot projects focused on scalable, automated building solutions. Governments and developers are investing in large-scale 3D printed housing, bridges, and infrastructure to address urbanisation and sustainability challenges.
Report Scope
| Report Attributes | Details |
| Market Size in 2026 | USD 6.52 Billion |
| Expected Size by 2035 | USD 1,389.08 Billion |
| Growth Rate from 2025 to 2035 | CAGR 81.44% |
| Base Year of Estimation | 2024 |
| Forecast Period | 2026 - 2035 |
| Leading Region | Asia Pacific |
| Fastest Growing Region | Europe |
| Segment Covered | By Method / Technology, By Material Type, By Application / End-Use , By Construction Form |
| Key Companies Profiled | Apis Cor, COBOD International A/S, Contour Crafting Corporation, CyBe Construction B.V., ICON Technology, Inc., MX3D, Sika AG, WASP S.r.l. (World’s Advanced Saving Project), XtreeE, Yingchuang Building Technique Co., Ltd. (Winsun), Monolite UK (D-Shape) , Total Kustom , Imprimere AG., Branch Technology |
Key Technological Shifts In The 3D Printing Construction Market:
Key technological shifts in the 3D printing construction industry include the integration of AI and advanced robotics for greater precision and automation, the development of new sustainable materials like geopolymer concrete and recycled aggregates, and the use of digital twin platforms for real-time monitoring and lifecycle management. Other significant shifts involve the expansion of modular components for prefabrication and faster assembly, as well as improved sensor technology to ensure quality control.
Trade Analysis Of 3D Printing Construction Market: Import & Export Statistics
- According to Volza's Global Export data, the World exported 66 shipments of 3d Printing machines from Apr 2024 to Mar 2025 (TTM). These exports were made by 19 Exporters to 19 Buyers, marking a 164% growth rate compared to the preceding twelve months.
- Most of the 3d Printing Machine exports from the World go to the United States, Vietnam, and the Dominican Republic.
- Globally, the top three exporters of 3d Printing machines are China, the United States, and Vietnam. China leads the world in 3D printing machine exports with 35 shipments, followed by the United States with 26 shipments, and Vietnam in third place with 20 shipments.
(Source: www.volza.com) - According to Volza's United States Export data, the United States exported 188 shipments of 3d printers from Sep 2023 to Aug 2024 (TTM). These exports were made by 78 United States exporters to 40 Buyers
- Most of the 3d Printer exports from the United States go to Ecuador, India, and Peru.
- Globally, the top three exporters of 3d printers are China, the United States, and South Korea. China leads the world in 3D printer exports with 8,825 shipments, followed by the United States with 756 shipments, and South Korea in third place with 235 shipments.(Source: www.volza.com)
3D Printing Construction Market Value Chain Analysis
- Chemical Synthesis and Processing :3D printing in construction involves automated layering of materials such as concrete, polymers, composites, and geopolymer mixtures through extrusion, powder bonding, or additive manufacturing techniques to build structural components directly on-site or off-site.
- Key players : ICON Technology, COBOD International A/S, Apis Cor, Winsun Building Technique Co. Ltd., PERI SE.
- Quality Testing and Certification :3D-printed structures undergo testing for compressive strength, dimensional accuracy, material consistency, and safety compliance, in accordance with ISO 9001, ASTM C39, and local building codes.
- Key players: ASTM International, SGS, TÜV SÜD, Bureau Veritas.
- Distribution to Industrial Users :3D printing construction solutions are provided to residential, commercial, and infrastructure projects through direct partnerships with builders, contractors, and technology providers..
- Key players: ICON Technology, COBOD International A/S, Apis Cor, PERI SE.
3D Printing Construction Regulatory Landscape: Global Regulations
| Country / Region | Regulatory Body | Key Regulations / Standards | Focus Areas | Notable Notes |
| United States | International Code Council (ICC) ASTM International Occupational Safety and Health Administration (OSHA) National Institute of Standards and Technology (NIST) |
- ICC AC509: Acceptance Criteria for 3D-Printed Construction - ASTM F42 Standards (e.g., F2792, F3122, F3091) - OSHA 1926 Construction Safety Standards - NIST Additive Manufacturing Frameworks |
- Structural integrity and safety - Material qualification and process validation - Workforce safety and equipment compliance |
ICC AC509 (2022) provides the first framework for approval of 3D-printed walls and structures under building codes. ASTM F42 guides material and process validation. NIST promotes digital twin integration and performance monitoring standards. |
| European Union | European Committee for Standardisation (CEN) European Construction Products Regulation (CPR) European Commission (DG GROW) |
- EN 1090-2 / EN 1992 (Eurocode 2) for structural concrete - ISO/ASTM 52900:2021 for additive manufacturing terminology - REACH & Construction Products Regulation (EU No 305/2011) |
- Structural safety and conformity assessment - Environmental compliance of materials - Standardisation of AM terminology |
The EU is developing CEN/TC 442 Additive Manufacturing standards. 3D printed concrete must meet Eurocode performance benchmarks and CE marking for conformity. REACH applies to printing binders and admixtures. |
| China | Ministry of Housing and Urban-Rural Development (MOHURD) Standardisation Administration of China (SAC) |
- GB 50010 (Concrete Structure Design Code) - GB/T 51233–2016: Technical Standard for 3D Printing in Construction - GB 18588–2001 (Construction Material Safety) |
- Quality and safety of printed structures - Material certification and testing - Environmental safety and emissions |
China issued GB/T 51233, the world’s first national 3D printing construction standard, addressing mix design, mechanical properties, and printing tolerances. Local provinces (Shanghai, Suzhou) have pilot certification frameworks for 3D-printed buildings. |
| India | Bureau of Indian Standards (BIS) Central Public Works Department (CPWD) Ministry of Housing and Urban Affairs (MoHUA) |
- IS 456:2000 (Plain & Reinforced Concrete Code) - Draft IS Code for 3D Printed Concrete Structures (2023) - National Building Code (NBC 2016) |
- Structural validation and safety testing - Material quality and layer bonding - Sustainability and affordable housing standards |
BIS is developing dedicated codes for 3D printed structures aligned with global ASTM/ISO standards. India’s National Strategy for Additive Manufacturing (2022) promotes pilot projects for low-cost housing and infrastructure. |
| Middle East (UAE, Saudi Arabia) | Dubai Municipality Saudi Standards, Metrology and Quality Org. (SASO) |
- Dubai 3D Printing Strategy (2016) - Municipal Code for 3D Printed Buildings (2019) - SASO Building Material Standards |
- Certification of 3D printed buildings - Sustainability and local material use - Structural validation |
Dubai mandates that 25% of new buildings be 3D printed by 2030. Municipal guidelines require structural testing and approval for concrete mixes and 3D printing systems. Saudi Arabia is testing 3D printed villas for Vision 2030 housing. |
Segmental Insights
Method/Technology Insights
Which Method/Technology Segment Dominated The 3D Printing Construction Sector In 2024?
The extrusion-based segment dominated the 3D printing construction sector, accounting for 56.8% of the market in 2024. Extrusion-based 3D printing dominates the construction market because it enables precise, layer-by-layer deposition of concrete or composite materials to build walls and structural components. It is widely adopted for residential and commercial projects due to its cost-efficiency, scalability, and reduced labour dependency.
The powder bonding segment is expected to see significant growth in the 3D printing construction industry during the forecast period. Powder bonding technology, which uses binders to solidify powdered materials such as sand or metal, is gaining traction for producing complex architectural elements, decorative structures, and prefabricated building components, offering high design flexibility and material efficiency.
Material Type Insights
How Did the Concrete Segment Dominated The 3D Printing Construction Market In 2024?
- The concrete segment dominated the 3D printing construction market, accounting for a 56.4% share in 2024. Concrete is the most widely used material in 3D printing construction due to its structural strength, availability, and compatibility with large-scale extrusion systems. It enables durable, rapid, and sustainable construction of residential and commercial buildings.
- The composite segment expects significant growth in the 3D printing construction market during the forecast period. Composite materials, combining polymers and fibres, are preferred for lightweight structural components, offering improved thermal and mechanical properties.
- The metal segment has seen notable growth in the 3D printing construction industry. Metal-based 3D printing, though less common, is emerging for specialised infrastructure, bridges, and high-performance architectural designs where strength and precision are critical.
Application/End Use Insights
Which Application/End-Use Segment Dominated The 3D Printing Construction Market In 2024?
- The building segment dominated the 3D printing construction market, accounting for a 75.5% share in 2024. Building construction remains the largest application segment, including residential, commercial, and institutional projects. 3D printing enables faster project completion, customisation, and sustainable material use in housing and office structures.
- The infrastructure segment expects significant growth in the 3D printing construction industry during the forecast period. Infrastructure applications, such as bridges, public installations, and urban furniture, are increasingly utilising 3D printing to enhance durability, reduce costs, and drive design innovation. Governments and private entities are adopting the technology to modernise infrastructure with minimal material waste and reduced carbon footprint.
Construction Form Insights
How Did On-Site Segment Dominate The 3D Printing Construction Sector In 2024?
- The on-site segment dominated the 3D printing construction sector, accounting for a 72.3% share in 2024. On-site 3D printing involves constructing buildings directly at the project location using mobile robotic printers, offering flexibility, reduced logistics, and time efficiency for large-scale housing and infrastructure projects. It is ideal for remote or disaster-prone areas.
- The off-site segment expects significant growth in the 3D printing construction market during the forecast period. Off-site 3D printing, or prefabrication, involves printing building components in controlled factory environments and assembling them onsite. This method ensures high precision, consistent quality, and reduced environmental impact, making it popular for modular and repetitive construction projects.
Regional Analysis
The Asia Pacific 3D printing construction market size was valued at USD 1.63 billion in 2025 and is expected to surpass around USD 632.73 billion by 2035, expanding at a compound annual growth rate (CAGR) of 81.51% over the forecast period from 2025 to 2035. Asia Pacific dominated the market, accounting for 46.5% in 2024.
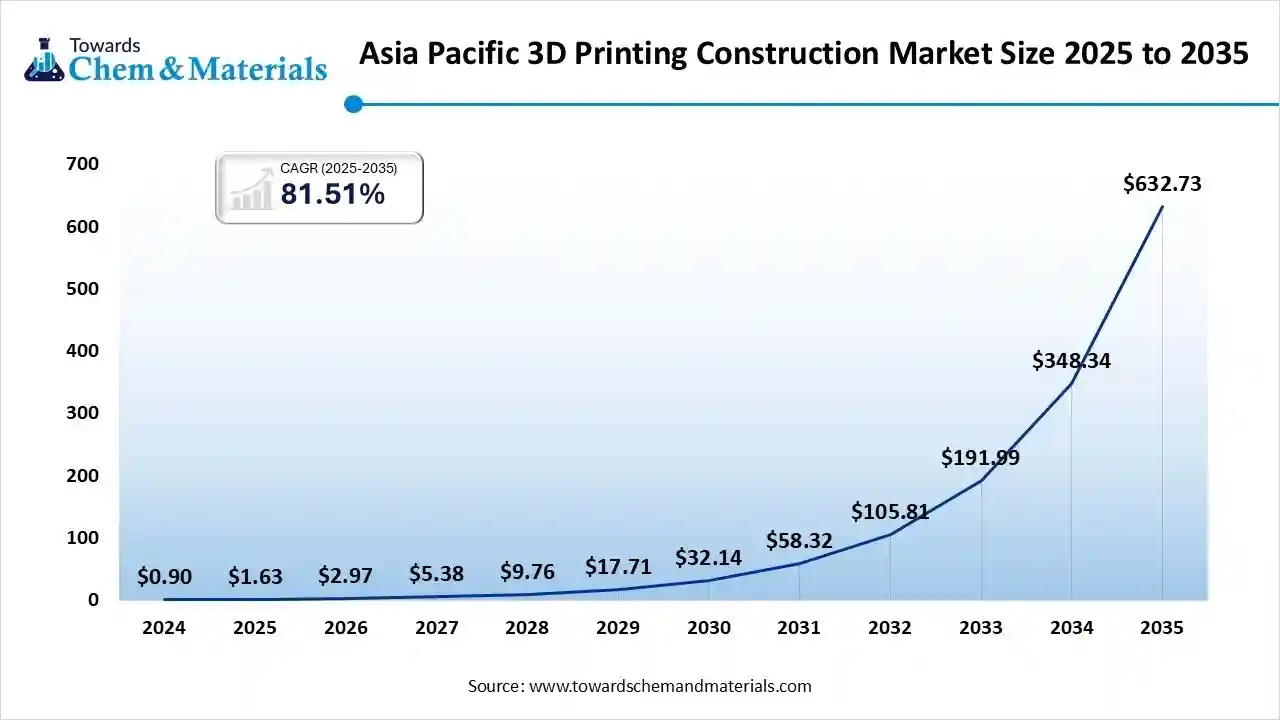
The Asia Pacific 3D printing construction industry is witnessing rapid growth driven by large-scale infrastructure development, urbanisation, and supportive government policies that promote construction automation. Countries like China, Japan, and India are adopting 3D printing to address housing shortages and reduce construction costs. The region’s focus on sustainable and modular building solutions drives market adoption. Increasing investments from private and public sectors in research and large-scale pilot projects, such as 3D-printed bridges and affordable homes, are accelerating technology penetration. The availability of cost-effective raw materials further strengthens the region’s competitive edge.
India Has Seen Significant Growth Driven By Rising Demand
India is emerging as a significant player in the 3D printing construction market, driven by initiatives promoting smart cities and affordable housing. Government support for innovation, along with partnerships between startups and construction companies, is enhancing technology adoption. Indian firms are experimenting with 3D printing for low-cost residential projects, disaster-resistant structures, and rapid prototyping. The focus on sustainable materials such as recycled concrete and geopolymer cement supports eco-friendly construction goals. Increasing awareness and collaboration with academic institutions are creating a favourable ecosystem for expanding 3D construction capabilities nationwide.
Europe Has Seen Growth Driven By Sustainability Initiatives
Europe is expected to have significant growth in the market in the forecast period. Europe represents one of the most mature markets for 3D printing construction, driven by a strong emphasis on sustainability, precision, and advanced technology integration. Countries like the Netherlands, Germany, and Denmark are leading in commercial-scale 3D-printed buildings and infrastructure projects. The region’s stringent energy and environmental standards encourage the adoption of additive manufacturing to reduce waste and carbon emissions. Investment in R&D and collaborative initiatives between construction firms and tech startups is accelerating innovation. Europe’s focus on digital transformation and smart manufacturing also supports the growth of automated construction processes.
United Kingdom (UK): 3D Printing Construction Market: High Government Investments
The UK 3D printing construction market is expanding rapidly, supported by government investments in infrastructure modernisation and net-zero building initiatives. Leading universities and technology firms are driving innovation in large-scale additive manufacturing techniques. The country’s focus on reducing construction time and cost while ensuring sustainability aligns well with 3D printing adoption. Pilot projects involving printed homes, office structures, and public infrastructure demonstrate increasing confidence in the technology. The rise of modular and digital construction ecosystems further enhances the UK’s position as a European hub for 3D construction innovation.
North America Has Seen Growth Due To the Presence Of a Strong Technological Infrastructure
North America holds a prominent position in the 3D printing construction industry, led by strong technological infrastructure, innovative startups, and high R&D investments. The region benefits from early adoption of advanced materials and automation technologies in the construction industry. Demand for sustainable and cost-efficient housing, coupled with labour shortages, is fueling growth. The region also emphasises disaster-resilient, rapid-construction solutions using concrete-based 3D printing. Collaboration between material scientists, construction firms, and technology providers strengthens the ecosystem. Growing investment from public agencies supports the development of 3D-printed housing communities.
The United States (US) Is Experiencing Growth Driven By Advanced Building Solutions
The United States is the largest market in North America for 3D printing construction, with extensive research activity and commercialisation of advanced building solutions. Major players are pioneering large-scale housing projects, defence infrastructure, and space-related construction applications. Federal and state-level initiatives promoting sustainable and affordable housing support widespread adoption. The integration of AI, robotics, and 3D printing technologies enhances construction precision and reduces waste. Partnerships between private firms and universities continue to expand the market’s innovation landscape. The U.S. also leads in developing new printable materials and scalable automation systems.
South America 3D Printing Construction Sector Growing Trends
South America’s 3D printing construction sector is gaining momentum, driven by the need for affordable housing and infrastructure modernisation. Governments across the region are recognising 3D printing as a solution to housing deficits and challenges posed by rapid urbanisation. Brazil, Chile, and Argentina are seeing pilot projects in low-cost housing using locally available materials. Despite challenges related to cost and technical expertise, increasing investment in technology transfer and sustainable building practices is fostering gradual market growth. Regional focus on eco-friendly construction aligns with the adoption of additive manufacturing methods.
Argentina 3D Printing Construction Market Growth Trends
Argentina is emerging as a developing hub for 3D printing construction, primarily focused on affordable housing and public infrastructure applications. The government’s push for modernisation and innovation in the construction industry is attracting investments in 3D concrete printing. Collaboration with international technology providers has enabled early-stage projects using sustainable materials and modular design principles. Increasing adoption among local construction firms to reduce costs and build efficiency drives interest. With growing awareness and ongoing pilot initiatives, Argentina shows strong potential to expand 3D-printed housing solutions in the coming years.
The Middle East & Africa (MEA) 3D Printing Construction Market Is Driven By The Ongoing Projects.
The MEA 3D printing construction market is witnessing accelerated growth due to large-scale smart city and infrastructure projects, particularly in GCC countries and South Africa. Governments are investing heavily in additive manufacturing to reduce construction time and dependency on imported materials. Dubai’s commitment to making 25% of new buildings 3D-printed by 2030 sets a global benchmark. The region’s focus on sustainable and futuristic architecture further supports market expansion. Rising collaborations with European and Asian technology firms are fostering advancements in materials, printing techniques, and regulatory frameworks.
3D Printing Construction Market Share, By Region, 2024 (%)
| Regional | Revenue Share |
| North America | 24.11% |
| Europe | 19.44% |
| Asia Pacific | 46.50% |
| Latin America | 5.21% |
| Middle East and Africa | 4.74% |
South Africa 3D Printing Construction Market Trends
South Africa is emerging as a key market within MEA, adopting 3D printing construction to address housing shortages and infrastructure needs. The government and private sector are exploring 3D printing for low-cost housing, educational institutions, and community buildings. Investment in sustainable materials such as recycled concrete and geopolymers is expanding. Universities and startups are contributing to research and technology transfer. With growing interest in automation and digital construction, South Africa is poised to become a regional leader in integrating additive manufacturing into mainstream construction practices.
Recent Developments
- In October 2024, Ridhira Group launched Ridhira Zen, described as the world's first 3D-printed resort community, near Hyderabad. This project integrates 3D printing technology, utilising eco-friendly materials like fly ash and slag, with wellness-focused living and Bali-themed villas.(Source: www.constructionweekonline.in)
- In February 2025, Putzmeister launched INSTATIQ, a spin-off company focused on construction 3D printing technology, building on its previous 3D concrete printing concept introduced at BAUMA 2022. The new brand's flagship product is the INSTATIQ P1 mobile 3D concrete printer, which features a 26-meter robotic arm mounted on a Mercedes-Benz chassis and can print with standard concrete mixes.(Source: www.voxelmatters.com)
Top players in the 3D Printing Construction Market & Their Offerings:
- Apis Cor – Apis Cor is a pioneer in 3D printing construction technology, specializing in robotic systems capable of printing entire buildings directly on-site. The company focuses on automated concrete extrusion, significantly reducing construction time, labor costs, and material waste. Apis Cor’s technology has been deployed in residential and commercial projects globally, including the first 3D-printed house in Russia and the U.S.
- COBOD International A/S – COBOD is a Denmark-based leader in construction 3D printing systems, known for its modular BOD2 printer, capable of printing multi-story concrete structures. The company collaborates with global construction firms and investors such as GE Renewable Energy and PERI Group, supporting industrial-scale 3D printing for residential, commercial, and infrastructure projects.
- Contour Crafting Corporation – Founded by Dr. Behrokh Khoshnevis, Contour Crafting is a pioneering company in automated construction 3D printing. Its proprietary Contour Crafting technology uses layered concrete extrusion to construct large structures efficiently, with applications in affordable housing, disaster relief shelters, and even lunar habitats under NASA partnerships.
- CyBe Construction B.V. – Based in the Netherlands, CyBe Construction provides mobile 3D concrete printing systems and proprietary material formulations for sustainable construction. Its integrated approach includes hardware, software, and training for automated on-site printing of homes, walls, and infrastructure elements, emphasizing speed, cost reduction, and eco-efficiency.
- ICON Technology, Inc. – ICON, based in the United States, is one of the most prominent names in additive construction technology, producing 3D-printed homes and infrastructure using its Vulcan printer and Lavacrete material. ICON has partnered with NASA, Lennar, and the U.S. military to advance affordable housing and extraterrestrial construction technologies.
- MX3D – MX3D, headquartered in Amsterdam, uses robotic metal 3D printing to create large-scale steel structures. The company gained recognition for printing the world’s first 3D-printed steel bridge in Amsterdam. Its technology applies wire arc additive manufacturing (WAAM) to produce durable, complex metal geometries for architecture, infrastructure, and industrial design.
- Sika AG – Sika is a Swiss specialty chemicals company integrating 3D concrete printing materials and admixtures into its construction solutions portfolio. The company develops printing mortars, accelerators, and automation-compatible mixes that enable consistent layer adhesion and high structural performance in additive construction.
- WASP S.r.l. (World’s Advanced Saving Project) – WASP, an Italian company, develops sustainable large-scale 3D printers for eco-friendly construction using natural and local materials such as clay and soil. Its Crane WASP system is designed for printing low-cost, sustainable housing, emphasizing circular economy principles and environmental stewardship.
- XtreeE – XtreeE, based in France, focuses on architectural-grade 3D printing for construction, providing design-to-production services and robotic printing systems. The company collaborates with architects and builders to produce customized structural and decorative elements using high-performance concrete and composite materials.
- Yingchuang Building Technique Co., Ltd. (Winsun) – Winsun is a China-based pioneer in large-scale 3D-printed construction, known for printing entire houses, offices, and bridges using recycled construction waste materials. The company’s 3D printing systems promote sustainable, rapid, and cost-effective building solutions and have been deployed across Asia and the Middle East.
- Monolite UK (D-Shape) – Monolite UK, creator of D-Shape technology, specializes in binder jetting 3D printing for construction and architectural applications. Its systems use sand and binding agents to produce complex, stone-like structures, making it ideal for artistic, architectural, and structural forms, including marine and urban infrastructure.
- BetAbram – Based in Slovenia, BetAbram manufactures affordable concrete 3D printers for residential and small-scale commercial construction. The company’s printers, such as the P1 model, are designed for easy setup and on-site operation, targeting low-cost, rapid housing production.
- Total Kustom – Total Kustom is an American additive construction company focusing on affordable housing and modular 3D printing systems. Its founder, Andrey Rudenko, gained recognition for printing a full-scale concrete castle and continues to advance affordable, transportable construction printing technologies.
- Imprimere AG – Imprimere AG, based in Switzerland, develops robotic 3D printing solutions for concrete and composite materials. The company’s systems are used in industrial construction, façade production, and architectural prototyping, emphasizing precision automation and efficiency in large-scale fabrication.
- Branch Technology – Branch Technology, headquartered in the U.S., combines freeform 3D printing with advanced composite materials to produce lightweight, structurally optimized architectural components. Its Cellular Fabrication (C-Fab®) process enables creative, energy-efficient designs for building façades and interior structures.
Segments Covered:
By Method / Technology
- Extrusion-based
- Powder Bonding
- Others (Wire-Arc Additive, Robotic Arm, etc.)
By Material Type
- Concrete
- Metal
- Composite
- Others (Polymers, Geopolymers)
By Application / End-Use
- Building (Residential, Commercial, Industrial)
- Infrastructure (Bridges, Tunnels, Utility components)
By Construction Form
- On-site (printing at location)
Off-site / Prefabrication (modules printed off-site then assembled)
By Region
- North America
- U.S.
- Canada
- Mexico
- Europe
- Germany
- UK
- France
- Italy
- Spain
- Asia Pacific
- China
- India
- Japan
- South Korea
- Latin America
-
- Brazil
- Argentina
- Middle East & Africa
- Saudi Arabia
- South Africa
A Seven-Phase Framework
Our methodology is designed to be universally applicable across commodity chemicals, specialty chemicals, petrochemicals, construction chemicals, coatings, electronic chemicals, industrial gases, agrochemicals, water treatment chemicals, and performance materials. Each phase builds upon the last, creating a layered validation structure that minimizes estimation error and maximizes analytical confidence.
The framework ensures comprehensive market coverage, robust cross-validation, and reliable long-term forecasting — producing market estimates that withstand scrutiny from investors, regulators, and corporate strategy teams.

Seven-Phase Framework — Analytical Effort Distribution
Relative analytical effort allocated across each phase of the Chemicals & Materials research framework

Phase 1 - Secondary Research: Establishing the Foundation
Secondary research collects and evaluates publicly available information from authoritative sources, establishing the foundational understanding of market structure, value chain dynamics, competitive landscape, and end-use demand patterns. Every source is evaluated for credibility, recency, geographic relevance, and methodological soundness before inclusion.
Industry Associations
Sources include ACC, CEFIC, ICCA, JCIA, CPCIF, and SOCMA providing production volumes, consumption trends, capacity developments, and sustainability initiatives.
Company Disclosures
Annual reports, investor presentations, earnings transcripts, and regulatory filings reveal product portfolios, manufacturing footprints, capacity expansions, and revenue segmentation.
Government Databases
National statistical offices, customs authorities, environmental agencies, and industrial production databases provide verified statistics on output, trade flows, and regulatory compliance.
Trade Databases
UN Comtrade, ITC, Eurostat, and national customs authorities enable assessment of global product movement, import dependency, and export competitiveness across regions.
Our Secondary Research Sources
- Ministry of Chemicals and Fertilizers
- European Chemicals Agency
- United States Department of Energy
- Ministry of Industry and Information Technology
- Ministry of Economy Trade and Industry
- Ministry of Trade Industry and Energy
- National Institute of Standards and Technology
- Council of Scientific and Industrial Research
- Fraunhofer Society
- National Institute for Materials Science
Phase 2 — Supply-Side Assessment: Mapping Production Capabilities
Production Capacity Analysis
All major manufacturers are assessed for existing installed capacity, planned additions, expansions, new plant announcements, and technology adoption — mapped at global, regional, and country levels.
Capacity Utilization Adjustment
Installed capacity is adjusted using utilization rates based on demand conditions, feedstock availability, plant operating rates, maintenance schedules, and regulatory restrictions.
Manufacturer Revenue Analysis
Product-specific revenues, segment-level performance, regional distribution, average selling prices, and margin trends are evaluated to establish market value estimates.
Supply-Side Assessment — Capacity vs. Effective Production by Region
Illustrative comparison of installed capacity vs. effective production volume (after utilization rate adjustment) across major regions

Phase 3 — Demand-Side Assessment: Quantifying Chemical Consumption
Demand-side analysis quantifies chemical consumption across industries, applications, and geographies — identifying where and how chemicals are consumed throughout the value chain with precision.
End-Use Industry Analysis
Chemical demand is evaluated across automotive, construction, packaging, electronics, agriculture, healthcare, consumer goods, industrial manufacturing, energy and utilities, and water treatment. Industry output, production trends, and consumption intensity are analyzed to determine demand patterns.
Consumption Modeling
Demand is estimated using measurable indicators: kilograms per vehicle, kilograms per square meter of construction, dosage per cubic meter of water treated, kilograms per hectare of agricultural land, and kilograms per ton of manufactured products. Consumption factors are validated through industry publications and primary interviews.
Application Analysis
The market is segmented by application area to understand product performance requirements, formulation trends, technology adoption, customer preferences, and regulatory requirements improving demand accuracy and segmentation granularity.
Demand-Side Assessment — End-Use Industry Demand Distribution
Illustrative distribution of chemical & materials demand across key end-use industries

Phase 4 - Trade Flow Analysis: Balancing Regional Supply and Demand
Trade flow analysis reconciles regional supply and demand estimates through import and export data, identifying net supply positions, regional dependencies, and market imbalances. It serves as an independent validation layer that tests the consistency of supply-side and demand-side estimates.
Import Analysis
Import data is evaluated to determine volumes, source countries, product dependency, regional supply gaps, and pricing trends — identifying markets that rely heavily on external supply and where domestic production is insufficient to meet demand.
Export Analysis
Export assessments reveal production surplus, export competitiveness, regional manufacturing strength, and global market participation. Export patterns also help validate domestic production estimates and identify net exporting regions.
Apparent Consumption Model
Regional consumption is assessed using the standard apparent consumption formula:
Results identify net importing regions, net exporting regions, regional deficits, and surpluses — serving as an independent validation of supply and demand estimates.
Trade Flow Analysis — Net Supply Position by Region
Illustrative apparent consumption vs. domestic production across major regions — positive gap indicates net import dependency

Phase 5 — Primary Research: The Critical Validation Layer
Primary research tests and refines findings from secondary research through direct engagement with industry participants across the supply chain, demand side, and expert community. It captures intelligence that no database or published report can provide — the real-world experience of manufacturers, buyers, and specialists operating in the market.

Supply-Side Interviews
Conversations with chemical manufacturers, raw material suppliers, contract manufacturers, technology providers, and plant operators cover production trends, capacity utilization, pricing developments, technology shifts, and competitive dynamics.

Demand-Side Interviews
Engagement with OEMs, industrial consumers, procurement managers, distributors, formulators, and end-use manufacturers focuses on consumption trends, purchasing behavior, product substitution, demand outlook, and emerging applications.

Industry Expert Consultations
Additional interviews with industry consultants, independent experts, regulatory specialists, technical professionals, and research institutions provide deeper market context and validate key analytical assumptions.
Focus Areas of Primary Research:
Market Size & Forecast Validation
Revenue estimates, volume consumption, growth rates, forecast assumptions, regional demand.Supply Chain & Value Chain Assessment
Raw material sourcing, supply chain challenges, distribution networks, procurement practices.Production & Capacity Analysis
Manufacturing capacity, utilization rates, expansion projects, plant investments.Pricing & Cost Structure Analysis
Product pricing trends, feedstock costs, energy costs, margin pressures, pricing outlook.Competitive Landscape Assessment
Volume and value estimates confirmed to be fully consistent with one another before publicationInterview Volume by Market Scope
| Study Scope | Number of Interviews |
|---|---|
| Niche Market | 20 – 30 |
| Mid-Sized Market | 30 – 50 |
| Global Market | 50 – 80 |
| Highly Fragmented Market | 80 – 120 |
Interview Details:
Category : Manufacturers, Suppliers, Distributors, End Users, Experts/Associations
Average Duration : 30–60 Minutes
Interview Mode : Video calls, telephonic interviews, expert consultations
Interview Format : Structured / Semi-Structured questionnaire
Focus Areas of Primary Research:
Market Size & Forecast Validation :
Revenue estimates, volume consumption, growth rates, forecast assumptions, regional demand.
Supply Chain & Value Chain Assessment :
Raw material sourcing, supply chain challenges, distribution networks, procurement practices.
Production & Capacity Analysis :
Manufacturing capacity, utilization rates, expansion projects, plant investments.
Pricing & Cost Structure Analysis :
Product pricing trends, feedstock costs, energy costs, margin pressures, pricing outlook.
Competitive Landscape Assessment :
Market share, competitor positioning, strategic initiatives, partnerships, acquisitions.
Primary Research — Stakeholder Coverage by Category
Distribution of interview respondents across stakeholder categories (% share from PPT data)

Primary Research — Respondent Designation Profile
Seniority breakdown of interview respondents (% share from PPT data)

Primary Research — Geographic Coverage of Interviews
Regional distribution of primary research engagement (% share from PPT data)

Phase 6 — Data Triangulation and Market Validation
No single methodology is relied upon in isolation. Multiple independent estimation approaches are combined and reconciled to ensure consistency, accuracy, and analytical defensibility. Any material deviations between approaches are investigated and adjusted through additional validation cycles.
The final market size is derived through weighted triangulation of all validated methodologies. Any material deviations between approaches are investigated and adjusted through additional validation cycles. The outcome represents the most realistic assessment of the market based on available evidence and expert confirmation ensuring that volume and value estimates are fully consistent with one another.
Triangulation Framework — Input Contribution Weight
Relative weight each sizing input contributes to the final reconciled market estimate

Phase 7 — Forecast Modeling: Projecting Future Market Evolution
Forecasting evaluates the future trajectory of the market using a combination of quantitative indicators and qualitative assessments across economic, industry, and regulatory dimensions. Rather than simple extrapolation, each driver is independently modeled and integrated into a composite forecast.
Macroeconomic Indicators
GDP growth, industrial production, manufacturing output, construction activity, consumer spending, and capital investment form the quantitative foundation of long-term demand projections. These are applied at country, regional, and global levels.
Industry Growth Drivers
Urbanization, infrastructure development, industrialization, technological innovation, sustainability initiatives, and evolving product performance requirements are assessed at regional and industry levels — capturing both structural and cyclical demand drivers.
Capacity Expansion Analysis
Announced plant expansions, new manufacturing facilities, technology upgrades, and strategic investments are evaluated to determine future supply-demand dynamics and potential market tightness or oversupply situations.
Regulatory & Sustainability
Environmental regulations, chemical safety standards, emission reduction targets, circular economy initiatives, and sustainability requirements are incorporated as they often influence product adoption rates and market growth trajectories.
Scenario Forecast Range — Indexed Market Growth (Year 1–10)
Illustrative indexed growth trajectories across Base, Optimistic, and Pessimistic scenarios over a 10-year forecast horizon

Forecast Drivers — Relative Impact Score by Category
Impact score (0–100) of each driver type on chemicals & materials market forecast




Comments
Share your thoughts, ask a question, or provide feedback about this report.