
Aviation Fuel Market Size and Forecast 2026 to 2035
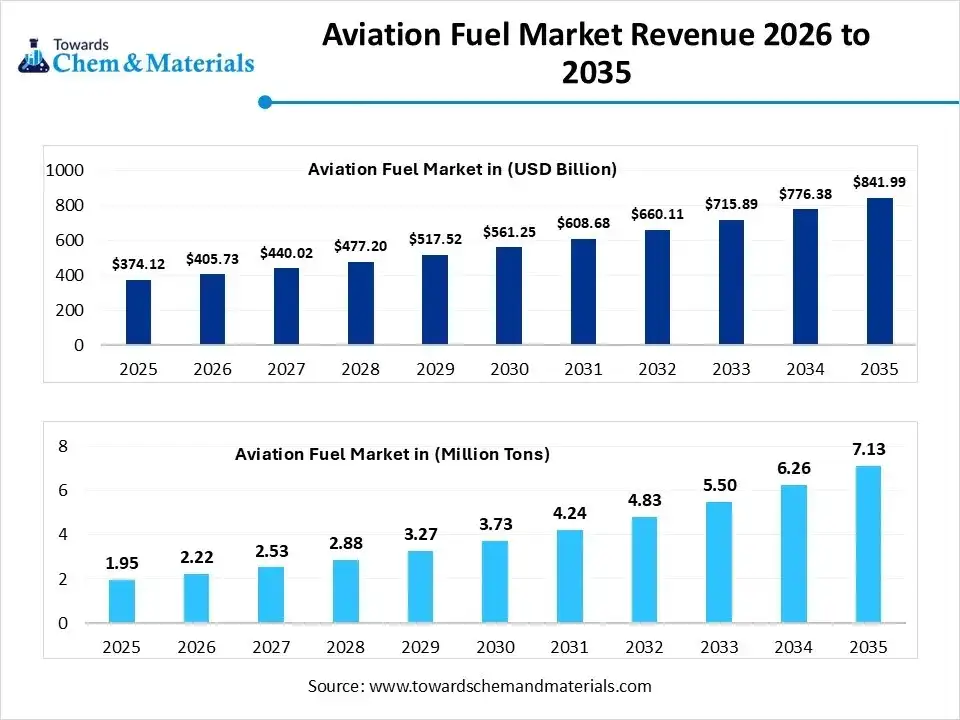
The global aviation fuel market size was estimated at USD 374.12 billion in 2025 and is expected to increase from USD 405.73 billion in 2026 to USD 841.99 billion by 2035, growing at a CAGR of 8.45% from 2026 to 2035. In terms of volume, the market is projected to grow from 322.34 million tons in 2025 to 375.31 million tons by 2035. growing at a CAGR of 1.53% from 2026 to 2035. Asia Pacific dominated the aviation fuel market with the largest volume share of 36.13% in 2025. The shift towards eco-friendly fuel is driving the strategic transformation and sectoral scalability.
Key Takeaways
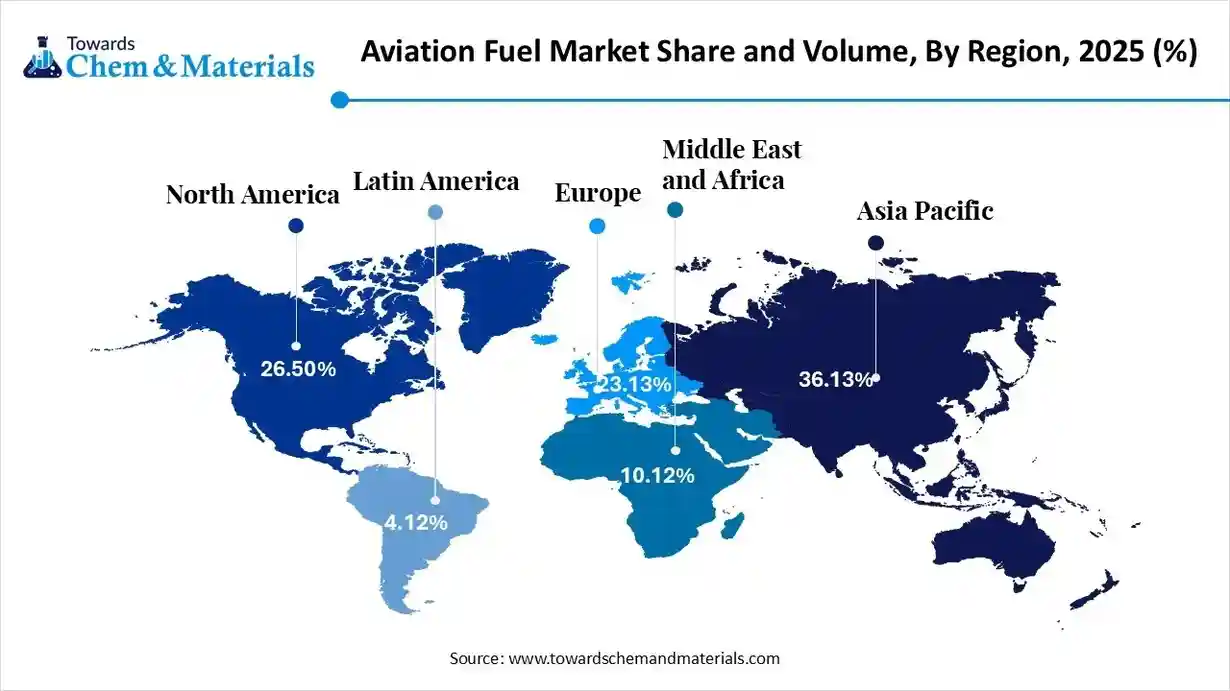
- By region, Asia Pacific led the aviation fuel market with the largest volume share of over 36.13% in 2025. due to urbanization, and the region has experienced the fastest air travel expansion in recent years.
- By region, Middle East & Africa is anticipated to capture a greater portion of the market with a significant CAGR in the future, owing to the region's focus to become a global aviation crossroads.
- By fuel type, the jet A-1 segment led the market with the largest volume share of 72.01% in 2025, due to it being considered the global standard fuel for most aircraft nowadays.
- By fuel type, the sustainable aviation fuel segment is expected to grow during the forecast period, owing to the trend towards carbon reduction and environmental protection.
- By aircraft type, the fixed-wing aircraft segment led the market with the largest volume share of 91.03% in 2025, owing to its structural and operational role in commercial and business air transport.
- By aircraft type, the unmanned aerial vehicles (UAV) segment is expected to grow at a rapid CAGR during the forecast period, akin to its rapid adoption in commercial and industrial applications.
- By application, the commercial aviation segment accounted for the largest volume share of 76.07% in 2025, due to its scale and strategic role in global mobility.
- By application, the air cargo and logistics segment is expected to grow during the forecast period, akin to the rise of express delivery, regional manufacturing clusters, and international freight networks expands cargo flight activity.
From Cargo Lifts to Fighter Jets, Fuel Drive Every Mission
The fuel, which is specifically designed for use to power aircraft at high level and efficiently called aviation fuel. Moreover, by working at higher altitudes and withstand with extreme temperatures, the manufacturers can have invested time and accuracy in recent years. Also, the aviation fuel has been seen in higher demand from the aviation subsectors like commercial aeroplanes, cargo airlift, and military in the current period.
Aviation Fuel Market Trends:
- The sudden shift from pure volume growth to efficiency-based consumption has attracted increased capital and investment in manufacturing nowadays. Moreover, the major players in the airline field have set a focus on the reduction of fuel burn instead of heavy fuel consumption in recent years.
- Emergence of the alternative and blended fuel options, which may enable backward and forward integration for the manufacturers in the coming years. Moreover, several airlines and airports globally are experimenting with different fuel blends for the reduction of emissions while maintaining engine safety in recent years.
- The fuel supply shift near the airports is likely drive regional manufacturing expansion through local sourcing trends in recent years. Moreover, the major airports have been observed working with nearby fuel producers, which supports local manufacturing growth in the past few years.
Report Scope
| Report Attribute | Details |
| Market Size Value in 2026 | USD 405.73 Billion / 327.28 Million Tons |
| Revenue Forecast in 2035 | USD 841.99 Billion / 375.31 Million Tons |
| Growth Rate | CAGR 8.45% |
| Forecast Period | 2026 - 2035 |
| Base Year | 2025 |
| Units Considered | Value (Billion / Million), Volume (Million Tons) |
| Dominant Region | Asia Pacific |
| Segment Covered | By Fuel Type, By Aircraft Type, By Application, By Region |
| Key companies profiled | BP p.l.c., ExxonMobil Corporation, TotalEnergies SE, Shell plc, Chevron Corporation , Valero Energy Corporation , Neste Corporation , Phillips 66, Marathon Petroleum Corporation, Reliance Industries Limited , PetroChina Company Limited , Sinopec (China Petroleum & Chemical Corporation) , Saudi Aramco , Rosneft Oil Company , Eni S.p.A., Kuwait Petroleum Corporation , Equinor ASA, Repsol S.A., Bharat Petroleum Corporation Limited, Indian Oil Corporation Limited |
Automation with Digital Tracking: The Future of Fuel
The industry has observed a greater technological shift. The adoption of intelligent fuel monitoring and control systems is likely to present new business models for forward-thinking manufacturers during the forecast period. These technologies combine digital tracking, automated diagnostics, and real-time reporting to ensure fuel integrity throughout the supply chain. Enhanced visibility allows operators to identify inefficiencies, manage inventory precisely, and respond quickly to quality deviations in recent years.
Trade Analysis of the Aviation Fuel Market: Import, Export, Consumption, and Production Statistics
- China has exported a heavy amount of gasoline in 2024, and the estimated export was 1.15 million metric tons as per the published report.
- The export of petroleum in the United States has seen a heavy surge, which is estimated to increase to 6.6 million barrels per day in 2024.
Value Chain Analysis of the Aviation Fuel Market:
- Distribution to Industrial Users:The distribution of aviation fuel to industrial users, primarily commercial airlines, cargo operators, and military agencies, is characterized by a highly integrated supply chain managed by global energy giants and specialized fuel logistics firms.
- Key Players: Shell and ExxonMobil
- Chemical Synthesis and Processing: The chemical synthesis and processing of aviation fuel have shifted significantly toward Sustainable Aviation Fuel (SAF) and Synthetic Paraffinic Kerosene (SPK). While conventional fuel remains primarily a product of crude oil fractional distillation, advanced chemical pathways are scaling rapidly to meet 2025 blending mandates like ReFuelEU.
- Key Players: Axens and Topsoe
- Regulatory Compliance and Safety Monitoring: Regulatory compliance and safety monitoring for the aviation fuel market are defined by a multi-layered framework of international standards, environmental mandates, and digital monitoring systems.
- Key Agencies: International Civil Aviation Organization (ICAO) and ASTM International
Aviation Fuel Market Regulatory Landscape: Global Regulations
| Country / Region | Regulatory Body | Key Regulations | Focus Areas |
| United States | Environmental Protection Agency (EPA) | Inflation Reduction Act (IRA) Sections 40B & 45Z | Scaling domestic production to reach the 3-billion-gallon goal by 2030 |
| European Union | European Union Aviation Safety Agency (EASA) | ReFuelEU Aviation (Regulation (EU) 2023/2405 | Enforcing the 2025 2% blending mandate, prioritizing Synthetic Fuels (e-kerosene) through sub-mandates starting in 2030 |
| China | Civil Aviation Administration of China (CAAC) | 14th Five-Year Plan for Civil Aviation Development | Developing a domestic SAF supply chain using Used Cooking Oil (UCO) |
Segmental Insights
Fuel Type Insights
How did the Jet A-1 Segment Dominate the Aviation Fuel Market in 2025?
The jet A-1 segment dominated the market with 72.01% share in 2025, due to it being considered the global standard fuel for most aircraft nowadays. Also, by having the working reliability at extreme temperatures and higher altitudes, the segment has gained major industry share in recent years. Moreover, the traditional fuel system is also built according to the jet A-1 fuel compatibility, which is driving the segment potential in recent years.
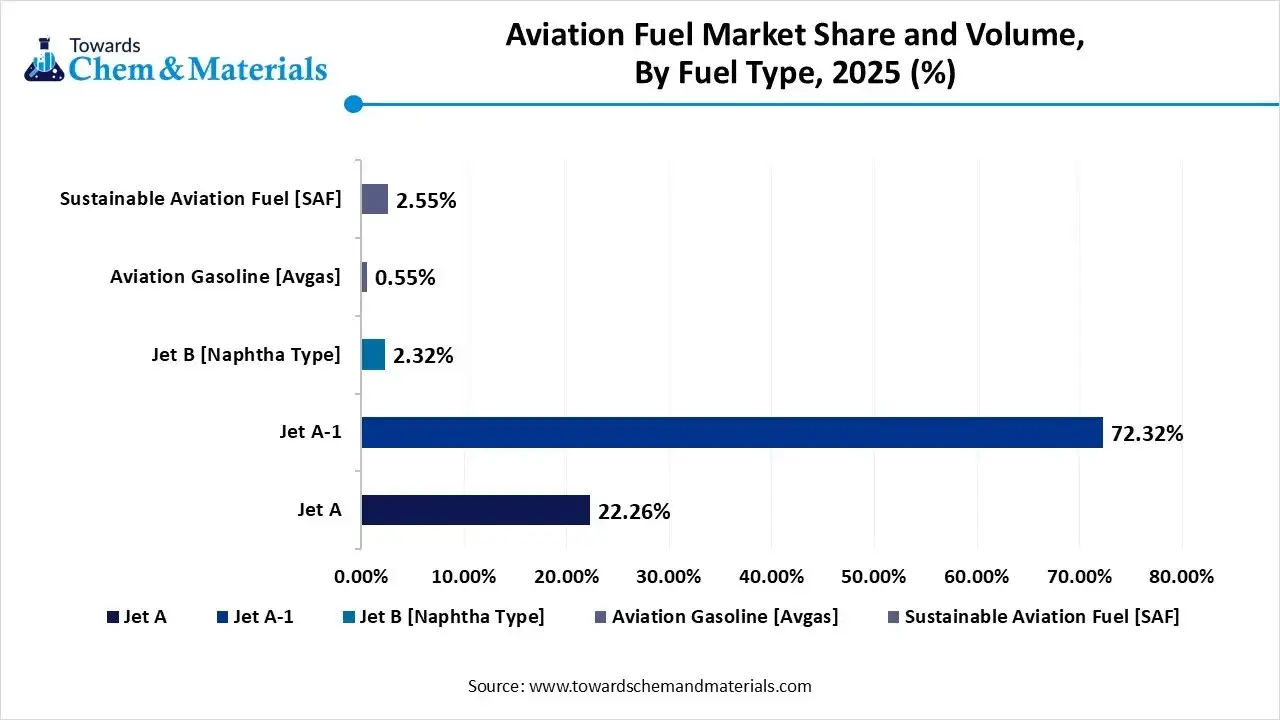
The sustainable aviation fuel (SAF) segment is expected to grow with a rapid CAGR, owing to the trend towards carbon reduction and environmental protection. Also, the major brands are seen under the heavy investment in innovation of the sustainable fuel option for the aircraft nowadays. Moreover, the initiative like green flight credits and others will create lucrative opportunities for manufacturers in the coming years.
Aviation Fuel Market Volume and Share, Fuel Type Insights, 2025 (%)
| By Fuel Type | Market Volume Share (%), 2025 | Market Volume (Million Tons)2025 | Market Volume (Million Tons)2035 | CAGR(%) 2026-2035 | Market Volume Share (%), 2035 |
| Jet A | 22.26% | 71.75 | 81.93 | 1.48% | 21.83% |
| Jet A-1 | 72.32% | 233.12 | 263.58 | 1.37% | 70.23% |
| Jet B [Naphtha Type] | 2.32% | 7.48 | 8.33 | 1.21% | 2.22% |
| Aviation Gasoline [Avgas] | 0.55% | 1.77 | 2.25 | 2.69% | 0.60% |
| Sustainable Aviation Fuel [SAF] | 2.55% | 8.22 | 19.22 | 9.90% | 5.12% |
Aircraft Type Insights
Why does the Fixed-Wing Aircraft Segment Dominate the Aviation Fuel Market?
The fixed-wing aircraft segment dominated the market with 91.03% share in 2025, owing to its structural and operational role in commercial and business air transport. Also, their long nonstop flights and consistent scheduling create sustained fuel demand across global networks. Airlines and airport systems are designed to support these platforms efficiently, aligning fuel supply chains accordingly.
The unmanned aerial vehicles (UAVs) segment is expected to grow at a rapid CAGR akin to its rapid adoption in commercial and industrial applications. Advancements in battery technology, hybrid propulsion, and lightweight materials extend flight range and operational capabilities. UAVs are increasingly deployed across sectors requiring reliable and flexible aerial services.
Application Insights
How did the Commercial Aviation Segment Dominate the Aviation Fuel Market in 2025?
The commercial aviation segment dominated the market with 76.07% share in 2025, due to its scale and strategic role in global mobility. High-frequency flight schedules and broad route coverage amplify fuel use across multiple markets. Large aircraft fleets with consistent operational demands further consolidate fuel consumption.
The air cargo and logistics segment is expected to grow with a rapid CAGR, due to the rise of express delivery, regional manufacturing clusters, and international freight networks expands cargo flight activity. As operators optimize routing and loading efficiencies, fuel volumes align with expanding service levels as per the future expansions.
Regional Insights
The Asia Pacific aviation fuel market size was valued at USD 131.65 billion in 2025 and is expected to be worth around USD 296.80 billion by 2035, exhibiting at a compound annual growth rate (CAGR) of 8.47% over the forecast period from 2026 to 2035.
The Asia Pacific aviation fuel market volume was estimated at 116.46 million tons in 2025 and is projected to reach 139.73 million tons by 2035, growing at a CAGR of 2.04% from 2026 to 2035.

Asia Pacific dominated the aviation fuel market with 36% share in 2025, due to urbanization, and the region has experienced the fastest air travel expansion in recent years. Moreover, the region also seen under the heavy development of the advanced airports, regional routes, and the preference for low-cost airlines, which supported the industry's potential in the past few years.
China Leads the Aviation Fuel Industry Through Early Domestic Expansion
China maintained its dominance in the aviation fuel market, owing to the early expansion of domestic air travel routes. Moreover, the heavy petroleum and gasoline export has emerged as a catalyst for unlocking sectors' full potential in recent years. Moreover, the airlines and airports are seen working with the nearby gasoline supplier for the installation of the fuel infrastructure near airports.
Aviation Fuel Market Volume and Share, By Region, 2025-2035 (%)
| By Region | Market Volume Share (%), 2025 | Market Volume (Million Tons)2025 | Market Volume (Million Tons)2035 | CAGR(%) 2026-2035 | Market Volume Share (%), 2035 |
| North America | 26.50% | 85.42 | 97.28 | 1.46% | 25.92% |
| Europe | 23.13% | 74.56 | 79.23 | 0.68% | 21.11% |
| Asia Pacific | 36.13% | 116.46 | 139.73 | 2.04% | 37.23% |
| South America | 4.12% | 13.28 | 15.76 | 1.92% | 4.20% |
| Middle East & Africa | 10.12% | 32.62 | 43.31 | 3.20% | 11.54% |
Europe Aviation Fuel Market Evaluation
Europe is a notably growing region, due to modernization initiatives and system-level optimization. Airports are upgrading refueling technologies and logistics systems to improve efficiency and safety. Airlines prioritize fuel management strategies that reduce waste and improve performance in Europe nowadays.
Germany Advances Aviation Through Smart Efficiency Strategies
Germany is expected to gain a major industry share, akin to a combination of operational recovery and technological advancement. The German airlines focus on optimizing fuel usage through digital systems and modern infrastructure. This balanced growth model supports long-term market expansion beyond simple traffic increases.
Aviation Fuel Market Study in North America
North America is expected to capture a notable share of the industry, due to its focus on precision, reliability, and infrastructure optimization. The region invests in advanced fuel handling systems and high-capacity airport logistics. Rather than rapid expansion, the north America strengthens efficiency and operational stability.
Scale and Technology Power United States Aviation Demand
United States is expected to emerge as a prominent country, akin to scale and system efficiency. A large domestic aviation base, combined with cargo growth, ensures consistent fuel consumption in the country. Investments in digital fuel management further enhance operational performance and market value.
South America Aviation Fuel Market Evaluation
South America is a notably growing region, akin to expanding aviation infrastructure and increasing domestic travel. Aviation fuel demand rises as airlines improve connectivity across remote regions in South America in the current period. This structural reliance on aviation supports long-term market development.
Regional Connectivity Fuels Brazil’s Aviation Rise
Brazil is expected to gain a major industry share, akin to its large domestic travel demand and regional connectivity. Flights connect remote regions where roads or rail are limited. Brazil is also expanding cargo aviation linked to agriculture and exports. A unique trend is decentralization smaller airports are consuming more fuel as regional routes expand.
Middle East and Africa Aviation Fuel Market Examination
Middle East and Africa are expected to capture a major share of the market with a rapid CAGR, owing to the region's focus to become a global aviation crossroads. Moreover, the region has seen long-haul flights serving, which lead to demand for storage, refueling, and fuel logistics. Also, the Africa region has experienced regional air connectivity.
Cargo Traffic Boosts Saudi Fuel Consumption
Saudi Arabia is expected to emerge as a prominent country for the aviation fuel market in the coming years, akin to the sudden surge in development in logistic hubs, mega airports, and fuel infrastructure across the country. Moreover, the country has seen heavy cargo traffic, leading to heavy aviation fuel demand in recent years.
Recent Developments
- In November 2025, LanzaJet unveiled the establishment and start of its new commercial ethanol-to-jet-fuel plant. Moreover, the plant is in Soperton, Georgia, United States, as per the published report. (Source: ir.lanzatech.com)
Top Vendors in the Aviation Fuel Market & Their Offerings:
- Shell plc: A global energy leader headquartered in London that is rapidly expanding its low-carbon portfolio, including a major commitment to supplying 10% of the world's sustainable aviation fuel (SAF) by 2030.
- BP p.l.c.: A multinational energy company that provides traditional aviation fuels globally while investing heavily in the "Net Zero" transition through strategic partnerships for large-scale biojet fuel production.
- ExxonMobil Corporation: One of the world's largest publicly traded energy companies, focusing on high-performance jet fuel production while scaling up its "Proxx" renewable fuels division to meet rising aviation decarbonization demands.
- TotalEnergies SE: A broad energy company based in France that integrates the entire aviation fuel value chain, from traditional refining to the production of SAF from waste and residues at its specialized European biorefineries.
Other Key Players
- BP p.l.c.
- ExxonMobil Corporation
- TotalEnergies SE
- Shell plc
- Chevron Corporation
- Valero Energy Corporation
- Neste Corporation
- Phillips 66
- Marathon Petroleum Corporation
- Reliance Industries Limited
- PetroChina Company Limited
- Sinopec (China Petroleum & Chemical Corporation)
- Saudi Aramco
- Rosneft Oil Company
- Eni S.p.A.
- Kuwait Petroleum Corporation
- Equinor ASA
- Repsol S.A.
- Bharat Petroleum Corporation Limited
- Indian Oil Corporation Limited
Segments Covered in the Report
By Fuel Type
- Jet A
- Jet A-1
- Jet B (Naphtha-type)
- Aviation Gasoline (Avgas)
- Sustainable Aviation Fuel (SAF)
- Bio-based (HEFA)
- Power-to-Liquid (Synthetic/e-Fuels)
- Alcohol-to-Jet (AtJ)
By Aircraft Type
- Fixed-Wing Aircraft
- Rotary-Wing Aircraft (Helicopters)
- Unmanned Aerial Vehicles (UAVs)
By Application
- Commercial Aviation (Scheduled Passenger Airlines)
- Military Aviation (Defense and Air Force)
- General Aviation (Private and Business Jets)
- Air Cargo and Logistics
By Region
- North America
- U.S.
- Canada
- Mexico
- Europe
- Germany
- UK
- France
- Italy
- Spain
- Asia Pacific
- China
- India
- Japan
- South Korea
- Latin America
- Brazil
- Argentina
- Middle East & Africa
- Saudi Arabia
- South Africa
A Seven-Phase Framework
Our methodology is designed to be universally applicable across commodity chemicals, specialty chemicals, petrochemicals, construction chemicals, coatings, electronic chemicals, industrial gases, agrochemicals, water treatment chemicals, and performance materials. Each phase builds upon the last, creating a layered validation structure that minimizes estimation error and maximizes analytical confidence.
The framework ensures comprehensive market coverage, robust cross-validation, and reliable long-term forecasting — producing market estimates that withstand scrutiny from investors, regulators, and corporate strategy teams.

Seven-Phase Framework — Analytical Effort Distribution
Relative analytical effort allocated across each phase of the Chemicals & Materials research framework

Phase 1 - Secondary Research: Establishing the Foundation
Secondary research collects and evaluates publicly available information from authoritative sources, establishing the foundational understanding of market structure, value chain dynamics, competitive landscape, and end-use demand patterns. Every source is evaluated for credibility, recency, geographic relevance, and methodological soundness before inclusion.
Industry Associations
Sources include ACC, CEFIC, ICCA, JCIA, CPCIF, and SOCMA providing production volumes, consumption trends, capacity developments, and sustainability initiatives.
Company Disclosures
Annual reports, investor presentations, earnings transcripts, and regulatory filings reveal product portfolios, manufacturing footprints, capacity expansions, and revenue segmentation.
Government Databases
National statistical offices, customs authorities, environmental agencies, and industrial production databases provide verified statistics on output, trade flows, and regulatory compliance.
Trade Databases
UN Comtrade, ITC, Eurostat, and national customs authorities enable assessment of global product movement, import dependency, and export competitiveness across regions.
Our Secondary Research Sources
- Ministry of Chemicals and Fertilizers
- European Chemicals Agency
- United States Department of Energy
- Ministry of Industry and Information Technology
- Ministry of Economy Trade and Industry
- Ministry of Trade Industry and Energy
- National Institute of Standards and Technology
- Council of Scientific and Industrial Research
- Fraunhofer Society
- National Institute for Materials Science
Phase 2 — Supply-Side Assessment: Mapping Production Capabilities
Production Capacity Analysis
All major manufacturers are assessed for existing installed capacity, planned additions, expansions, new plant announcements, and technology adoption — mapped at global, regional, and country levels.
Capacity Utilization Adjustment
Installed capacity is adjusted using utilization rates based on demand conditions, feedstock availability, plant operating rates, maintenance schedules, and regulatory restrictions.
Manufacturer Revenue Analysis
Product-specific revenues, segment-level performance, regional distribution, average selling prices, and margin trends are evaluated to establish market value estimates.
Supply-Side Assessment — Capacity vs. Effective Production by Region
Illustrative comparison of installed capacity vs. effective production volume (after utilization rate adjustment) across major regions

Phase 3 — Demand-Side Assessment: Quantifying Chemical Consumption
Demand-side analysis quantifies chemical consumption across industries, applications, and geographies — identifying where and how chemicals are consumed throughout the value chain with precision.
End-Use Industry Analysis
Chemical demand is evaluated across automotive, construction, packaging, electronics, agriculture, healthcare, consumer goods, industrial manufacturing, energy and utilities, and water treatment. Industry output, production trends, and consumption intensity are analyzed to determine demand patterns.
Consumption Modeling
Demand is estimated using measurable indicators: kilograms per vehicle, kilograms per square meter of construction, dosage per cubic meter of water treated, kilograms per hectare of agricultural land, and kilograms per ton of manufactured products. Consumption factors are validated through industry publications and primary interviews.
Application Analysis
The market is segmented by application area to understand product performance requirements, formulation trends, technology adoption, customer preferences, and regulatory requirements improving demand accuracy and segmentation granularity.
Demand-Side Assessment — End-Use Industry Demand Distribution
Illustrative distribution of chemical & materials demand across key end-use industries

Phase 4 - Trade Flow Analysis: Balancing Regional Supply and Demand
Trade flow analysis reconciles regional supply and demand estimates through import and export data, identifying net supply positions, regional dependencies, and market imbalances. It serves as an independent validation layer that tests the consistency of supply-side and demand-side estimates.
Import Analysis
Import data is evaluated to determine volumes, source countries, product dependency, regional supply gaps, and pricing trends — identifying markets that rely heavily on external supply and where domestic production is insufficient to meet demand.
Export Analysis
Export assessments reveal production surplus, export competitiveness, regional manufacturing strength, and global market participation. Export patterns also help validate domestic production estimates and identify net exporting regions.
Apparent Consumption Model
Regional consumption is assessed using the standard apparent consumption formula:
Results identify net importing regions, net exporting regions, regional deficits, and surpluses — serving as an independent validation of supply and demand estimates.
Trade Flow Analysis — Net Supply Position by Region
Illustrative apparent consumption vs. domestic production across major regions — positive gap indicates net import dependency

Phase 5 — Primary Research: The Critical Validation Layer
Primary research tests and refines findings from secondary research through direct engagement with industry participants across the supply chain, demand side, and expert community. It captures intelligence that no database or published report can provide — the real-world experience of manufacturers, buyers, and specialists operating in the market.

Supply-Side Interviews
Conversations with chemical manufacturers, raw material suppliers, contract manufacturers, technology providers, and plant operators cover production trends, capacity utilization, pricing developments, technology shifts, and competitive dynamics.

Demand-Side Interviews
Engagement with OEMs, industrial consumers, procurement managers, distributors, formulators, and end-use manufacturers focuses on consumption trends, purchasing behavior, product substitution, demand outlook, and emerging applications.

Industry Expert Consultations
Additional interviews with industry consultants, independent experts, regulatory specialists, technical professionals, and research institutions provide deeper market context and validate key analytical assumptions.
Focus Areas of Primary Research:
Market Size & Forecast Validation
Revenue estimates, volume consumption, growth rates, forecast assumptions, regional demand.Supply Chain & Value Chain Assessment
Raw material sourcing, supply chain challenges, distribution networks, procurement practices.Production & Capacity Analysis
Manufacturing capacity, utilization rates, expansion projects, plant investments.Pricing & Cost Structure Analysis
Product pricing trends, feedstock costs, energy costs, margin pressures, pricing outlook.Competitive Landscape Assessment
Volume and value estimates confirmed to be fully consistent with one another before publicationInterview Volume by Market Scope
| Study Scope | Number of Interviews |
|---|---|
| Niche Market | 20 – 30 |
| Mid-Sized Market | 30 – 50 |
| Global Market | 50 – 80 |
| Highly Fragmented Market | 80 – 120 |
Interview Details:
Category : Manufacturers, Suppliers, Distributors, End Users, Experts/Associations
Average Duration : 30–60 Minutes
Interview Mode : Video calls, telephonic interviews, expert consultations
Interview Format : Structured / Semi-Structured questionnaire
Focus Areas of Primary Research:
Market Size & Forecast Validation :
Revenue estimates, volume consumption, growth rates, forecast assumptions, regional demand.
Supply Chain & Value Chain Assessment :
Raw material sourcing, supply chain challenges, distribution networks, procurement practices.
Production & Capacity Analysis :
Manufacturing capacity, utilization rates, expansion projects, plant investments.
Pricing & Cost Structure Analysis :
Product pricing trends, feedstock costs, energy costs, margin pressures, pricing outlook.
Competitive Landscape Assessment :
Market share, competitor positioning, strategic initiatives, partnerships, acquisitions.
Primary Research — Stakeholder Coverage by Category
Distribution of interview respondents across stakeholder categories (% share from PPT data)

Primary Research — Respondent Designation Profile
Seniority breakdown of interview respondents (% share from PPT data)

Primary Research — Geographic Coverage of Interviews
Regional distribution of primary research engagement (% share from PPT data)

Phase 6 — Data Triangulation and Market Validation
No single methodology is relied upon in isolation. Multiple independent estimation approaches are combined and reconciled to ensure consistency, accuracy, and analytical defensibility. Any material deviations between approaches are investigated and adjusted through additional validation cycles.
The final market size is derived through weighted triangulation of all validated methodologies. Any material deviations between approaches are investigated and adjusted through additional validation cycles. The outcome represents the most realistic assessment of the market based on available evidence and expert confirmation ensuring that volume and value estimates are fully consistent with one another.
Triangulation Framework — Input Contribution Weight
Relative weight each sizing input contributes to the final reconciled market estimate

Phase 7 — Forecast Modeling: Projecting Future Market Evolution
Forecasting evaluates the future trajectory of the market using a combination of quantitative indicators and qualitative assessments across economic, industry, and regulatory dimensions. Rather than simple extrapolation, each driver is independently modeled and integrated into a composite forecast.
Macroeconomic Indicators
GDP growth, industrial production, manufacturing output, construction activity, consumer spending, and capital investment form the quantitative foundation of long-term demand projections. These are applied at country, regional, and global levels.
Industry Growth Drivers
Urbanization, infrastructure development, industrialization, technological innovation, sustainability initiatives, and evolving product performance requirements are assessed at regional and industry levels — capturing both structural and cyclical demand drivers.
Capacity Expansion Analysis
Announced plant expansions, new manufacturing facilities, technology upgrades, and strategic investments are evaluated to determine future supply-demand dynamics and potential market tightness or oversupply situations.
Regulatory & Sustainability
Environmental regulations, chemical safety standards, emission reduction targets, circular economy initiatives, and sustainability requirements are incorporated as they often influence product adoption rates and market growth trajectories.
Scenario Forecast Range — Indexed Market Growth (Year 1–10)
Illustrative indexed growth trajectories across Base, Optimistic, and Pessimistic scenarios over a 10-year forecast horizon

Forecast Drivers — Relative Impact Score by Category
Impact score (0–100) of each driver type on chemicals & materials market forecast




Comments
Share your thoughts, ask a question, or provide feedback about this report.