
Sodium Ion Battery Material Market Size Analysis Report 2035
The global sodium ion battery material market size was estimated at USD 2.93 billion in 2025 and is expected to increase from USD 3.81 billion in 2026 to USD 40.74 billion by 2035, growing at a CAGR of 30.11% from 2026 to 2035. In terms of volume, the market is projected to grow from 450,000 tons in 2025 to 2,547,573 tons by 2035. growing at a CAGR of 18.93% from 2026 to 2035. Asia Pacific dominated the sodium ion battery material market with the largest volume share of 45.38% in 2025. The growth of the market is driven by cost-effectiveness, supply chain resilience, and technological improvements in performance.
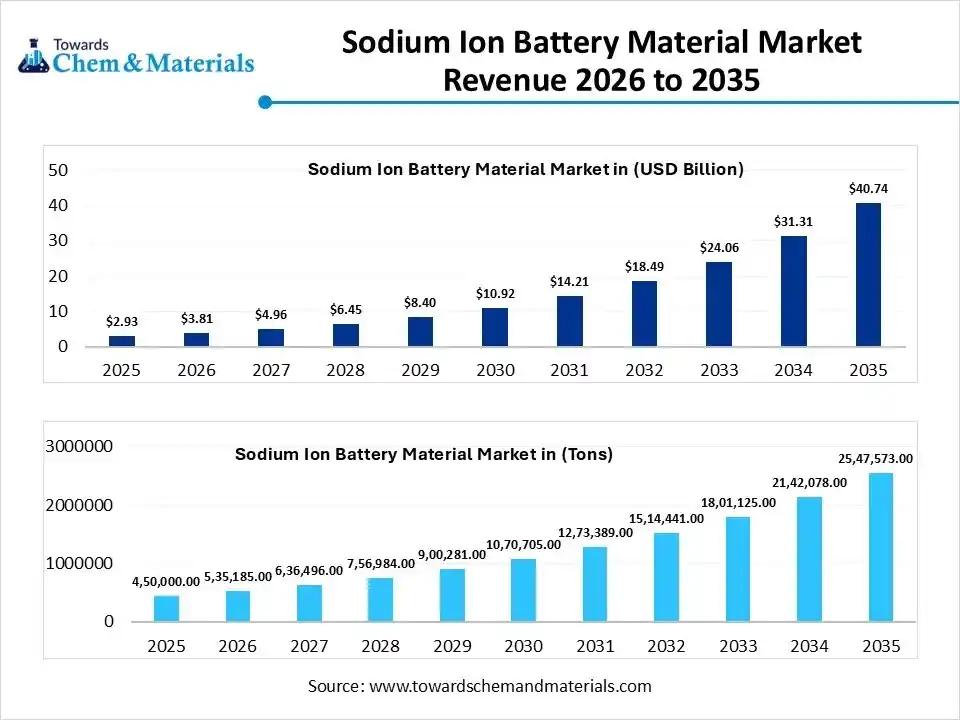
Key Takeaways
- By region, Asia Pacific led the sodium ion battery material market with the largest volume share of over 45.38% in 2025, Government support and large production capacities drive the growth of the market.
- By region, North America is expected to have fastest growth in the market in the forecast period between 2026 and 2035. Material innovation and modernization fuel the growth of the market.
- By material type, the cathode materials segment led the market with the largest volume share of 41.12% in 2025, thermal stability, and scalability increase the demand for the market.
- By material type, the anode materials segment is projected to grow at a CAGR between 2026 and 2035. The growth is driven due to its low cost, compatibility with existing manufacturing infrastructure, and stable cycling performance.
- By technology, the ambient-temperature Na-ion segment led the market with the largest volume share of 75.03% in 2025. The lifespan and cost-effectiveness fuel and support the growth of the market.
- By technology, the solid-state sodium-ion segment is projected to grow at a CAGR between 2026 and 2035. These systems reduce fire risks and enable broader operating conditions, which increases the demand.
- By application, the stationary energy storage segment accounted for the largest volume share of 55.12% in 2025,advantages in resource availability, safety, and lifecycle economics, making them suitable for large-scale installations
- By application, the transportation segment is projected to grow at a CAGR between 2026 and 2035. Material innovation and advancement drive the growth of the market.
Market Overview
The sodium ion battery (SIB) material market refers to the supply chain of chemical components and raw materials, specifically cathodes, anodes, electrolytes, separators, and current collectors required to manufacture sodium-ion cells. As an emerging alternative to lithium-ion technology, this market focuses on leveraging the abundance of sodium to provide low-cost, sustainable, and safe energy storage solutions.
What Is The Significance Of The Sodium Ion Battery Material Market?
The significance of the sodium-ion (Na-ion) battery material market lies in offering a cost-effective, abundant, and safer alternative to lithium-ion batteries, crucial for grid-scale energy storage, affordable EVs, and renewable integration. Its growth addresses lithium supply chain risks and cost volatility by using readily available sodium, enabling sustainable and resilient energy systems for grid stability, consumer electronics, and the electrification of transport, especially in large-scale applications.
Sodium Ion Battery Material Market Growth Trends:
- Technological Advancement: Ongoing R&D addresses lower energy density through better electrode design, electrolytes, and integration into hybrid systems.
- Cold Weather Performance: Better performance in low temperatures compared to Li-ion, opening new geographic opportunities.
- Automotive: Growing demand for EVs, especially in developing markets, leveraging Na-ions safety (non-flammable) and cost.
Report Scope
| Report Attribute | Details |
| Market Size Value in 2026 | USD 3.81 Billion / 535,185 Tons |
| Revenue Forecast in 2035 | USD 40.74 Billion / 2,547,573 Tons |
| Growth Rate | CAGR 30.11% |
| Forecast Period | 2026 - 2035 |
| Base Year | 2025 |
| Units Considered | Value (Billion / Million), Volume (Tons) |
| Dominant Region | Asia Pacific |
| Segment Covered | By Material Type, By Battery Technology Type, By Application, By Regions |
| Key companies profiled | AMYRIS Materials (USA/Global), Sichuan Tianqi Lithium Industries / affiliated units (China), Li-Materials (China), EnerVenue (USA), CATL (Contemporary Amperex Technology Co. Limited) (China), HiNa Battery Technology, Natron Energy, Altris AB, Tiamat Energy, NEI Corporation, BTR New Material Group, NGK Insulators, Ltd., Zhongke Haina, Ronbay Technology, Guizhou Zhenhua E-chem, Beijing Easpring Material Technology, Hunan Changyuan Lico, Dofluoride New Materials (DFD), Shengquan Group , Veken Technology , TIANJIN B&M Science and Technology , Putailai (PTL), Capchem Technology |
Key Technological Shifts In The Sodium Ion Battery Material Market:
Key shifts in the Sodium Ion battery material market focus on improving energy density (using hard carbon anodes, novel cathodes like Prussian blue analogs), boosting cycle life, leveraging compatibility with Li-ion infrastructure, enabling extreme temperature performance, and moving towards large-scale production for grid storage & Electric Vehicles, all driven by Sodiums abundance and lower cost, with breakthroughs in hydride-ion tech promising even higher performance.
Trade Analysis Of Sodium Ion Battery Material Market: Import & Export Statistics
- According to India Export data, India shipped 115 batches of Battery Material from May 2024 to April 2025 (TTM). These shipments involved 23 Indian exporters supplying 33 buyers. Most Indian Battery Material exports go to Nigeria, Russia, and Iraq.
- Globally, the leading exporters are China, the United States, and Vietnam. China tops the list with 21,577 shipments, followed by the United States with 2,657, and Vietnam with 1,618 shipments.
- Global Export data shows that from June 2024 to May 2025 (TTM), the world exported 983,415 shipments of batteries. These exports involved 53,546 exporters and 58,885 buyers, reflecting a 19% increase over the previous twelve months. Most of the export destinated for Vietnam, the United States, and India.
- Globally, the top three battery exporters are China, Vietnam, and the United States, with China leading at 1,066,895 shipments, Vietnam with 595,068 shipments, and the United States with 296,779 shipments.
Sodium Ion Battery Material Market Value Chain Analysis
- Material Synthesis & Processing: Sodium-ion battery materials are produced through processes such as cathode material synthesis (sodium layered oxides, Prussian blue analogs), anode material processing (hard carbon), precursor mixing, calcination, particle size optimization, and surface coating to enhance electrochemical performance and stability.
- Key Players: CATL, Faradion Limited, HiNa Battery Technology, Natron Energy.
- Quality Testing & Certification: Sodium-ion battery materials require certifications related to electrochemical performance, thermal stability, material purity, environmental compliance, and battery safety standards. Key certifications include ISO quality standards, IEC battery safety guidelines, UN 38.3 transport certification, and RoHS compliance.
- Key Players: ISO (International Organization for Standardization), IEC (International Electrotechnical Commission), TÜV SÜD, UL Solutions.
- Distribution to End-Use Industries: Sodium-ion battery materials are supplied to battery cell manufacturers, energy storage system developers, electric mobility platforms, grid-scale storage projects, and industrial backup power solution providers.
- Key Players: CATL supply partners, Faradion ecosystem partners, and Natron Energy collaborators.
Sodium Ion Battery Material Regulatory Landscape: Global Regulations
| Country / Region | Regulatory Body | Key Regulations | Focus Areas | Notable Notes |
| North America | U.S. Department of Energy (DOE) U.S. Environmental Protection Agency (EPA) U.S. Department of Transportation (DOT) |
DOE battery materials strategy & incentives EPA Extended Producer Responsibility (battery framework) development DOT hazardous materials transport rules (UN 3551/UN 3552 for sodium-ion) |
Advancement of sodium-ion material R&D Lifecycle emissions and recycling responsibilities Transportation safety classification for sodium-ion battery materials |
U.S. EPA is engaging in a national EPR framework for batteries covering all chemistries, including sodium-ion; transport regs now include new UN entries for sodium-ion batteries effective March 31, 2025. |
| Europe | European Commission European Chemicals Agency (ECHA) EU Member State authorities |
EU Batteries Regulation 2023/1542 (lifecycle sustainability & safety) REACH chemical safety CLP hazard classification |
Sustainability & circularity requirements Material reuse & recycling targets Due diligence on critical raw materials |
New EU Batteries Regulation covers all rechargeable batteries (including sodium-ion) with recycled content, carbon footprint reporting, hazardous substance limits, and supply-chain due diligence obligations. |
| Asia Pacific | China Ministry of Ecology & Environment (MEE) National Development and Reform Commission (NDRC) Japan METI / MOE South Korea Ministry of Environment |
China Solid Waste & Cleaner Production Laws Japan chemical & battery material safety standards South Korea K-Battery materials guidelines (emerging) |
Chemical registration and safety for new battery materials Industrial standards for battery material performance Environmental compliance for processing and recycling |
China is rapidly scaling sodium-ion battery material production with local public-private partnerships; national standards are evolving for performance and environmental safety. |
| South America | Brazil Ministry of Mines & Energy Argentina Ministry of Energy Chile Ministry of Energy |
National battery and energy storage strategies (emerging) Solid waste / electrical equipment disposal laws |
Early-stage regulations for battery materials Import/export compliance Environmental controls |
Regulatory frameworks for advanced battery materials like sodium-ion are nascent; many countries align with best practices from the EU/US to support local EV and storage markets. |
| Middle East & Africa | UAE Ministry of Energy & Infrastructure Saudi Ministry of Energy South African Department of Mineral Resources & Energy |
National energy diversification and decarbonization strategies Environmental protection/waste management rules |
Support for alternative battery materials Environmental review and compliance |
Policies encouraging electrification and renewable integration are increasing interest in alternative batteries; specific sodium-ion regulations are emerging and often align with general battery / hazardous materials laws. |
Segmental Insights
Material Type Insights
Which Material Type Segment Dominated The Sodium Ion Battery Material Market In 2025?
The cathode materials segment dominated the market, accounting for approximately 41.12% of the market share in 2025. Cathode materials represent a critical cost and performance determinant in the market, with strong emphasis on layered oxides, polyanionic compounds, and Prussian blue analogues. These materials are favored for their sodium abundance, thermal stability, and scalability. Ongoing R&D is improving energy density, cycle life, and voltage profiles, supporting their adoption in large-scale energy storage and emerging mobility applications.
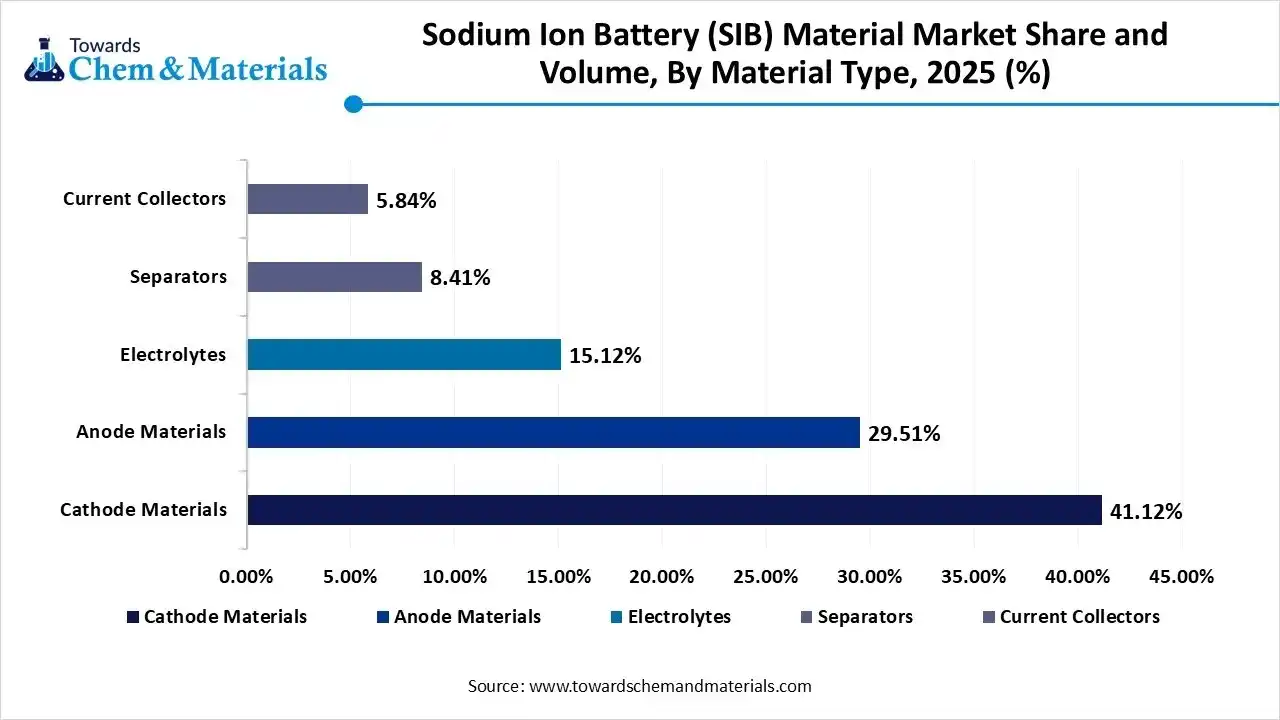
The anode materials segment is projected to grow at a CAGR between 2026 and 2035 in the sodium-ion battery material market. Anode materials for sodium-ion batteries primarily include hard carbon and emerging alloy-based materials, driven by their ability to accommodate larger sodium ions. Advancements in precursor selection and microstructure optimization are enhancing capacity, efficiency, and long-term durability across stationary and transportation applications.
Sodium Ion Battery (SIB) Material Market Volume and Share, By Material Type, 2025 (%)
| By Material Type | Market Volume Share (%), 2025 | Market Volume (Million Tons)2025 | Market Volume (Million Tons)2035 | CAGR(%) 2026-2035 | Market Volume Share (%), 2035 |
| Cathode Materials | 41.12% | 185,040.0 | 1,022,086.4 | 20.91% | 40.12% |
| Anode Materials | 29.51% | 132,808.5 | 817,771.1 | 22.38% | 32.10% |
| Electrolytes | 15.12% | 68,040.0 | 359,717.4 | 20.32% | 14.12% |
| Separators | 8.41% | 37,845.0 | 203,551.1 | 20.55% | 7.99% |
| Current Collectors | 5.84% | 26,266.5 | 144,447.4 | 20.85% | 5.67% |
Technology Insights
How Did Ambient Temperature Na-ion Segment Dominated The Sodium Ion Battery Material Market In 2025?
The ambient-temperature Na-ion segment dominated the market, accounting for approximately 75.03% of the market share in 2025. Ambient temperature sodium-ion battery technology is gaining rapid traction due to its operational simplicity, safety advantages, and reduced system complexity compared to lithium-based systems. These batteries are well-suited for grid-scale storage and backup power solutions, as they eliminate the need for complex thermal management. Continuous material optimization is improving charge rates, lifespan, and cost competitiveness.
The solid-state sodium-ion segment is projected to grow at a CAGR between 2026 and 2035 in the market. Solid-state sodium-ion battery technology represents an emerging innovation aimed at enhancing safety, energy density, and operating stability. Although still in early commercialization stages, increasing research investments and pilot-scale developments position solid-state sodium-ion batteries as a long-term solution for advanced energy storage needs.
Application Insights
Which Application Segment Dominated The Sodium Ion Battery Material Market In 2025?
The stationary energy storage segment dominated the market, accounting for approximately 55.12% of the market share in 2025. Stationary energy storage is the dominant application segment for sodium-ion battery materials, driven by growing renewable energy integration, grid stabilization needs, and cost pressures. Utility companies and energy developers increasingly view sodium-ion batteries as a viable alternative to lithium-ion technologies.
The transportation segment is projected to grow at a CAGR between 2026 and 2035 in the market. The transportation segment is an emerging application area for sodium-ion battery materials, particularly in low-speed electric vehicles, two-wheelers, and short-range mobility solutions. While energy density remains lower than lithium-ion batteries, cost efficiency, thermal stability, and raw material availability support adoption in cost-sensitive markets. Continued material innovation is expected to expand sodium-ion usage in future electric mobility platforms.
Regional Analysis
The Asia Pacific sodium ion battery material market size was valued at USD 1.32 billion in 2025 and is expected to be worth around USD 18.44 billion by 2035, exhibiting at a compound annual growth rate (CAGR) of 30.17% over the forecast period from 2026 to 2035. The Asia Pacific sodium ion battery material market volume was estimated at 204,210 tons in 2025 and is projected to reach 1,182,838 tons by 2035, growing at a CAGR of 21.55% from 2026 to 2035.
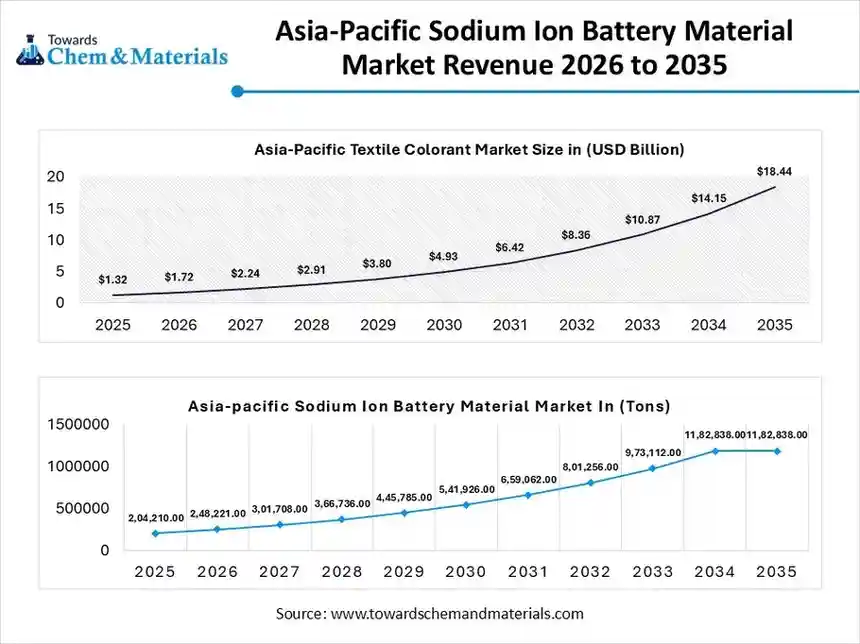
Asia Pacific dominated the market with a share of approximately 45.38% in 2025. Asia Pacific dominates the market due to strong battery manufacturing ecosystems, large-scale material processing capabilities, and active government support for alternative energy storage technologies. The region benefits from abundant raw material availability, cost-competitive production, and rapid commercialization of sodium-ion batteries for grid storage, electric mobility, and renewable integration, particularly as a lithium alternative.
China: Sodium Ion Battery Material Market Growth Trends
China leads the Asia Pacific sodium ion battery material market, driven by aggressive R&D investments, strong cathode and anode material production capacity, and early commercialization initiatives. Chinese manufacturers are focusing on Prussian blue analogues, hard carbon anodes, and scalable sodium salt electrolytes, supported by state-backed energy storage projects and expanding domestic demand for cost-effective battery solutions.
Sodium Ion Battery (SIB) Material Market Volume and Share, By Region, 2025 (%)
| By Region | Market Volume Share (%), 2025 | Market Volume (Million Tons)2025 | Market Volume (Million Tons)2035 | CAGR(%) 2026-2035 | Market Volume Share (%), 2035 |
| North America | 21.49% | 96,696.0 | 563,778.0 | 21.64% | 22.13% |
| Europe | 17.39% | 78,255.0 | 433,087.5 | 20.94% | 17.00% |
| Asia Pacific | 45.38% | 204,210.0 | 1,182,838.3 | 21.55% | 46.43% |
| Latin America | 9.12% | 41,040.0 | 213,996.2 | 20.14% | 8.40% |
| Middle East & Africa | 6.62% | 29,799.0 | 153,873.4 | 20.01% | 6.04% |
North Americas Growth In The Market Is Driven By Increased Investments
North America is expected to have fastest growth in the market in the forecast period between 2026 and 2035. North America represents a growing market for sodium-ion battery materials, supported by increasing investments in energy storage, grid modernization, and clean energy transition. The region emphasizes material innovation, pilot-scale manufacturing, and supply chain diversification to reduce reliance on lithium and critical minerals, particularly for stationary storage and backup power applications.
United States: Sodium Ion Battery Material Market Growth Trends
The U.S. sodium ion battery material market is driven by strong research institutions, startup activity, and federal funding for next-generation battery technologies. Companies are focusing on advanced cathode chemistries, sustainable anode materials, and scalable electrolyte formulations, with growing interest in sodium-ion batteries for grid-scale storage, defense applications, and low-cost energy resilience solutions.
Europes Growth In The Market Is Driven By The Stringent Regulations And Sustainability Initiatives
Europe’s sodium ion battery material market is shaped by stringent sustainability regulations, circular economy goals, and a strong emphasis on reducing dependence on imported lithium. The region is actively supporting alternative battery chemistries through public-private partnerships, research programs, and pilot manufacturing facilities targeting renewable energy storage and electric mobility applications.
Germany: Sodium Ion Battery Material Market Growth Trends
Germany plays a critical role in the European market, driven by advanced materials research, automotive electrification initiatives, and energy transition policies. German companies and research institutes focus on high-performance cathode materials, lifecycle optimization, and sustainable sourcing, positioning sodium-ion technology as a complementary solution for large-scale energy storage systems.
South America Sodium Ion Battery Material Market Long-Term Opportunity Drives Growth
South America is an emerging market for sodium-ion battery materials, supported by growing renewable energy deployment and increasing focus on energy storage for grid stability. The region’s access to raw materials, expanding industrial base, and interest in cost-effective storage technologies create long-term opportunities for sodium-ion battery material adoption.
Brazil: Sodium Ion Battery Material Market Growth Trends
Brazil’s sodium ion battery material market is driven by rising investments in renewable energy storage, particularly solar and wind. The country is exploring sodium-ion materials as an affordable alternative for stationary storage and rural electrification, supported by academic research, pilot projects, and increasing collaboration with international battery material suppliers.
Middle East & Africa (MEA) Sodium Ion Battery Material Market Government Support
The MEA region shows gradual adoption of sodium-ion battery materials, primarily driven by large-scale renewable energy projects and grid stabilization needs. Governments are exploring alternative battery chemistries to support energy diversification, reduce import dependency, and enable long-duration storage in harsh climatic conditions.
UAE: Sodium Ion Battery Material Market Growth Trends
The UAE is emerging as a strategic market for sodium-ion battery materials, supported by clean energy initiatives, smart grid development, and investments in advanced energy storage technologies. The country is exploring sodium-ion batteries for renewable integration, industrial backup systems, and research-driven pilot projects aligned with long-term energy sustainability goals.
Recent Developments
- In February 2025, the German government announced approximately €14 million in funding for a national research project titled "SIB: DE FORSCHUNG" aimed at accelerating the industrial implementation of sodium-ion battery technology. Coordinated by BASF, this project is Germanys largest initiative in this field, involving a consortium of 21 partners from industry and academia.(Source: www.electrive.com )
- In April 2025, CATL introduced its second-generation Shenxing Superfast Charging Battery and a new sodium-ion battery brand, Naxtra, at its first Super Tech Day in Shanghai. (Source: www.reuters.com)
- In June 2025, MIT-World Peace University (MIT-WPU) in Pune launched a battery fabrication and research facility. This facility is reportedly the first of its kind at a private state university in India.(Source: education21.in)
Top Players in the Sodium Ion Battery Material Market & Their Offerings:
- CATL (Contemporary Amperex Technology Co. Limited) (China): CATL is a major developer of sodium-ion battery technology and associated materials. The company produces sodium-ion cathode materials and hosts integrated material development aligned with its cell manufacturing ecosystem, targeting EVs, energy storage, and consumer electronics.
- AMYRIS Materials (USA/Global): Individuals and early players in sodium-ion chemistry, AMYRIS is developing novel sustainable electrode materials intended to enhance performance metrics and lifecycle sustainability of sodium-ion systems.
- Sichuan Tianqi Lithium Industries / affiliated units (China): Through collaborative ventures and material research groups, Tianqi advances sodium-ion material research, particularly high-capacity anode and electrolyte systems complementing its battery material portfolio.
- Li-Materials (China): Li-Materials engages in sodium-ion battery material development, focusing on scalable production of cathodes and anode materials designed to improve stability and performance for emerging storage applications.
- EnerVenue (USA): EnerVenue develops stationary energy storage systems using sodium-ion chemistry, leveraging robust, non-flammable materials suitable for grid storage, telecom backup, and microgrid applications.
Other Top Players Are
- AMYRIS Materials (USA/Global)
- Sichuan Tianqi Lithium Industries / affiliated units (China)
- Li-Materials (China)
- EnerVenue (USA)
- CATL (Contemporary Amperex Technology Co. Limited) (China):
- HiNa Battery Technology
- Natron Energy
- Altris AB
- Tiamat Energy
- NEI Corporation
- BTR New Material Group
- NGK Insulators, Ltd.
- Zhongke Haina
- Ronbay Technology
- Guizhou Zhenhua E-chem
- Beijing Easpring Material Technology
- Hunan Changyuan Lico
- Dofluoride New Materials (DFD)
- Shengquan Group
- Veken Technology
- TIANJIN B&M Science and Technology
- Putailai (PTL)
- Capchem Technology
Segments Covered
By Material Type
- Cathode Materials
- Layered Transition Metal Oxides
- Prussian Blue Analogues (PBA)
- Polyanionic Compounds (e.g., NASICON-type)
- Others (Organic, Amorphous)
- Anode Materials
- Hard Carbon (Bio-based, Resin-based, Coal-based)
- Soft Carbon
- Alloy-based Materials (Antimony, Tin)
- Metal Oxides/Sulfides
- Electrolytes
- Liquid Electrolytes (Organic Carbonates, Ether-based)
- Aqueous Electrolytes
- Solid-state Electrolytes (Oxides, Sulfides, Polymers)
- Separators
- Polyethylene (PE)
- Polypropylene (PP)
- Ceramic-coated Separators
- Current Collectors
By Battery Technology Type
- Ambient-Temperature Sodium-Ion
- High-Temperature (Molten) Sodium (NaS, Na-NiCl2)
- Solid-State Sodium-Ion
By Application
- Stationary Energy Storage
- Grid-scale Storage (Renewable Integration)
- Commercial & Industrial (C&I) Storage
- Residential Energy Storage
- Transportation
- Low-speed Electric Vehicles (LSEVs/E-bikes/Rickshaws)
- A/B-Segment Passenger EVs (City Cars)
- Electric Buses & Commercial Fleets
- Consumer Electronics
- Power Tools
- Portable Power Stations
- Industrial Power
- Telecom Backup Power (Base Stations)
- Data Center UPS (Uninterruptible Power Supply)
By Regions
- North America
- U.S.
- Canada
- Mexico
- Europe
- Germany
- UK
- France
- Italy
- Spain
- Asia Pacific
- China
- India
- Japan
- South Korea
- Latin America
- Brazil
- Argentina
- Middle East & Africa
- Saudi Arabia
- South Africa
A Seven-Phase Framework
Our methodology is designed to be universally applicable across commodity chemicals, specialty chemicals, petrochemicals, construction chemicals, coatings, electronic chemicals, industrial gases, agrochemicals, water treatment chemicals, and performance materials. Each phase builds upon the last, creating a layered validation structure that minimizes estimation error and maximizes analytical confidence.
The framework ensures comprehensive market coverage, robust cross-validation, and reliable long-term forecasting — producing market estimates that withstand scrutiny from investors, regulators, and corporate strategy teams.

Seven-Phase Framework — Analytical Effort Distribution
Relative analytical effort allocated across each phase of the Chemicals & Materials research framework

Phase 1 - Secondary Research: Establishing the Foundation
Secondary research collects and evaluates publicly available information from authoritative sources, establishing the foundational understanding of market structure, value chain dynamics, competitive landscape, and end-use demand patterns. Every source is evaluated for credibility, recency, geographic relevance, and methodological soundness before inclusion.
Industry Associations
Sources include ACC, CEFIC, ICCA, JCIA, CPCIF, and SOCMA providing production volumes, consumption trends, capacity developments, and sustainability initiatives.
Company Disclosures
Annual reports, investor presentations, earnings transcripts, and regulatory filings reveal product portfolios, manufacturing footprints, capacity expansions, and revenue segmentation.
Government Databases
National statistical offices, customs authorities, environmental agencies, and industrial production databases provide verified statistics on output, trade flows, and regulatory compliance.
Trade Databases
UN Comtrade, ITC, Eurostat, and national customs authorities enable assessment of global product movement, import dependency, and export competitiveness across regions.
Our Secondary Research Sources
- Ministry of Chemicals and Fertilizers
- European Chemicals Agency
- United States Department of Energy
- Ministry of Industry and Information Technology
- Ministry of Economy Trade and Industry
- Ministry of Trade Industry and Energy
- National Institute of Standards and Technology
- Council of Scientific and Industrial Research
- Fraunhofer Society
- National Institute for Materials Science
Phase 2 — Supply-Side Assessment: Mapping Production Capabilities
Production Capacity Analysis
All major manufacturers are assessed for existing installed capacity, planned additions, expansions, new plant announcements, and technology adoption — mapped at global, regional, and country levels.
Capacity Utilization Adjustment
Installed capacity is adjusted using utilization rates based on demand conditions, feedstock availability, plant operating rates, maintenance schedules, and regulatory restrictions.
Manufacturer Revenue Analysis
Product-specific revenues, segment-level performance, regional distribution, average selling prices, and margin trends are evaluated to establish market value estimates.
Supply-Side Assessment — Capacity vs. Effective Production by Region
Illustrative comparison of installed capacity vs. effective production volume (after utilization rate adjustment) across major regions

Phase 3 — Demand-Side Assessment: Quantifying Chemical Consumption
Demand-side analysis quantifies chemical consumption across industries, applications, and geographies — identifying where and how chemicals are consumed throughout the value chain with precision.
End-Use Industry Analysis
Chemical demand is evaluated across automotive, construction, packaging, electronics, agriculture, healthcare, consumer goods, industrial manufacturing, energy and utilities, and water treatment. Industry output, production trends, and consumption intensity are analyzed to determine demand patterns.
Consumption Modeling
Demand is estimated using measurable indicators: kilograms per vehicle, kilograms per square meter of construction, dosage per cubic meter of water treated, kilograms per hectare of agricultural land, and kilograms per ton of manufactured products. Consumption factors are validated through industry publications and primary interviews.
Application Analysis
The market is segmented by application area to understand product performance requirements, formulation trends, technology adoption, customer preferences, and regulatory requirements improving demand accuracy and segmentation granularity.
Demand-Side Assessment — End-Use Industry Demand Distribution
Illustrative distribution of chemical & materials demand across key end-use industries

Phase 4 - Trade Flow Analysis: Balancing Regional Supply and Demand
Trade flow analysis reconciles regional supply and demand estimates through import and export data, identifying net supply positions, regional dependencies, and market imbalances. It serves as an independent validation layer that tests the consistency of supply-side and demand-side estimates.
Import Analysis
Import data is evaluated to determine volumes, source countries, product dependency, regional supply gaps, and pricing trends — identifying markets that rely heavily on external supply and where domestic production is insufficient to meet demand.
Export Analysis
Export assessments reveal production surplus, export competitiveness, regional manufacturing strength, and global market participation. Export patterns also help validate domestic production estimates and identify net exporting regions.
Apparent Consumption Model
Regional consumption is assessed using the standard apparent consumption formula:
Results identify net importing regions, net exporting regions, regional deficits, and surpluses — serving as an independent validation of supply and demand estimates.
Trade Flow Analysis — Net Supply Position by Region
Illustrative apparent consumption vs. domestic production across major regions — positive gap indicates net import dependency

Phase 5 — Primary Research: The Critical Validation Layer
Primary research tests and refines findings from secondary research through direct engagement with industry participants across the supply chain, demand side, and expert community. It captures intelligence that no database or published report can provide — the real-world experience of manufacturers, buyers, and specialists operating in the market.

Supply-Side Interviews
Conversations with chemical manufacturers, raw material suppliers, contract manufacturers, technology providers, and plant operators cover production trends, capacity utilization, pricing developments, technology shifts, and competitive dynamics.

Demand-Side Interviews
Engagement with OEMs, industrial consumers, procurement managers, distributors, formulators, and end-use manufacturers focuses on consumption trends, purchasing behavior, product substitution, demand outlook, and emerging applications.

Industry Expert Consultations
Additional interviews with industry consultants, independent experts, regulatory specialists, technical professionals, and research institutions provide deeper market context and validate key analytical assumptions.
Focus Areas of Primary Research:
Market Size & Forecast Validation
Revenue estimates, volume consumption, growth rates, forecast assumptions, regional demand.Supply Chain & Value Chain Assessment
Raw material sourcing, supply chain challenges, distribution networks, procurement practices.Production & Capacity Analysis
Manufacturing capacity, utilization rates, expansion projects, plant investments.Pricing & Cost Structure Analysis
Product pricing trends, feedstock costs, energy costs, margin pressures, pricing outlook.Competitive Landscape Assessment
Volume and value estimates confirmed to be fully consistent with one another before publicationInterview Volume by Market Scope
| Study Scope | Number of Interviews |
|---|---|
| Niche Market | 20 – 30 |
| Mid-Sized Market | 30 – 50 |
| Global Market | 50 – 80 |
| Highly Fragmented Market | 80 – 120 |
Interview Details:
Category : Manufacturers, Suppliers, Distributors, End Users, Experts/Associations
Average Duration : 30–60 Minutes
Interview Mode : Video calls, telephonic interviews, expert consultations
Interview Format : Structured / Semi-Structured questionnaire
Focus Areas of Primary Research:
Market Size & Forecast Validation :
Revenue estimates, volume consumption, growth rates, forecast assumptions, regional demand.
Supply Chain & Value Chain Assessment :
Raw material sourcing, supply chain challenges, distribution networks, procurement practices.
Production & Capacity Analysis :
Manufacturing capacity, utilization rates, expansion projects, plant investments.
Pricing & Cost Structure Analysis :
Product pricing trends, feedstock costs, energy costs, margin pressures, pricing outlook.
Competitive Landscape Assessment :
Market share, competitor positioning, strategic initiatives, partnerships, acquisitions.
Primary Research — Stakeholder Coverage by Category
Distribution of interview respondents across stakeholder categories (% share from PPT data)

Primary Research — Respondent Designation Profile
Seniority breakdown of interview respondents (% share from PPT data)

Primary Research — Geographic Coverage of Interviews
Regional distribution of primary research engagement (% share from PPT data)

Phase 6 — Data Triangulation and Market Validation
No single methodology is relied upon in isolation. Multiple independent estimation approaches are combined and reconciled to ensure consistency, accuracy, and analytical defensibility. Any material deviations between approaches are investigated and adjusted through additional validation cycles.
The final market size is derived through weighted triangulation of all validated methodologies. Any material deviations between approaches are investigated and adjusted through additional validation cycles. The outcome represents the most realistic assessment of the market based on available evidence and expert confirmation ensuring that volume and value estimates are fully consistent with one another.
Triangulation Framework — Input Contribution Weight
Relative weight each sizing input contributes to the final reconciled market estimate

Phase 7 — Forecast Modeling: Projecting Future Market Evolution
Forecasting evaluates the future trajectory of the market using a combination of quantitative indicators and qualitative assessments across economic, industry, and regulatory dimensions. Rather than simple extrapolation, each driver is independently modeled and integrated into a composite forecast.
Macroeconomic Indicators
GDP growth, industrial production, manufacturing output, construction activity, consumer spending, and capital investment form the quantitative foundation of long-term demand projections. These are applied at country, regional, and global levels.
Industry Growth Drivers
Urbanization, infrastructure development, industrialization, technological innovation, sustainability initiatives, and evolving product performance requirements are assessed at regional and industry levels — capturing both structural and cyclical demand drivers.
Capacity Expansion Analysis
Announced plant expansions, new manufacturing facilities, technology upgrades, and strategic investments are evaluated to determine future supply-demand dynamics and potential market tightness or oversupply situations.
Regulatory & Sustainability
Environmental regulations, chemical safety standards, emission reduction targets, circular economy initiatives, and sustainability requirements are incorporated as they often influence product adoption rates and market growth trajectories.
Scenario Forecast Range — Indexed Market Growth (Year 1–10)
Illustrative indexed growth trajectories across Base, Optimistic, and Pessimistic scenarios over a 10-year forecast horizon

Forecast Drivers — Relative Impact Score by Category
Impact score (0–100) of each driver type on chemicals & materials market forecast




Comments
Share your thoughts, ask a question, or provide feedback about this report.