
Advanced Biofuels Market Size and Forecast 2026 to 2035
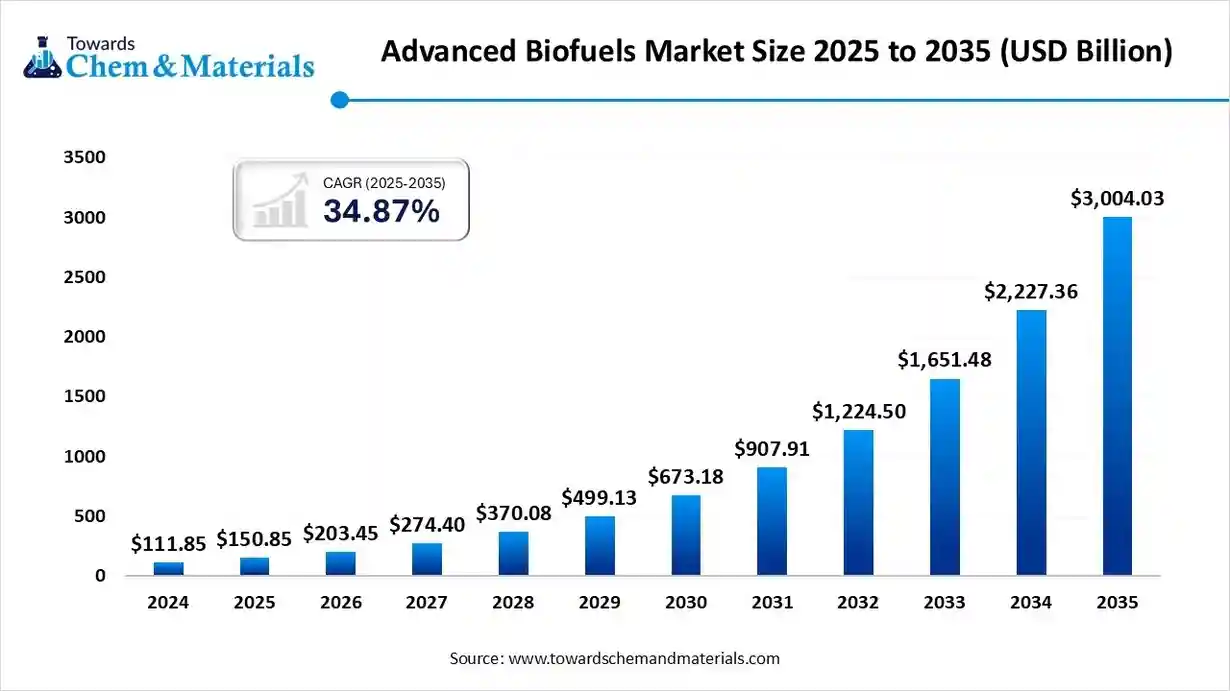
The global advanced biofuels market size is calculated at USD 150.85 billion in 2025 and is predicted to increase from USD 203.45 billion in 2026 and is projected to reach around USD 3,004.03 billion by 2035, The market is expanding at a CAGR of 34.87% between 2025 and 2035. Asia Pacific dominated the advanced biofuels market with a market share of 40% the global market in 2024. The strong focus on energy security and the growing demand for sustainable road and aviation fuel drive the market growth.
Key Takeaways
- By region, North America led the advanced biofuels market with an approximately 35-40% share in 2024.
- By region, Asia Pacific is growing at the fastest CAGR in the market during the forecast period.
- By fuel type, the renewable diesel or HVO segment led the advanced biofuels market with an approximately 40-48% share in 2024.
- By fuel type, the sustainable aviation fuel segment is set to grow at the fastest CAGR in the market during the forecast period.
- By feedstock, the waste & residues segment led the market for advanced biofuels in 2024.
- By feedstock, the algae segment is expected to grow at the fastest CAGR in the market during the forecast period.
- By technology/conversion pathway, the hydrotreating or hydroprocessing (HVO) segment led the advanced biofuels sector in 2024.
- By technology/conversion pathway, the pyrolysis & upgrading segment is expected to grow at the fastest CAGR in the market during the forecast period.
- By end-use/application, the road transport segment led the advanced biofuels market in 2024.
- By end-use/application, the aviation segment is expected to grow at the fastest CAGR in the market during the forecast period.
- By distribution/supply chain, the direct supply to fuel blenders or the integrated petrol companies segment led the advanced biofuels industry in 2024.
- By distribution/supply chain, the airport fuel supply & book-and-claim segment is growing at the fastest CAGR in the market during the forecast period.
Advanced Biofuel Frontiers: Catalyst Drives Market Growth
The advanced biofuels market is driven by the energy transition, strong government support for biofuel adoption, advancements in production processes, increasing energy security needs, and the expansion of the feedstock base.
What are Advanced Biofuels?
Advanced biofuels are low-carbon transport fuels manufactured from non-food feedstocks, such as agricultural waste, using technologies like hydrotreating, Fischer-Tropsch, and biochemical fermentation. They minimize greenhouse gas emissions up to 70-80%. Advanced biofuels include algae-based fuels, cellulosic ethanol, HVO, biobutanol, and renewable diesel.
Advanced Biofuels Industry Outlook:
- Industry Growth Overview: Between 2025 and 2034, the industry is expanding in high-margin niches such as transportation, aviation, and maritime. Growth is being reinforced by climate goals and growing energy generation, particularly in Brazil, Germany, North America, and China.
- Global Expansion: Major players are expanding globally to align with climate goals, energy demand, and decarbonization, particularly into the United States, Brazil, India, the EU, China, and Germany. HutanBio announced a strategic expansion plan for its HBx biofuel platform in Cambridge to support the aviation and marine sectors.
- Major Investors: Major agricultural companies and key oil & gas players are actively investing in the space, drawn by climate goals, government mandates, and energy independence. Companies like Chevron, TotalEnergies, Cargill, BP, and Shell are investing in the advanced biofuel industry.
Report Scope
| Report Attributes | Details |
| Market Size in 2026 | USD 203.45 Billion |
| Expected Size by 2035 | USD 3,004.03 Billion |
| Growth Rate from 2025 to 2035 | CAGR 34.87% |
| Base Year of Estimation | 2024 |
| Forecast Period | 2026 - 2035 |
| Leading Region | North America |
| Fastest Growing Region | Asia Pacific |
| Segment Covered | By Fuel Type, By Feedstock, By Technology / Conversion Pathway, By End-Use / Application, By Distribution / Supply Chain, By Region |
| Key Companies Profiled | Neste Corporation, Gevo, Inc., LanzaJet / LanzaTech, LanzaTech,World Energy,Velocys plc,Fulcrum BioEnergy,Renewable Energy Group (REG) ,Chevron Corporation, BP, Shell plc , TotalEnergies, POET LLC, Archer Daniels Midland (ADM), Praj Industries,KBR, Inc., Ensyn Corporation, Enerkem Inc, Virent, Inc, • Honeywell UOP |
Key Technological Shifts in the Advanced Biofuels Market:
The advanced biofuels market is undergoing key technological shifts driven by demand for sustainability, lower costs, and improved performance. One of the most significant transformations is the integration of Artificial Intelligence (AI), enabling manufacturers to reduce greenhouse gas emissions and manage supply chains. AI helps select sustainable biomass feedstocks and optimize nonlinear conversion processes. AI maximizes biofuel yield and reduces energy consumption. AI optimizes supply chain operations and easily discovers new catalysts for conversion reactions.
- For instance, ExxonMobil uses AI to accelerate the selection of high-yielding algae strains.
- Trade Analysis of the Advanced Biofuels Market: Import & Export Statistics
Main Product Types & HS/Trade Proxies
- Renewable diesel / HVO (hydrotreated vegetable oil): fungible drop-in diesel substitute; widely tracked in fuel statistics and customs under refined oil/product lines in many datasets (often proxied by dedicated national import statistics rather than a clean global HS code).
- Sustainable Aviation Fuel (SAF, HEFA/ATJ/FT pathways): traded as blendstocks or finished jet-grade fuels; early trade often recorded via supplier contract volumes (airlines, airports) and SAF project disclosures.
- Advanced biodiesel (FAME from waste feedstocks) and advanced ethanol (cellulosic ethanol/ATJ feedstock): continue to appear in biodiesel/ethanol trade lines but at a lower unit value than HVO/SAF.
Because customs classification varies by country, much of the best trade intelligence comes from national energy agencies, company disclosures, and specialized trackers rather than a single HS line.
Top Exporters (Who Is Shipping Advanced Biofuels)
- Netherlands / Rotterdam hub (Europe) - major export routing for processed renewable diesel and SAF blendstocks: Europe’s large refining and blending infrastructure, plus companies like Neste and regional traders, route product via Rotterdam and other ports for onward export. The Netherlands functions as both a finishing and re-export node. Centraal Bureau voor de Statistiek+1
- Singapore (Neste and regional refining capacity)- significant supplier of renewable diesel and SAF blendstocks into Asia and the U.S. market via ocean shipments; U.S. import data show Neste Singapore as a dominant supplier into U.S. renewable diesel imports. U.S. Energy Information Administration
- United States - an exporter of biodiesel and renewable diesel in certain years (volumes fluctuate with policy incentives and RIN/credit dynamics); U.S. refined product exports include biodiesel and renewable diesel blendstocks to neighboring markets. BiobasedDieselDaily+1
- Indonesia & Malaysia - major exporters of palm-based HVO/renewable diesel to markets that accept palm feedstock, especially to some Asian and European buyers subject to sustainability screening.
- Emerging exporters (China / selected Gulf refiners) — capacity additions and policy moves are enabling more countries to export SAF/renewable diesel; some nations are issuing export approvals/quotas for SAF in 2025.
Top Importers / Demand Centres
- United States: large importer of renewable diesel in recent years (noting volumes have been sensitive to tax and incentive changes), and an increasing buyer of SAF via offtake deals and book-and-claim mechanisms. U.S. port import data and corporate purchases show meaningful inbound renewable diesel/SAF volumes.
- European Union: major importer and exporter (because it both produces and trades finished fuels) — EU refiners import feedstocks and sometimes final HVO/renewable diesel and SAF blendstocks depending on regional economics and mandates. EU demand for SAF is driven by EU ReFuelEU SAF targets.
- Asia (Japan, South Korea, China): growing importers of renewable diesel and SAF feedstocks as national decarbonization and SAF targets develop; Singapore is a regional export hub as well.
- Airlines & airports (via purchase agreements): many airline contracts constitute de-facto import demand even when physical supply is blended regionally or managed via book-and-claim accounting. NREL and industry trackers document large corporate SAF purchase volumes.
Typical trade flows and patterns
- Refinery/merchant exports through major ports (Rotterdam, Singapore): finished renewable diesel and SAF blendstocks move from coastal refineries (Neste Singapore/Rotterdam, European HVO plants) to importing refiners or fuel terminals. Rotterdam and Singapore are notable chokepoints/hubs.
- Bilateral regional flows: North America ↔ Latin America (renewable diesel/biodiesel), Europe ↔ Africa/Asia (palm/HVO feedstock-driven shipments), and growing intra-Asia flows. Policy shifts can rapidly flip these lanes.
- Contract/offtake trade for SAF: much SAF trade is bilateral (producer ↔ airline) and recorded in corporate disclosures more than in customs; book-and-claim and supply-chain tracing services are often used when physical delivery is impractical.
Trade Drivers (Policy, Economics, Feedstocks)
- Policy mandates & incentives — Renewable Fuel Standard (US RFS), Low Carbon Fuel Standards (California/BC), EU RED II/III and ReFuelEU SAF targets, SAF targets, and SAF Grand Challenges drive import demand where domestic supply is insufficient. Policy changes (tax credits, eligibility rules) strongly affect import volumes.
- Feedstock availability — used cooking oil (UCO), waste fats, and palm oil (where accepted) underpin production economics; scarcity or sustainability restrictions on feedstocks alter trade lanes and exporter choice.
- Capex and refinery capacity — new HVO and SAF plants change which countries export; countries building large plants (or hosting multinationals’ plants) become net exporters once commissioned. IEABioenergy maintains a database of demonstration & commercial projects tracking how capacity shifts will shape trade.
- Carbon accounting & voluntary corporate demand — airlines and corporates buying SAF (often via long-term contracts) create reliable import streams even if physical delivery is managed through blending or book-and-claim. NREL and industry reports document these offtake volumes.
Recent Policy Shocks & Their Trade Impact
- Tax-credit eligibility changes / domestic preference: When tax credits or incentives are restricted to domestic producers (or retargeted), imports can plunge quickly — recent U.S. policy adjustments have driven sharp falls in renewable diesel/biodiesel imports in 2025. This shows how shifts in fiscal policy reroute global trade almost immediately.
- Export approval/quota policies (e.g., China SAF export quotas in 2025): governments issuing export quotas or approvals for SAF can rapidly create new export capacity aimed at Europe/Asia demand centers. Such moves change supplier lists and trade flows.
Advanced Biofuels Market Value Chain Analysis
- Feedstock Procurement :Feedstock procurement is the sourcing of non-food raw materials, such as dedicated energy crops, algae, agricultural residues, and waste streams.
- Key Players: Neste, Wilmar International Ltd, Royal Dutch Shell Plc, Valero Energy Corp
- Chemical Synthesis and Processing : Chemical synthesis and processing involve methods like hydrotreating, biochemical fermentation, hydroprocessing, pyrolysis, and hydrothermal liquefaction.
- Key Players: LanzaTech, Enerkem, ADM, Gevo, Inc., Neste Oyj, Clariant
- Quality Testing and Certifications :Quality testing involves testing of purity, contaminants, density, kinematic viscosity, oxidation stability, & composition, and certifications include RSB, BQ-9000, Better Biomass Certification, & ISCC.
- Key Players: Intertek Group plc, Eurofins Scientific, SGS SA, Bureau Veritas
Introduction to Biofuels Policy Across the World
| Policy | Country | Introduced Year | Aim |
| Renewable Fuel Standards | United States | 2005 | Expansion of the Renewable Fuel Sector |
| National Policy on Biofuels 2018 | India | 2018 | Lower Reliance on Imported Crude Oil |
| RenovaBio Program | Brazil | 2017 | Promote Biofuels and Lower GHG Emissions |
| Renewable Energy Directive II | European Union | 2018 | Increase Use of Renewable Energy |
Segmental Insights
Fuel Type Insights
Why the Renewable Diesel or HVO Segment Dominates the Market for Advanced Biofuels?
The renewable diesel (HVO) segment dominated the advanced biofuels market in 2024. The growing demand for high-quality fuels and the strong focus on carbon-reduction goals require renewable diesel. The high availability of raw materials, such as fats and waste oils, increases production of HVO & renewable diesel. Superior performance, engine compatibility, and feedstock flexibility drive market growth. The growing expansion of the transportation sector is driving the overall market growth, as it requires renewable diesel or HVO.
The sustainable aviation fuel (SAF) segment is the fastest-growing in the market during the forecast period. The focus on reducing carbon emissions and the growing demand for energy security are driving the adoption of SAF. The presence of feedstocks like municipal solid waste, agricultural waste, and cooking oil increases SAP production. The rise in air travel and the expansion of the aviation industry require SAP, supporting the overall market growth.
The advanced biodiesel segment is growing rapidly in the market. The strong focus on replacing petroleum-based fuels and minimizing GHG emissions increases the adoption of advanced biodiesel. The focus on reducing carbon footprints and the global push for decarbonization require advanced biodiesel. Growing sectors such as transportation and aviation are driving demand for advanced biodiesel, fueling overall market growth.
Feedstock Insights
How Did the Waste & Residues Segment Hold the Largest Share in the Advanced Biofuels Sector?
The waste & residues segment held the largest revenue share in the advanced biofuels sector in 2024. Growing concerns about food security and the government's focus on meeting renewable energy targets are increasing demand for waste & residues. The growing need to reduce greenhouse gas emissions and the focus on lowering landfill waste are increasing the adoption of waste & residues. The high availability of forestry and agricultural residues, such as municipal waste & used cooking oils, drives market growth.
The algae segment is expected to grow the fastest in the market during the forecast period. The strong focus on the adoption of sustainable feedstocks and the presence of high-energy-density algae increase demand for algae. The growing cultivation of algae in wastewater and improvements in algae strains are driving market growth. The growing production of biogas, biodiesel, and bioethanol requires algae that support the overall market growth.
The lignocellulosic residues segment is significantly growing in the market. The abundance of wood waste & corn stover, along with the low cost of lignocellulosic residues, supports market growth. The growing demand to reduce the environmental impact of waste disposal increases demand for lignocellulosic residues. The high production of biogas & bioethanol, along with advancements in conversion technologies & pretreatment, support overall market growth.
Technology Insights
Why the Hydrotreating and Hydroprocessing Segment is Dominating the Advanced Biofuels Market?
The hydrotreating or hydroprocessing (HVO) segment dominated the advanced biofuels market in 2024. The presence of a wide variety of feedstocks, such as waste cooking oils, vegetable oils, & animal fats, and a focus on high energy efficiency increase the use of hydroprocessing techniques. The compatibility of hydrotreating with existing refineries and the focus on streamlining steps like cracking, deoxygenation, & isomerization help drive market growth. The stricter sustainability goals and the focus on increasing oxidation stability are driving the overall market growth by requiring hydrotreating methods.
The pyrolysis and upgrading segment is the fastest-growing in the market during the forecast period. The growing production of syngas, bio-oil, and biochar increases demand for pyrolysis. The focus on processing abundant feedstocks and compatibility with existing infrastructure increases the adoption of pyrolysis & upgrading. The growing decarbonization in sectors such as heavy-duty transport and aviation increases demand for pyrolysis, supporting overall market growth.
The biochemical fermentation segment is growing rapidly in the market for advanced biofuels. The growing use of sustainable feedstocks and advances in biotechnology are increasing the adoption of biochemical fermentation. The focus on minimizing greenhouse gas emissions and reducing environmental impact requires the use of biochemical fermentation. The flexibility in operating conditions, such as lower pressure and temperature in biochemical fermentation, drives the overall market growth.
End-Use Insights
Why the Road Transport Segment Held the Largest Share in the Advanced Biofuels Industry?
The road transport segment held the largest revenue share in the advanced biofuels industry in 2024. The focus on lowering environmental impact and replacing diesel & gasoline increases the adoption of advanced biofuels. The growing use of heavy-duty trucks and the high presence of light-duty trucks require advanced biofuels. The growing expansion of the transportation sector and the need to mitigate climate change require advanced biofuels to drive overall market growth.
The aviation segment is expected to grow the fastest in the market during the forecast period. The focus on reducing aviation's climate impact and achieving net-zero goals in the aviation & airlines sectors increases the adoption of advanced biofuels. The rise in air travel and airlines' adoption of biofuels help market growth. Fluctuations in petroleum-based fuels and strong government support for sustainable aviation fuel are driving overall market growth.
The marine segment is significantly growing in the market for advanced biofuels. The International Maritime Organization regulations and a strong focus on lowering GHG emissions in marine transport require advanced biofuels. The focus on lowering reliance on fossil fuels and decarbonization targets in marine transport requires advanced biofuels. The expansion of maritime transport supports the overall market growth.
Distribution Insights
Which Distribution Segment Dominated the Advanced Biofuels Industry?
The direct supply to fuel blenders & refiners or the integrated petrol companies segment dominated the advanced biofuels industry in 2024. The focus on streamlining logistics and reducing transportation costs increases the adoption of direct supply. The presence of extensive infrastructure for distribution, processing, and storage within integrated oil companies supports market growth. Operational expertise and investment in production facilities drive overall market growth.
The airport fuel supply & book-&-claim segment is the fastest-growing in the market during the forecast period. The aviation industry’s decarbonization commitments and the presence of refining technologies increase demand for airport fuel supply. The focus on GHG emission reduction and net-zero emission targets is based on the airport's fuel supply. Stable prices and a focus on enhancing energy security support market growth.
The B2B offtake agreements segment is growing rapidly in the market. The growing advancements in biofuel production and increasing investment in advanced biofuel facilities require B2B offtake agreements. The corporate sustainability targets and the focus on mitigating the risk associated with fluctuating fossil fuel prices require B2B offtake agreements that support overall market growth.
Regional Insights
The North America advanced biofuels market size was valued at USD 60.34 billion in 2025 and is expected to surpass around USD 1,201.61 billion by 2035, expanding at a compound annual growth rate (CAGR) of 34.89% over the forecast period from 2025 to 2035.
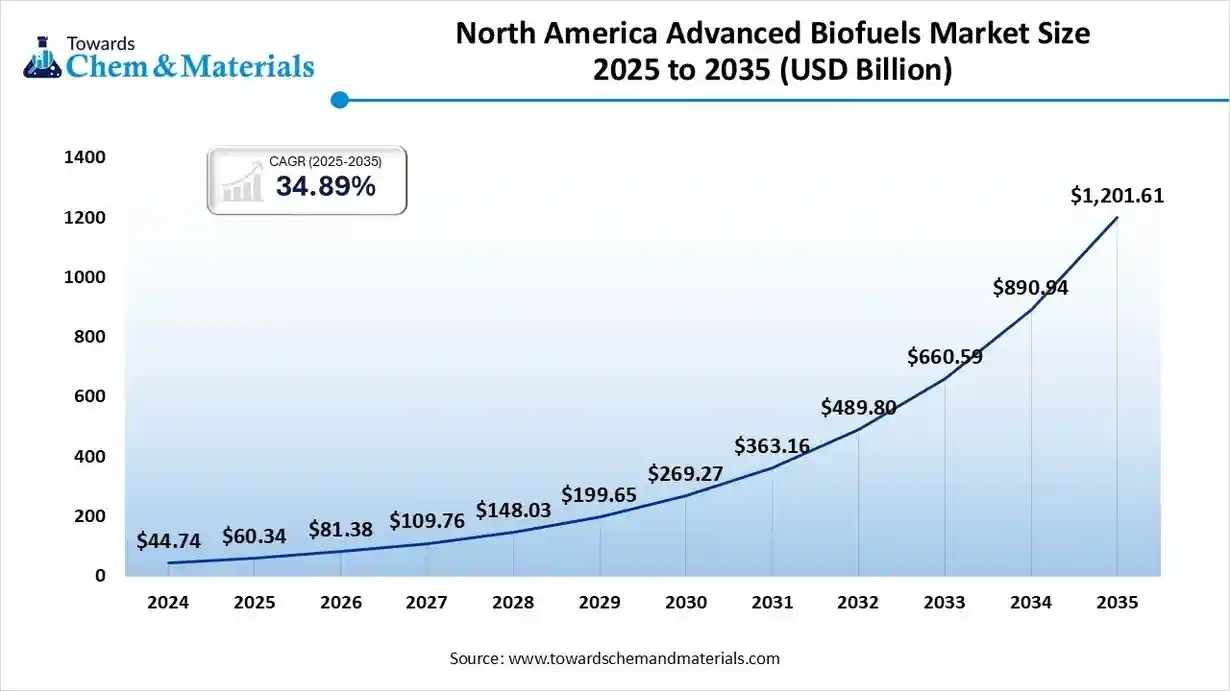
North America dominated the advanced biofuels market in 2024. Growing energy security concerns and a strong focus on reducing carbon emissions are increasing demand for advanced biofuels. The high production of renewable diesel and ethanol helps market growth. The strong corporate commitments to use sustainable aviation fuel and the automotive industry's growing expansion require advanced biofuels, driving overall market growth.
BioTech & Beyond: United States Role in Advanced Biofuels
The United States is a major contributor to the market for advanced biofuels. The strong mandates for advanced biofuels like renewable diesel & biodiesel, and initiatives for low-carbon fuel standards, help the market growth. The growing expansion of the aviation and transportation sector requires advanced biofuels. The presence of large refining capacity and well-established infrastructure for advanced biofuels supports the overall market growth.
Asia Pacific Advanced Biofuels Industry Trends
Asia Pacific is experiencing the fastest market growth during the forecast period. The strong government support for biofuel blending and the focus on reducing reliance on imported fossil fuels increase demand for advanced biofuels. The increasing energy consumption and growing industrial activity require advanced biofuels. The presence of abundant feedstocks like non-food crops and agricultural by-products increases the production of advanced biofuels. The increasing investment in SAP production and advanced biofuel production facilities supports the overall market growth.
Renewable Horizons: China Advanced Biofuels Outlook
China is a key contributor to the advanced biofuels sector. Strong government support for the consumption of sustainable aviation fuel and for increasing biofuel production helps drive market growth. The availability of abundant feedstocks, such as agricultural byproducts, algae, and waste oil, increases the production of advanced biofuels. Growing energy security concerns and innovations in biofuel production technology are driving market growth.
- China exported 149 shipments of biogas, with most of the Biogas exports from China going to India, the United States, and Uganda.(Source: www.volza.com )
Europe Advanced Biofuels Market Trends
Europe is growing rapidly in the advanced biofuels market. The focus on reducing reliance on fossil fuels and on climate and carbon-neutrality goals increases demand for advanced biofuels. The growing expansion of the transportation sector and the increasing use of maritime & aviation transport require advanced biofuels. The increasing investment in distribution systems and bio-refineries supports the overall market growth.
- The European Union announced an investment of €3 billion to scale up production of sustainable aviation fuel and cut air travel emissions.(Source: aerospaceglobalnews.com )
Green Nation: Germany’s Path to Net Zero Emissions
Germany is significantly growing in the advanced biofuels market. The stricter greenhouse gas emission targets and German policy support for biofuel production increase demand for advanced biofuels. The growing concerns about energy security and the focus on lowering energy dependence require advanced biofuels. The growing expansion of the heavy-duty road vehicle fleet, aviation, and maritime transport requires advanced biofuels, supporting the overall market growth.
South America Advanced Biofuels Market Trends
South America is growing rapidly in the advanced biofuels market. The abundance of feedstocks such as soybeans and sugarcane in countries like Argentina and Brazil increases the production of advanced biofuels. The focus on lowering dependence on imported fossil fuels and increasing energy security concerns increases demand for advanced biofuels, driving the overall market growth.
NextGen Bioenergy: Brazil’s Path to Advanced Biofuels
Brazil is growing in the advanced biofuels market. The strong existing advanced biofuel production infrastructure and supportive government policies help market growth. The presence of diverse feedstocks and a shift towards sustainable energy sources require advanced biofuels. Increasing investment in advanced biofuels, such as cellulosic ethanol, supports overall market growth.
Advanced Biofuels Market Share, By Region, 2024 (%)
| Regional | Revenue Share |
| North America | 24% |
| Europe | 18% |
| Asia Pacific | 40% |
| Latin America | 10% |
| Middle East and Africa | 8% |
Middle East & Africa Advanced Biofuels Market Trends
The Middle East & Africa are growing in the advanced biofuels market. The growing demand for energy and a strong focus on energy security require advanced biofuels. Decarbonization goals in industries such as shipping and aviation require advanced biofuels. The increasing investment in renewable energy projects and the presence of abundant feedstocks drive the market growth.
United Arab Emirates Advanced Biofuels Market Trends
The United Arab Emirates is growing in the advanced biofuels market. The strong focus on reducing reliance on fossil fuels and diversifying energy sources increases demand for advanced biofuels. The decarbonization goals and the presence of a major aviation hub require advanced biofuels that support the overall market growth.
Recent Developments
- In September 2025, Lootah Biofuels launched sustainable aviation fuel in the UAE. The SAF reduces GHG emissions up to 80% and ensures cleaner combustion. SAF is widely used in private jets, government fleets, airlines, ground support vehicles, and cargo carriers.(Source: bioenergytimes.com)
- In September 2025, Petronas delivered its first local sustainable aviation fuel to Malaysia Airlines. This initiative supports decarbonization and energy transition.(Source: infra.economictimes.indiatimes.com)
- In November 2024, BioVeritas launched the BioVeritas Process for SAF. The process comprises three steps and addresses challenges in SAF production. The SAF focuses on achieving net-zero carbon emissions and supports the aviation industry.(Source: biodieselmagazine.com)
Top Companies in the Advanced Biofuels Market
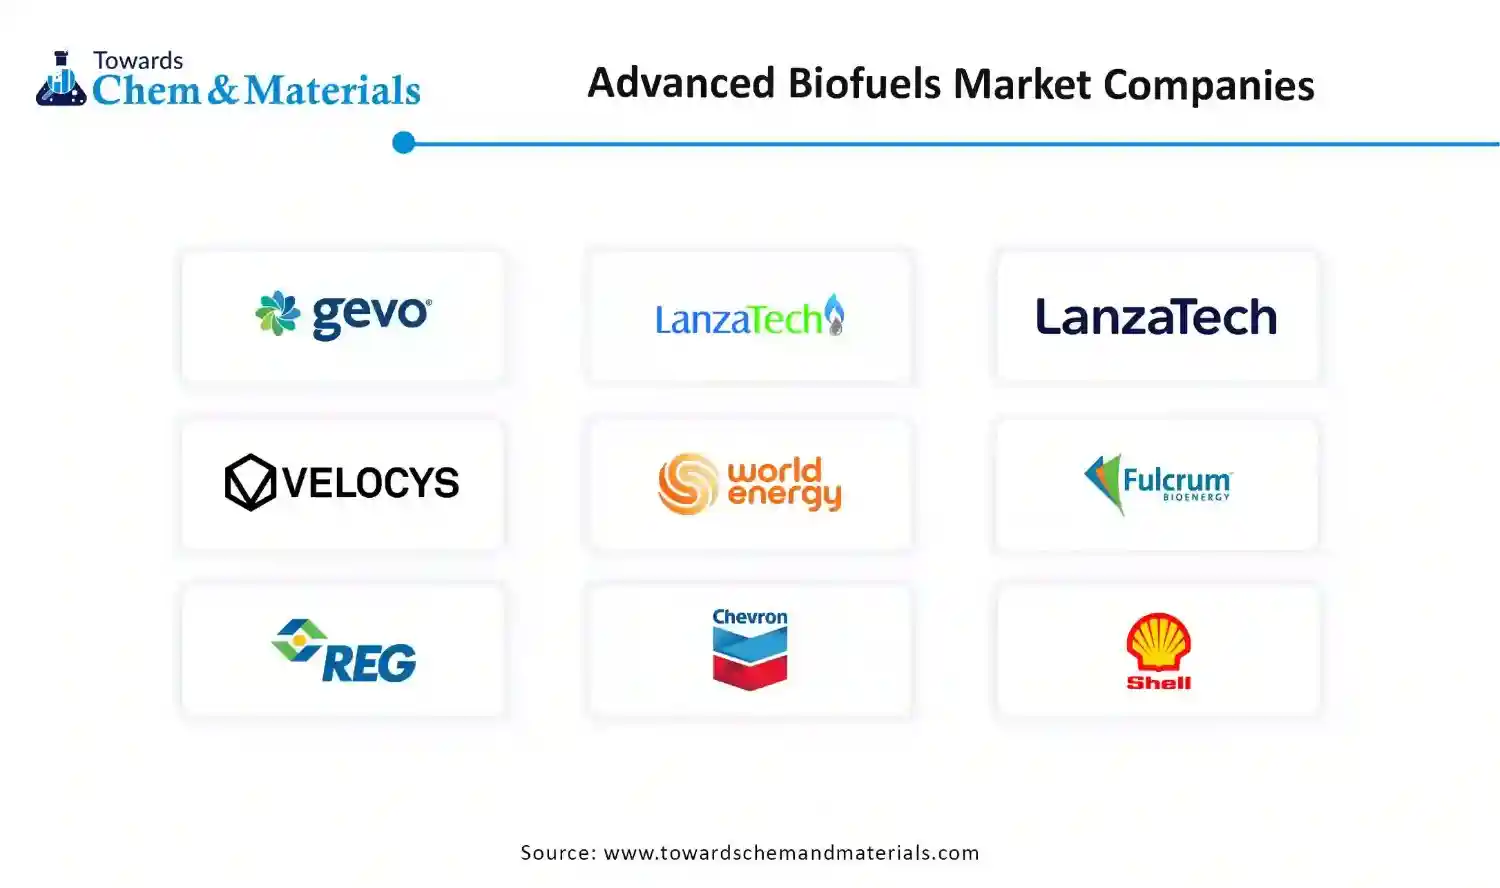
- Neste Corporation – Neste is the world’s largest producer of renewable diesel and sustainable aviation fuel (SAF), utilizing waste oils, animal fats, and residues as feedstocks. The company operates large-scale biorefineries in Europe, Singapore, and the U.S., enabling global distribution of low-carbon fuels and expanding into renewable feedstock innovation.
- Gevo, Inc. – Gevo develops advanced biofuels using isobutanol-based fermentation processes to produce SAF and renewable hydrocarbons. Its technology converts agricultural feedstocks into low-carbon fuels compatible with existing infrastructure, targeting decarbonization in aviation and heavy transport.
- LanzaJet / LanzaTech – LanzaTech converts industrial off-gases and waste carbon into ethanol, while its affiliate LanzaJet transforms that ethanol into SAF using its proprietary alcohol-to-jet (ATJ) process. Together, they form a vertically integrated carbon recycling model for sustainable fuel production from waste gases and residues.
- LanzaTech – LanzaTech’s gas fermentation technology captures carbon from industrial emissions, municipal waste, and syngas to produce ethanol and other chemicals. Its microbial process offers a circular solution to carbon utilization, significantly lowering lifecycle emissions in fuel and chemical manufacturing.
- World Energy – World Energy is one of the first commercial producers of SAF and renewable diesel in North America, operating large-scale production at its World Energy Paramount facility. The company partners with airlines and logistics firms to deliver certified low-carbon aviation fuel at a commercial scale.
- Velocys plc – Velocys is a UK-based technology licensor and project developer specializing in Fischer–Tropsch (FT) synthesis for renewable jet fuel and diesel. Its modular plant design supports smaller-scale distributed production from sustainable feedstocks such as MSW, forestry residues, and biogenic gases.
- Fulcrum BioEnergy – Fulcrum BioEnergy converts municipal solid waste into liquid transportation fuels via gasification and FT synthesis. Its Sierra BioFuels Plant in Nevada is among the first commercial-scale waste-to-fuel facilities, targeting SAF and renewable diesel production for airline offtake partners.
- Renewable Energy Group (REG) – REG, now part of Chevron, is a leading producer of biodiesel and renewable diesel from waste fats, used cooking oil, and animal tallow. The company’s vertically integrated operations include feedstock collection, processing, and fuel distribution across North America.
- Chevron Corporation – Chevron is expanding its renewable fuels portfolio through major investments and acquisitions, including its purchase of REG. The company is developing SAF and renewable diesel projects while scaling co-processing capabilities at its refineries to reduce lifecycle carbon intensity.
- BP – BP invests in renewable fuels through partnerships and joint ventures in feedstock supply, biorefining, and SAF production. The company’s global strategy integrates biofuel operations with its low-carbon energy business, focusing on advanced ethanol and waste-to-fuel pathways.
- Shell plc – Shell is an active investor and offtaker in SAF through partnerships, offtake programs, and digital traceability platforms like Avelia. The company’s renewable fuels initiatives target large-scale deployment across aviation, shipping, and heavy transport sectors.
- TotalEnergies – TotalEnergies develops renewable diesel and SAF production facilities using waste and residue oils. The company’s biorefineries in France and the Netherlands are part of its transition strategy toward producing sustainable fuels that meet EU and global decarbonization targets.
- POET LLC – POET is the largest bioethanol producer in the world, converting agricultural feedstocks like corn into ethanol, biogas, and other renewable products. The company is investing in next-generation biofuel technologies and integrating carbon capture to support net-zero fuel production.
- Archer Daniels Midland (ADM) – ADM is a major global agribusiness supplying feedstocks such as soy oil, corn, and other biomaterials for renewable diesel and SAF. It partners with energy companies to scale biofuel production and has expanded into carbon capture and renewable hydrogen integration.
- Praj Industries – Praj Industries is an Indian technology licensor and engineering firm specializing in bioethanol, compressed biogas (CBG), and second-generation biofuel projects. The company supports global clients with turnkey biorefinery solutions focused on sustainability and waste valorization.
- KBR, Inc. – KBR provides engineering, procurement, and construction (EPC) services and licenses thermochemical and gas-to-liquids technologies used in SAF and renewable diesel projects. The company partners with major energy players to deploy scalable, low-emission biofuel plants worldwide.
- Ensyn Corporation – Ensyn develops fast pyrolysis technology that converts biomass into renewable biocrude oil, which can be upgraded into renewable diesel and SAF. Its biocrude products are used for heating and as feedstocks for refineries seeking to decarbonize fuel production.
- Enerkem Inc. – Enerkem converts non-recyclable municipal solid waste and biomass into syngas and renewable fuels via proprietary thermochemical processes. The company’s modular plants produce methanol, ethanol, and renewable hydrocarbons for the transport and chemical industries.
- Virent, Inc. – Virent uses catalytic conversion of plant-based sugars into drop-in bio-based fuels and aromatic chemicals. Its BioForming® process produces hydrocarbons that are chemically identical to petroleum-derived fuels, including SAF and renewable gasoline.
- Honeywell UOP – Honeywell UOP is a global licensor of hydrotreating and upgrading technologies for converting biocrudes, fats, and alcohols into SAF and renewable diesel. Its Ecofining™ and ethanol-to-jet processes are deployed across multiple commercial-scale renewable fuel plants globally.
Segments Covered
By Fuel Type
- Renewable Diesel / HVO
- Advanced Biodiesel
- Sustainable Aviation Fuel (SAF)
- Cellulosic Ethanol
- Biogas / Biomethane
- Fischer–Tropsch (FT) Diesel / Synthetic paraffinic kerosene
- Others (bio-naphtha, biomethanol)
By Feedstock
- Waste & Residues
- Lignocellulosic residues (wood chips, straw)
- Vegetable oils
- Algae
- Municipal Solid Waste (MSW) & black mass from batteries for specific thermochemical routes
- Dedicated energy crops (e.g., miscanthus) and others
By Technology / Conversion Pathway
- Hydrotreating / Hydroprocessing (HVO)
- Biochemical fermentation
- Thermochemical (gasification + Fischer–Tropsch)
- Pyrolysis + upgrading
- Anaerobic digestion / upgrading to biomethane
- Novel & hybrid routes
By End-Use / Application
- Road Transport
- Aviation (SAF)
- Marine
- Rail & Off-road (mining, agriculture)
- Gas grid / CNG
- Industrial heat & power
By Distribution / Supply Chain
- Direct supply to fuel blenders & refiners / integrated petrol companies
- Airport fuel supply & book-and-claim (for SAF)
- B2B offtake agreements
- Renewable fuel credits/compliance markets
By Region
- North America
- U.S.
- Canada
- Mexico
- Europe
- Germany
- UK
- France
- Italy
- Spain
- Asia Pacific
- China
- India
- Japan
- South Korea
- Latin America
- Brazil
- Argentina
- Middle East & Africa
- Saudi Arabia
- South Africa
A Seven-Phase Framework
Our methodology is designed to be universally applicable across commodity chemicals, specialty chemicals, petrochemicals, construction chemicals, coatings, electronic chemicals, industrial gases, agrochemicals, water treatment chemicals, and performance materials. Each phase builds upon the last, creating a layered validation structure that minimizes estimation error and maximizes analytical confidence.
The framework ensures comprehensive market coverage, robust cross-validation, and reliable long-term forecasting — producing market estimates that withstand scrutiny from investors, regulators, and corporate strategy teams.

Seven-Phase Framework — Analytical Effort Distribution
Relative analytical effort allocated across each phase of the Chemicals & Materials research framework

Phase 1 - Secondary Research: Establishing the Foundation
Secondary research collects and evaluates publicly available information from authoritative sources, establishing the foundational understanding of market structure, value chain dynamics, competitive landscape, and end-use demand patterns. Every source is evaluated for credibility, recency, geographic relevance, and methodological soundness before inclusion.
Industry Associations
Sources include ACC, CEFIC, ICCA, JCIA, CPCIF, and SOCMA providing production volumes, consumption trends, capacity developments, and sustainability initiatives.
Company Disclosures
Annual reports, investor presentations, earnings transcripts, and regulatory filings reveal product portfolios, manufacturing footprints, capacity expansions, and revenue segmentation.
Government Databases
National statistical offices, customs authorities, environmental agencies, and industrial production databases provide verified statistics on output, trade flows, and regulatory compliance.
Trade Databases
UN Comtrade, ITC, Eurostat, and national customs authorities enable assessment of global product movement, import dependency, and export competitiveness across regions.
Our Secondary Research Sources
- Ministry of Chemicals and Fertilizers
- European Chemicals Agency
- United States Department of Energy
- Ministry of Industry and Information Technology
- Ministry of Economy Trade and Industry
- Ministry of Trade Industry and Energy
- National Institute of Standards and Technology
- Council of Scientific and Industrial Research
- Fraunhofer Society
- National Institute for Materials Science
Phase 2 — Supply-Side Assessment: Mapping Production Capabilities
Production Capacity Analysis
All major manufacturers are assessed for existing installed capacity, planned additions, expansions, new plant announcements, and technology adoption — mapped at global, regional, and country levels.
Capacity Utilization Adjustment
Installed capacity is adjusted using utilization rates based on demand conditions, feedstock availability, plant operating rates, maintenance schedules, and regulatory restrictions.
Manufacturer Revenue Analysis
Product-specific revenues, segment-level performance, regional distribution, average selling prices, and margin trends are evaluated to establish market value estimates.
Supply-Side Assessment — Capacity vs. Effective Production by Region
Illustrative comparison of installed capacity vs. effective production volume (after utilization rate adjustment) across major regions

Phase 3 — Demand-Side Assessment: Quantifying Chemical Consumption
Demand-side analysis quantifies chemical consumption across industries, applications, and geographies — identifying where and how chemicals are consumed throughout the value chain with precision.
End-Use Industry Analysis
Chemical demand is evaluated across automotive, construction, packaging, electronics, agriculture, healthcare, consumer goods, industrial manufacturing, energy and utilities, and water treatment. Industry output, production trends, and consumption intensity are analyzed to determine demand patterns.
Consumption Modeling
Demand is estimated using measurable indicators: kilograms per vehicle, kilograms per square meter of construction, dosage per cubic meter of water treated, kilograms per hectare of agricultural land, and kilograms per ton of manufactured products. Consumption factors are validated through industry publications and primary interviews.
Application Analysis
The market is segmented by application area to understand product performance requirements, formulation trends, technology adoption, customer preferences, and regulatory requirements improving demand accuracy and segmentation granularity.
Demand-Side Assessment — End-Use Industry Demand Distribution
Illustrative distribution of chemical & materials demand across key end-use industries

Phase 4 - Trade Flow Analysis: Balancing Regional Supply and Demand
Trade flow analysis reconciles regional supply and demand estimates through import and export data, identifying net supply positions, regional dependencies, and market imbalances. It serves as an independent validation layer that tests the consistency of supply-side and demand-side estimates.
Import Analysis
Import data is evaluated to determine volumes, source countries, product dependency, regional supply gaps, and pricing trends — identifying markets that rely heavily on external supply and where domestic production is insufficient to meet demand.
Export Analysis
Export assessments reveal production surplus, export competitiveness, regional manufacturing strength, and global market participation. Export patterns also help validate domestic production estimates and identify net exporting regions.
Apparent Consumption Model
Regional consumption is assessed using the standard apparent consumption formula:
Results identify net importing regions, net exporting regions, regional deficits, and surpluses — serving as an independent validation of supply and demand estimates.
Trade Flow Analysis — Net Supply Position by Region
Illustrative apparent consumption vs. domestic production across major regions — positive gap indicates net import dependency

Phase 5 — Primary Research: The Critical Validation Layer
Primary research tests and refines findings from secondary research through direct engagement with industry participants across the supply chain, demand side, and expert community. It captures intelligence that no database or published report can provide — the real-world experience of manufacturers, buyers, and specialists operating in the market.

Supply-Side Interviews
Conversations with chemical manufacturers, raw material suppliers, contract manufacturers, technology providers, and plant operators cover production trends, capacity utilization, pricing developments, technology shifts, and competitive dynamics.

Demand-Side Interviews
Engagement with OEMs, industrial consumers, procurement managers, distributors, formulators, and end-use manufacturers focuses on consumption trends, purchasing behavior, product substitution, demand outlook, and emerging applications.

Industry Expert Consultations
Additional interviews with industry consultants, independent experts, regulatory specialists, technical professionals, and research institutions provide deeper market context and validate key analytical assumptions.
Focus Areas of Primary Research:
Market Size & Forecast Validation
Revenue estimates, volume consumption, growth rates, forecast assumptions, regional demand.Supply Chain & Value Chain Assessment
Raw material sourcing, supply chain challenges, distribution networks, procurement practices.Production & Capacity Analysis
Manufacturing capacity, utilization rates, expansion projects, plant investments.Pricing & Cost Structure Analysis
Product pricing trends, feedstock costs, energy costs, margin pressures, pricing outlook.Competitive Landscape Assessment
Volume and value estimates confirmed to be fully consistent with one another before publicationInterview Volume by Market Scope
| Study Scope | Number of Interviews |
|---|---|
| Niche Market | 20 – 30 |
| Mid-Sized Market | 30 – 50 |
| Global Market | 50 – 80 |
| Highly Fragmented Market | 80 – 120 |
Interview Details:
Category : Manufacturers, Suppliers, Distributors, End Users, Experts/Associations
Average Duration : 30–60 Minutes
Interview Mode : Video calls, telephonic interviews, expert consultations
Interview Format : Structured / Semi-Structured questionnaire
Focus Areas of Primary Research:
Market Size & Forecast Validation :
Revenue estimates, volume consumption, growth rates, forecast assumptions, regional demand.
Supply Chain & Value Chain Assessment :
Raw material sourcing, supply chain challenges, distribution networks, procurement practices.
Production & Capacity Analysis :
Manufacturing capacity, utilization rates, expansion projects, plant investments.
Pricing & Cost Structure Analysis :
Product pricing trends, feedstock costs, energy costs, margin pressures, pricing outlook.
Competitive Landscape Assessment :
Market share, competitor positioning, strategic initiatives, partnerships, acquisitions.
Primary Research — Stakeholder Coverage by Category
Distribution of interview respondents across stakeholder categories (% share from PPT data)

Primary Research — Respondent Designation Profile
Seniority breakdown of interview respondents (% share from PPT data)

Primary Research — Geographic Coverage of Interviews
Regional distribution of primary research engagement (% share from PPT data)

Phase 6 — Data Triangulation and Market Validation
No single methodology is relied upon in isolation. Multiple independent estimation approaches are combined and reconciled to ensure consistency, accuracy, and analytical defensibility. Any material deviations between approaches are investigated and adjusted through additional validation cycles.
The final market size is derived through weighted triangulation of all validated methodologies. Any material deviations between approaches are investigated and adjusted through additional validation cycles. The outcome represents the most realistic assessment of the market based on available evidence and expert confirmation ensuring that volume and value estimates are fully consistent with one another.
Triangulation Framework — Input Contribution Weight
Relative weight each sizing input contributes to the final reconciled market estimate

Phase 7 — Forecast Modeling: Projecting Future Market Evolution
Forecasting evaluates the future trajectory of the market using a combination of quantitative indicators and qualitative assessments across economic, industry, and regulatory dimensions. Rather than simple extrapolation, each driver is independently modeled and integrated into a composite forecast.
Macroeconomic Indicators
GDP growth, industrial production, manufacturing output, construction activity, consumer spending, and capital investment form the quantitative foundation of long-term demand projections. These are applied at country, regional, and global levels.
Industry Growth Drivers
Urbanization, infrastructure development, industrialization, technological innovation, sustainability initiatives, and evolving product performance requirements are assessed at regional and industry levels — capturing both structural and cyclical demand drivers.
Capacity Expansion Analysis
Announced plant expansions, new manufacturing facilities, technology upgrades, and strategic investments are evaluated to determine future supply-demand dynamics and potential market tightness or oversupply situations.
Regulatory & Sustainability
Environmental regulations, chemical safety standards, emission reduction targets, circular economy initiatives, and sustainability requirements are incorporated as they often influence product adoption rates and market growth trajectories.
Scenario Forecast Range — Indexed Market Growth (Year 1–10)
Illustrative indexed growth trajectories across Base, Optimistic, and Pessimistic scenarios over a 10-year forecast horizon

Forecast Drivers — Relative Impact Score by Category
Impact score (0–100) of each driver type on chemicals & materials market forecast




Comments
Share your thoughts, ask a question, or provide feedback about this report.