
Specialty Carbon Black Market Size Analysis Report 2035
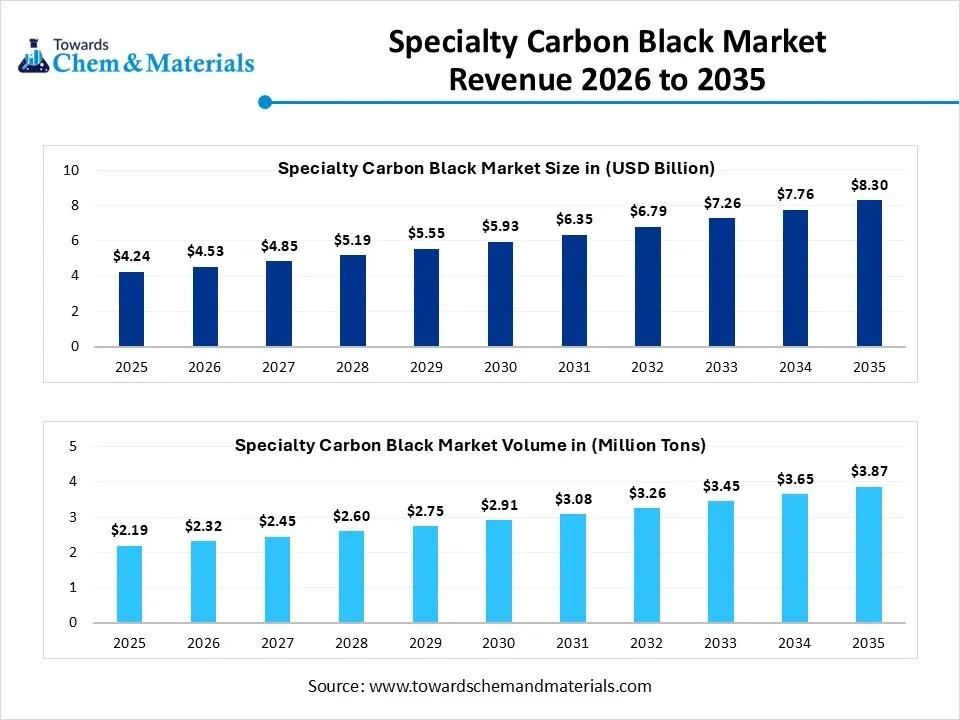
The global specialty carbon black market size was valued at USD 4.24 billion in 2025, is estimated to reach USD 4.53 billion in 2026, and is projected to reach USD 8.30 billion by 2035, exhibiting a compound annual growth rate (CAGR) of 6.95% over the forecast period from 2026 to 2035.Asia Pacific dominated the specialty carbon black market with the largest revenue share of 47%in 2025 and is expected to grow at the fastest CAGR of 7.07% during the forecast period. The growth of the market is driven by the electric vehicle (EV) boom, rising demand for high-performance plastics, and advancements in smart electronics. Specialty carbon black is a super-pure form of carbon used to make materials electrically conductive, protect plastics from the sun, and add deep color. The key collaborations between major giants, Birla Carbon and Mitsubishi Chemical Corporation, for better performance drive further growth.
Market Highlights
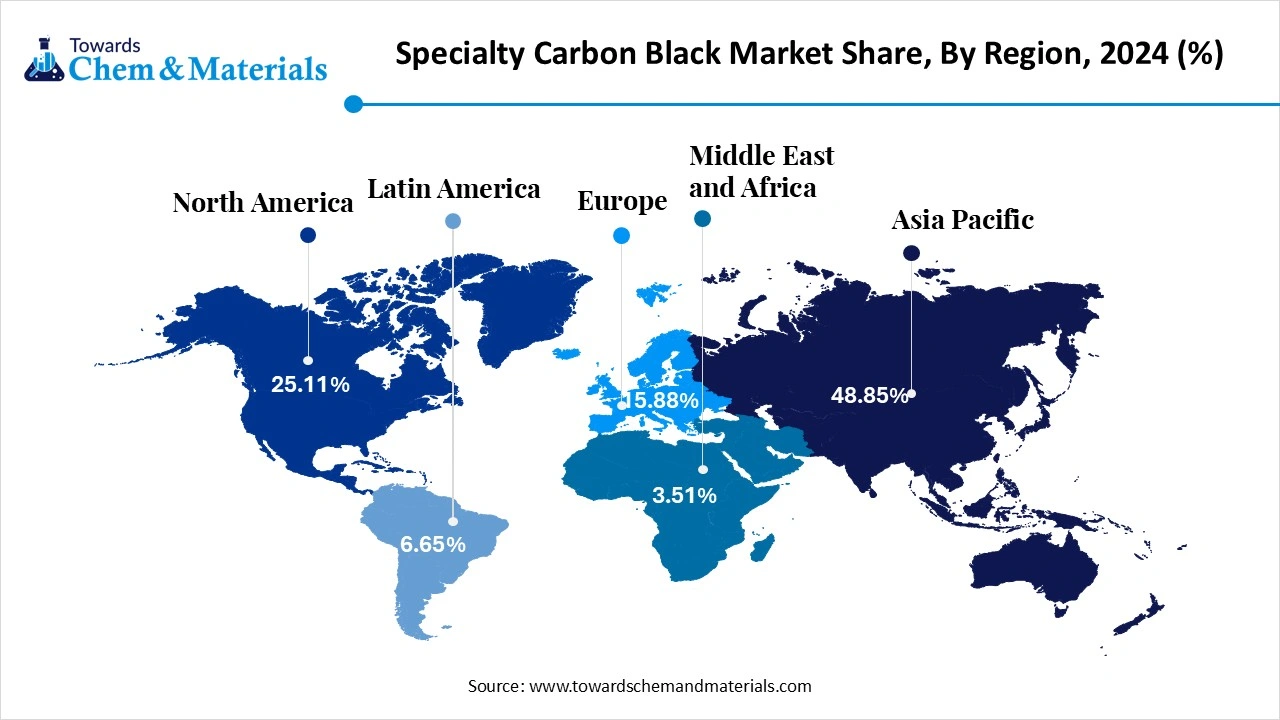
- By region, Asia Pacific dominated the market with a share of 47% in 2025. China, Japan, South Korea, and India lead battery and electronics manufacturing.
- By region, the Middle East and Africa held 5% market share in 2025 and are expected to experience the fastest growth with a CAGR of 8.10% in the forecast period. Petrochemical diversification encourages specialty material production.
- By grade, the conductive carbon black segment dominated the market with a 56% share in 2025. Strong EV battery demand drives consumption across lithium-ion cells.
- By grade, the food contact carbon black segment held 15% market share in 2025 and is expected to have the fastest growth with a CAGR of 8.30% in the forecast period. Food-safe plastics gain popularity in packaging applications.
According to Towards Chemicals and Materials Analytics and Consulting, the global specialty carbon black market volume was valued at 2.19 million tons in 2025 and is expected to surpass around 3.87 million tons by 2035, accelerating a compound annual growth rate (CAGR) of 5.85% over the forecast period from 2026 to 2035.
Market Overview
Why does Specialty Carbon Black matter?
The specialty carbon black market is significant because it provides critical, ultra-pure carbon materials that enable modern technology, electric mobility, and advanced manufacturing. Unlike standard carbon black (which is mostly used to make regular rubber tires black and strong), specialty grades are highly refined with very few impurities. They add specific functions to everyday and high-tech items.
It transforms basic hydrocarbons into high-performance additives that add color, electrical conductivity, and durability to everyday products. It serves as a vital conductive additive in lithium-ion batteries. It increases the batterys electrical efficiency, which directly improves the vehicles driving range and safety. It blocks sunlight and heat from breaking down outdoor plastics (like agricultural films or water pipes), making them last much longer. It is used in aerospace and automotive paints to provide a deep black color and protect surfaces from UV radiation and scratching.
It creates conductive plastics. These plastics prevent static electricity from damaging sensitive computer chips and electronic parts. Companies are moving away from traditional petroleum feedstocks. They are adopting sustainable alternatives, such as using bio-based materials and recycled carbon from old tires. Major industry leaders like Cabot Corporation and Birla Carbon dominate the space.
- For instance, Orion S.A., a global specialty chemicals company, announced that it is now producing circular carbon black at its ISCC PLUS-certified plant in Qingdao, China, located on the eastern coast. The plant produces three grades of ECORAX® Circular 200, 210, and 215 from tire pyrolysis oil. ECORAX® 200 is a hard black suitable for tire manufacturing, while the 210 and 215 grades are versatile for use in tires and mechanical rubber goods. (Source: www.businesswire.com)
The Power of Specialty Carbon Black in Modern Applications
Specialty carbon black is a premium grade of carbon black that consists of outstanding conductivity, UV resistance, tinting strength, and dispersibility. It is specifically designed for non-rubber applications and consists of properties like high purity, electrical conductivity, deep black color, and UV protection. It is suitable for various applications like automotive parts, pressure pipes, and plastic film. It is widely used in electrostatic discharge protection in lithium-ion batteries and the electronics industry due to its electrical conductivity.
It is widely used in various end-use applications, like inks, coatings, sealants, paints, rubber products, adhesives, plastics, and food-related applications. The growing demand for electric vehicle batteries increases the adoption of specialty carbon black. The growing demand from various industries like polymer, inks & toners, and paints & coatings helps in the market growth. The growing demand for tyres in the automotive industry is fueling the adoption of specialty carbon black. Factors like growing demand from key industries like packaging, automotive, plastics, & electronics, increasing demand for printing inks & coatings, and adoption of eco-friendly carbon black formulations contribute to the overall growth of the market.
- The United States exported 35,143 shipments of carbon black. (Source: volza.com)
- According to Japan Export data, from October 2023 to September 2024, Japan exported 4850 shipments of carbon black with a growth rate of 28% compared to the previous twelve months. (Source: volza.com)
- Imerys Graphite Carbon Belgium NV is the leading supplier of conductive carbon black in the world.(Source: volza.com)
The Growing Automotive Industry Propels the Growth of the Market
The growing automotive industry in various regions increases demand for specialty carbon black for various applications. The growing vehicle production increases demand for tires is fueling the adoption of specialty carbon black for improving abrasion resistance, strength, and durability. The rising demand for lithium-ion batteries in hybrid & electric vehicles leads to higher demand for specialty carbon black.
The growing demand for various automotive components like seals, exterior & interior parts, rubber, gaskets, and hoses increases the adoption of specialty carbon black. The growing demand for rubber-based components and tyres in the automotive industry is fueling demand for specialty carbon black. Specialty carbon black enhances overall performance, battery capacity, and rate capability of vehicles. The growing demand for interior components, bumpers, and dashboards in the automotive industry increases demand for specialty carbon black for providing conductivity to plastic and UV protection. The rise in electric vehicles leads to higher demand for specialty carbon black. The growing automotive industry is a key driver for the specialty carbon black market.
Market Trends
- The Growing Demand for Advanced Plastics & Coatings: The growing demand for high-performance plastics & coatings in various industries, especially the automotive industry, increases demand for specialty carbon black for enhancing durability, mechanical properties, and UV protection.
- Growing Demand from the Construction Industry: The growing construction activities in various regions increase demand for specialty carbon black for enhancing durability & performance of building materials. It acts as a pigment for coloring concrete and a reinforcing agent in concrete. Specialty carbon black extends lifespan and prevents degradation of construction components. The growing demand for aesthetic customization of buildings increases the demand for specialty carbon black.
- Increasing Focus on Conductive Carbon Black: The growing shift towards conductive carbon black, especially in electronic & electrical applications, for protection of electrostatic discharge and semi-conductive cables.
- Growing Adoption of Electric Vehicles: The growing demand for electric vehicles in various regions increases demand for specialty carbon black for the production of lithium-ion batteries. It enhances the durability and electrode conductivity of electric vehicles. The growing investment in electric vehicles increases the adoption of specialty carbon black.
Report Scope
| Report Attributes | Details |
| Market Size in 2026 | USD 4.53 Billion/ 2.32 Million Tons |
| Expected Size by 2035 | USD 8.30 Billion/ 3.87 Million Tons |
| Growth Rate from 2025 to 2035 | CAGR 6.95% |
| Base Year of Estimation | 2025 |
| Forecast Period | 2025 - 2035 |
| Dominant Region | Asia Pacific |
| Segment Covered | By Grade, By Region |
| Key Companies Profiled | Tokai Carbon Co., Ltd. Continental Carbon Company, Cabot Corporation, Omsk Carbon Group, Atlas Organics Private Limited, Birla Carbon, Oak Investments Partners, Philips Carbon Black Limited, Ralson Carbon Black Limited, Himadri Specialty Chemical Ltd, Orion S.A. |
Supply Chain Analysis of Specialty Carbon Black Market:
Specialty Carbon Black Production & Processing
- Specialty carbon black is produced through controlled partial combustion or thermal decomposition of hydrocarbon feedstocks to obtain high-purity carbon particles with specific particle size, structure, and surface area for plastics, coatings, inks, batteries, and rubber applications.
- Cabot Corporation manufactures specialty carbon black grades for plastics, coatings, inks, batteries, and conductive applications. Its products improve UV protection, electrical conductivity, color performance, and durability in high-performance materials.
- Key Players: Orion Engineered Carbons, Cabot Corporation, Birla Carbon, Tokai Carbon.
Quality Testing & Certification
- Specialty carbon black must comply with standards for particle size distribution, surface area, purity, conductivity, dispersion performance, and chemical safety before commercial use.
- Orion Engineered Carbons develops specialty carbon black products that meet stringent quality and regulatory standards for automotive, industrial, electronics, and polymer applications, ensuring consistent performance and product reliability.
- Key Authorities & Standards: International Organization for Standardization, ASTM International, European Chemicals Agency, REACH.
Distribution to End-Use Industries
- Specialty carbon black is supplied to plastics manufacturers, coatings and printing ink producers, battery manufacturers, rubber processors, electronics companies, and automotive component manufacturers.
- Birla Carbon supplies specialty carbon black solutions for polymers, inks, coatings, fibers, and battery materials, helping manufacturers enhance product performance, conductivity, UV resistance, and aesthetic properties across diverse industrial applications.
- Key Suppliers: Cabot Corporation, Birla Carbon, Tokai Carbon
Market Opportunity
Growing Expansion of the Electronic Industry
The growing expansion of the electronics industry increases demand for specialty carbon black. The increasing adoption of various electronic devices, like wearable devices, smartphones, computers, and laptops, increases the adoption of specialty carbon black. The growing demand for semiconductors, cables, and connectors in electronic devices increases demand for specialty carbon black to create conductive pathways. The growing focus on the development of 5G infrastructure is fueling demand for specialty carbon black. The increasing demand for heat management in high-performance electronics is fueling the adoption of specialty carbon black for longevity and optimal functioning. The growing trend of miniaturization of electronic devices increases the adoption of specialty carbon black. The growing advancements in the electronics industry lead to a higher demand for specialty carbon black. The growing expansion of the electronics industry creates an opportunity for the growth of the specialty carbon black market.
Market Challenge
High Production Cost Limits the Adoption of Specialty Carbon Black
Despite several advantages of specialty carbon black in various sectors, the high production cost restricts the growth of the market. Factors like stringent quality standards, complex manufacturing processes, higher raw material costs, and specialized applications are responsible for the higher cost.
A complex manufacturing process, like thermal decomposition, complex particulate structure, and partial combustion of hydrocarbons, increases the overall cost. The requirement of standard quality control measures throughout the manufacturing process increases the cost. The high cost of raw materials derived from natural gas and crude oil affects the market growth. The growing demand from various applications with enhanced quality, like specific particle size and higher purity, increases the production cost. The high production cost hampers the growth of the specialty carbon market.
Segmental Insights
Grade Insights
Why did the Food Contact Segment Dominate the Specialty Carbon Black Market?
The food contact segment led the specialty carbon black market in 2025. The growing demand for packaging in the food industry increases the demand for specialty carbon black. The regulatory bodies, like the European Plastic Regulation and the FDA, ensure the safety & quality of food-grade specialty carbon black. The growing consumption of packaged food & beverages helps in the market growth. The increasing demand for molded plastics, films, and sheets for food packaging is fueling the adoption of specialty carbon black. The changing lifestyle and growing consumption of convenience foods drive the overall growth of the market.
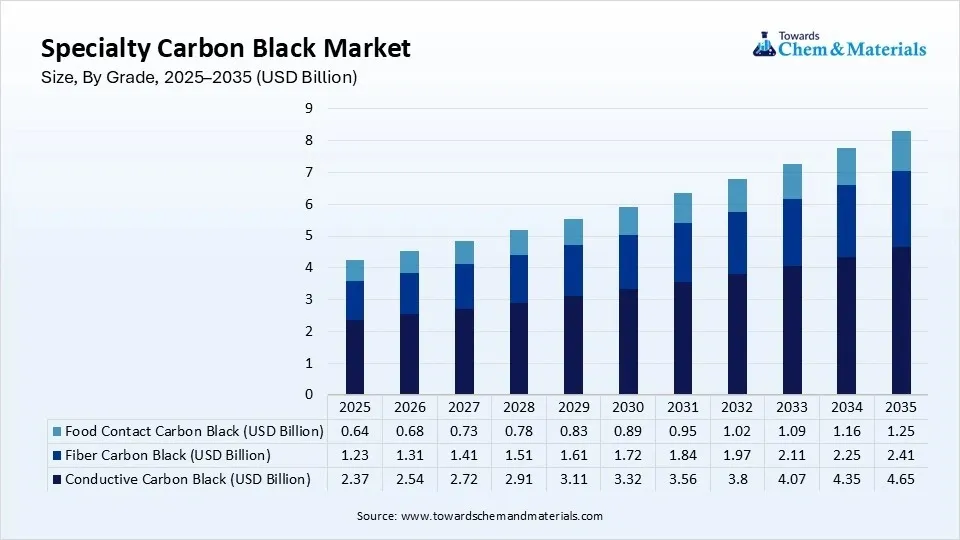
The conductive segment is the fastest growing in the market during the forecast period. The booming electronic sector increases the production of electronic components, batteries, and capacitors, fueling demand for conductive specialty carbon black. The growing development of advanced automotive components and the increasing adoption of electric vehicles help in the market growth. The growing demand for energy storage systems, including lithium-ion batteries, increases demand for conductive carbon. The rising demand for various plastic products like industrial bags, films, and pipes leads to higher demand for conductive carbon black. The increasing expansion of conductive polymers in wearable technology, sensors, and touchscreens supports the overall growth of the market.
Specialty Carbon Black Market Share, By Grade, 2025(%)
| By Grade | Market Share (%) |
| Conductive Carbon Black | 56% |
| Fiber Carbon Black | 29% |
| Food Contact Carbon Black | 15% |
Regional Insights
How did Asia Pacific Dominate the Specialty Carbon Black Market in 2025?
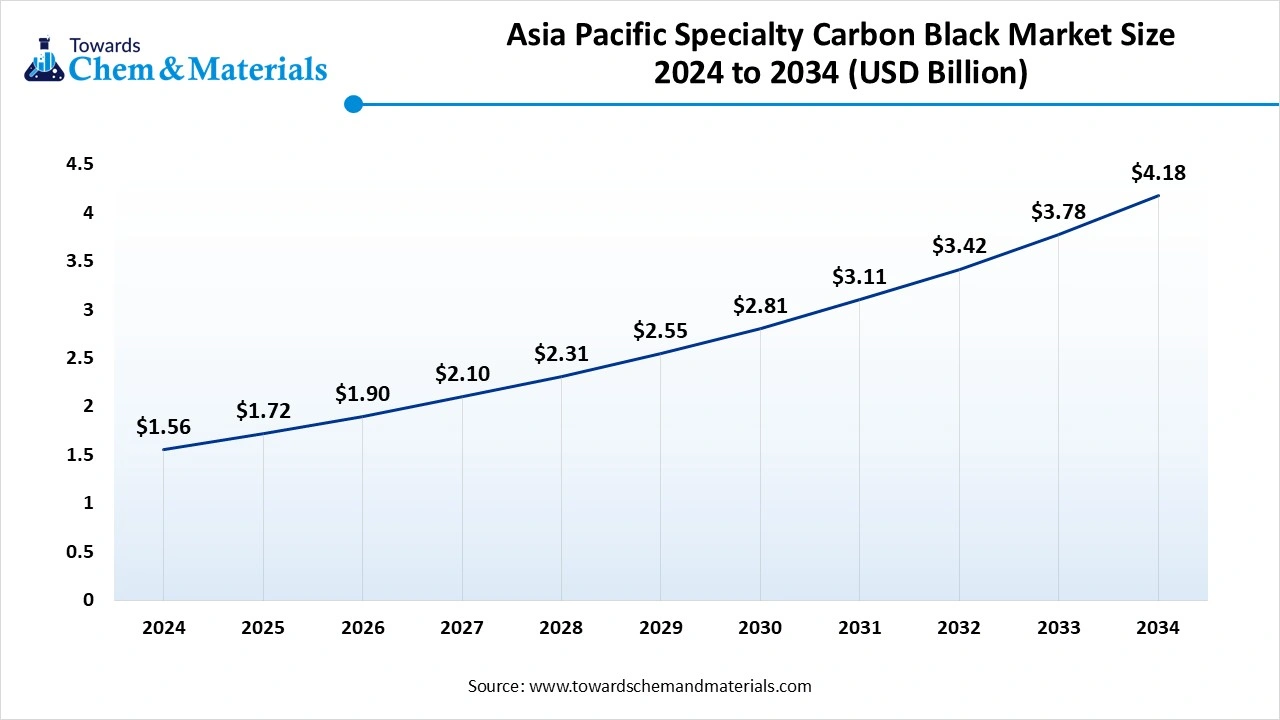
The Asia Pacific specialty carbon black market size was estimated at USD 1.99 billion in 2025 and is projected to reach USD 3.94 billion by 2035, growing at a CAGR of 7.07% from 2026 to 2035.Asia Pacific dominated the market with the largest share of 47% in 2025. This massive success was primarily driven by its explosive manufacturing output, rapid industrialization, and the integration of specialty carbon grades into electric vehicles and advanced electronics across China, India, and South Korea. Specialty Carbon Black is a highly pure, fine-powdered form of carbon that gives deep color, electrical conductivity, and UV protection to products like plastics, paints, and batteries.
China
- Chinas specialty carbon black market is growing rapidly due to rising demand for electric vehicles, expanding consumer electronics, and increased use in advanced plastics and coatings.
- China led regional and global consumption by supplying enormous amounts of electronics, automotive components, and consumer goods.
- China remains the worlds largest producer and consumer of carbon black. Massive local manufacturing infrastructure keeps production costs down and ensures a steady supply for downstream industries.
India
- Indias growing vehicle and EV manufacturing sectors drive demand for high-performance plastics and lightweight components, where specialty carbon black serves as a vital conductive and reinforcing agent.
- Favorable Indian policies for industrial manufacturing attract private investments and boost production capacity.
- Manufacturers are investing in sustainable production by using bio-based materials and recycled carbon black to meet environmental targets.
North America Specialty Carbon Black Market Growth Factor
North America held a market share of 20% in 2025. primarily driven by the expanding electric vehicle (EV) sector, hyperscale data center construction, and advanced packaging. These industries require specialty carbon black for battery electrodes, high-performance plastics, and conductive coatings. Government initiatives, such as the U.S. BioPreferred Program, encourage investment in bio-based, renewable specialty carbon blacks to reduce the environmental footprint. The rapid expansion of artificial intelligence (AI) and cloud computing requires massive data centers. SCB is used to create conductive plastics and liners that protect sensitive servers from power surges and static.
United States
Specialty carbon black provides the conductivity needed for the electrodes in lithium-ion batteries. A push to boost domestic U.S. battery capacity fuels this.
The U.S. Environmental Protection Agency (EPA) drives research into recovered and circular carbon black. Manufacturers aim to reduce environmental impacts and emissions.
Canada
- Canada has a strong automotive aftermarket. Specialty grades are widely used in paints, coatings, and specialized rubber to improve durability and UV resistance.
- Federal funding allocated to industrial emissions reduction helps manufacturers in Canada adopt sustainable carbon black production methods.
Europe Specialty Carbon Black Market Growth Factor
Europe held a market share of 22% in 2025, due to rising demand for high-performance materials in electric vehicles, advanced electronics, and sustainable manufacturing. This growth is heavily shaped by strict European Union (EU) environmental rules that encourage the use of recycled and recovered materials. European automotive manufacturing hubs, with Germany leading the way, demand premium paints and mechanical rubber goods. Specialty carbon black is used to create deep black, highly durable finishes.
Germany
- Germanys specialty carbon black market is primarily driven by its booming automotive industry, the transition to electric vehicles (EVs), and stringent sustainability regulations.
- Specialty carbon black provides the necessary electrical conductivity in lithium-ion battery electrodes. Germany’s robust EV manufacturing base accelerates this demand.
- Strict European environmental laws push local producers, such as Orion Engineered Carbons, to adopt bio-based materials and recovered carbon black (rCB).
France
- Specialty carbon black acts as a crucial conductive additive in lithium-ion batteries. It forms a network that allows electricity to flow smoothly. France is boosting its domestic EV and battery manufacturing, which directly spikes the demand for these specialty additives.
- France and the European Union have strict environmental laws. To meet these, the market is shifting toward Recovered Carbon Black (rCB). This green method uses old tires and waste, turning them into reusable carbon black. It helps brands reduce their carbon footprint while maintaining high product quality.
Latin America Specialty Carbon Black Market Growth Factor
- Latin America held a market share of 6% in 2025, driven by the expanding automotive sector, growing demand for durable plastics, and rising consumer disposable income. Brazil serves as the regions largest consumption center, utilizing the material for specialized paints, inks, and packaging. Rising living standards in Latin America.
- Countries like Brazil see strong demand for electronics, construction materials, and household goods. The regions growing automotive manufacturing sector boosts demand for specialty carbon black. It is used to create non-rubber parts like bumpers and interior trims.
Brazil
- Brazils growing vehicle production requires high-quality tires, rubber components (hoses, belts), and performance coatings. Specialty grades provide durability and aesthetic finishes for these applications.
- Urbanization and changing consumer lifestyles increase the demand for convenient, packaged goods. Specialty carbon black is a core additive for UV protection and pigmentation in plastic containers.
Argentina
- Argentinas specialty carbon black market is primarily driven by the expanding domestic automotive and plastics industries, along with a rising regional demand for advanced coatings and printing inks.
- Strict environmental rules force suppliers to shift from traditional petroleum methods to sustainable alternatives, like recycled carbon black.
Middle East & Africa Specialty Carbon Black Market Growth Factor
The Middle East & Africa held a market share of 5% in 2025 and is expected to grow at the fastest CAGR of 8.10% over the forecast period, primarily driven by industrial diversification, automotive sector expansion, and construction spending. Gulf Cooperation Council (GCC) nations like Saudi Arabia and the UAE are aggressively moving away from simple oil reliance. This boosts investments in manufacturing and high-performance materials. Local governments (like the UAE) enforce strict emissions regulations. This forces industries to use eco-friendly additives and modern manufacturing techniques. Local players such as SABIC are actively innovating to provide domestic market alternatives for the construction and building sectors.
Saudi Arabia
- Saudi Arabia has huge petroleum reserves. These reserves guarantee a steady supply of affordable, high-quality raw materials (called feedstocks) used to make carbon black.
- Saudi Arabias highly established petrochemical industry ensures an uninterrupted supply of petroleum byproducts needed to make carbon black.
UAE
- Major projects in Dubai and Abu Dhabi require high-performance paints, coatings, and inks. Specialty carbon black provides UV resistance and durability to plastic pipes and cables used in construction.
- UAE government mandates aim to reduce industrial emissions, pushing manufacturers toward low-carbon specialty grades. Recovered carbon black is heavily adopted to achieve cost savings and meet green building standards.
Recent Developments
- In June 2026, Orion S.A. launched a large-scale circular carbon black production in China, utilizing tire pyrolysis oil (TPO) to create sustainable grades with ISCC PLUS certification. The facility is making three grades of ECORAX® Circular 200, 210, and 215 from tire pyrolysis oil (TPO). (Source: www.businesswire.com)
- In September 2025, Birla Carbon Unveiled the Raven 401P carbon black, a breakthrough tinting solution designed to raise tonal performance and formulation flexibility in the coatings segment at the Asia Pacific Coatings Show 2025.(Source: www.birlacarbon.com)
- In July 2025, Cabot Corporation launched MAJESTIC 710 specialty carbon black, a highly dispersible carbon black (HDCB) pigment tailored specifically for waterborne formulations, which is suitable for use in water-based systems and helps improve color performance with low formulation complexity.(Source: www.coatingsworld.com)
- In July 2025, Epsilon Carbon Pvt. Ltd., a carbon black manufacturer, launched an initial fleet of six Liquefied Natural Gas (LNG)-powered container trucks dedicated to transporting carbon black to its tyre industry clients. This strategic initiative aims to decarbonize the companys downstream freight network and help automotive partners lower their environmental footprints.(Source: www.autocarpro.in)
- In February 2026, Himadri Speciality Chemical Ltd (HSCL) commenced commercial operations of its newly expanded 70,000 MTPA Speciality Carbon Black line at its manufacturing facility in Mahistikry, Hooghly, West Bengal. This brownfield expansion project serves as a major milestone in Himadris transition into advanced carbon materials.(Source: bioenergytimes.com)
Top Companies List
- Tokai Carbon Co., Ltd.
- Continental Carbon Company
- Cabot Corporation
- Omsk Carbon Group
- Atlas Organics Private Limited
- Birla Carbon
- Oak Investments Partners
- Philips Carbon Black Limited
- Ralson Carbon Black Limited
- Himadri Specialty Chemical Ltd
- Orion S.A.
Segments Covered
By Grade
- Conductive Carbon Black
- Highly Structured Conductive
- Ultra Conductive
- Battery Grade
- Fiber Carbon Black
- Polyester Fiber Grade
- Nylon Fiber Grade
- Polypropylene Fiber Grade
- Food Contact Carbon Black
- Packaging Grade
- Food Processing Equipment Grade
- Food Contact Polymer Grade
By Region
- North America
- U.S.
- Canada
- Europe
- Germany
- UK
- France
- Italy
- Spain
- Sweden
- Denmark
- Norway
- Asia Pacific
- China
- Japan
- India
- South Korea
- Thailand
- Latin America
- Brazil
- Mexico
- Argentina
- Middle East & Africa
- South Africa
- UAE
- Saudi Arabia
- Kuwait
A Seven-Phase Framework
Our methodology is designed to be universally applicable across commodity chemicals, specialty chemicals, petrochemicals, construction chemicals, coatings, electronic chemicals, industrial gases, agrochemicals, water treatment chemicals, and performance materials. Each phase builds upon the last, creating a layered validation structure that minimizes estimation error and maximizes analytical confidence.
The framework ensures comprehensive market coverage, robust cross-validation, and reliable long-term forecasting — producing market estimates that withstand scrutiny from investors, regulators, and corporate strategy teams.

Seven-Phase Framework — Analytical Effort Distribution
Relative analytical effort allocated across each phase of the Chemicals & Materials research framework

Phase 1 - Secondary Research: Establishing the Foundation
Secondary research collects and evaluates publicly available information from authoritative sources, establishing the foundational understanding of market structure, value chain dynamics, competitive landscape, and end-use demand patterns. Every source is evaluated for credibility, recency, geographic relevance, and methodological soundness before inclusion.
Industry Associations
Sources include ACC, CEFIC, ICCA, JCIA, CPCIF, and SOCMA providing production volumes, consumption trends, capacity developments, and sustainability initiatives.
Company Disclosures
Annual reports, investor presentations, earnings transcripts, and regulatory filings reveal product portfolios, manufacturing footprints, capacity expansions, and revenue segmentation.
Government Databases
National statistical offices, customs authorities, environmental agencies, and industrial production databases provide verified statistics on output, trade flows, and regulatory compliance.
Trade Databases
UN Comtrade, ITC, Eurostat, and national customs authorities enable assessment of global product movement, import dependency, and export competitiveness across regions.
Our Secondary Research Sources
- Ministry of Chemicals and Fertilizers
- European Chemicals Agency
- United States Department of Energy
- Ministry of Industry and Information Technology
- Ministry of Economy Trade and Industry
- Ministry of Trade Industry and Energy
- National Institute of Standards and Technology
- Council of Scientific and Industrial Research
- Fraunhofer Society
- National Institute for Materials Science
Phase 2 — Supply-Side Assessment: Mapping Production Capabilities
Production Capacity Analysis
All major manufacturers are assessed for existing installed capacity, planned additions, expansions, new plant announcements, and technology adoption — mapped at global, regional, and country levels.
Capacity Utilization Adjustment
Installed capacity is adjusted using utilization rates based on demand conditions, feedstock availability, plant operating rates, maintenance schedules, and regulatory restrictions.
Manufacturer Revenue Analysis
Product-specific revenues, segment-level performance, regional distribution, average selling prices, and margin trends are evaluated to establish market value estimates.
Supply-Side Assessment — Capacity vs. Effective Production by Region
Illustrative comparison of installed capacity vs. effective production volume (after utilization rate adjustment) across major regions

Phase 3 — Demand-Side Assessment: Quantifying Chemical Consumption
Demand-side analysis quantifies chemical consumption across industries, applications, and geographies — identifying where and how chemicals are consumed throughout the value chain with precision.
End-Use Industry Analysis
Chemical demand is evaluated across automotive, construction, packaging, electronics, agriculture, healthcare, consumer goods, industrial manufacturing, energy and utilities, and water treatment. Industry output, production trends, and consumption intensity are analyzed to determine demand patterns.
Consumption Modeling
Demand is estimated using measurable indicators: kilograms per vehicle, kilograms per square meter of construction, dosage per cubic meter of water treated, kilograms per hectare of agricultural land, and kilograms per ton of manufactured products. Consumption factors are validated through industry publications and primary interviews.
Application Analysis
The market is segmented by application area to understand product performance requirements, formulation trends, technology adoption, customer preferences, and regulatory requirements improving demand accuracy and segmentation granularity.
Demand-Side Assessment — End-Use Industry Demand Distribution
Illustrative distribution of chemical & materials demand across key end-use industries

Phase 4 - Trade Flow Analysis: Balancing Regional Supply and Demand
Trade flow analysis reconciles regional supply and demand estimates through import and export data, identifying net supply positions, regional dependencies, and market imbalances. It serves as an independent validation layer that tests the consistency of supply-side and demand-side estimates.
Import Analysis
Import data is evaluated to determine volumes, source countries, product dependency, regional supply gaps, and pricing trends — identifying markets that rely heavily on external supply and where domestic production is insufficient to meet demand.
Export Analysis
Export assessments reveal production surplus, export competitiveness, regional manufacturing strength, and global market participation. Export patterns also help validate domestic production estimates and identify net exporting regions.
Apparent Consumption Model
Regional consumption is assessed using the standard apparent consumption formula:
Results identify net importing regions, net exporting regions, regional deficits, and surpluses — serving as an independent validation of supply and demand estimates.
Trade Flow Analysis — Net Supply Position by Region
Illustrative apparent consumption vs. domestic production across major regions — positive gap indicates net import dependency

Phase 5 — Primary Research: The Critical Validation Layer
Primary research tests and refines findings from secondary research through direct engagement with industry participants across the supply chain, demand side, and expert community. It captures intelligence that no database or published report can provide — the real-world experience of manufacturers, buyers, and specialists operating in the market.

Supply-Side Interviews
Conversations with chemical manufacturers, raw material suppliers, contract manufacturers, technology providers, and plant operators cover production trends, capacity utilization, pricing developments, technology shifts, and competitive dynamics.

Demand-Side Interviews
Engagement with OEMs, industrial consumers, procurement managers, distributors, formulators, and end-use manufacturers focuses on consumption trends, purchasing behavior, product substitution, demand outlook, and emerging applications.

Industry Expert Consultations
Additional interviews with industry consultants, independent experts, regulatory specialists, technical professionals, and research institutions provide deeper market context and validate key analytical assumptions.
Focus Areas of Primary Research:
Market Size & Forecast Validation
Revenue estimates, volume consumption, growth rates, forecast assumptions, regional demand.Supply Chain & Value Chain Assessment
Raw material sourcing, supply chain challenges, distribution networks, procurement practices.Production & Capacity Analysis
Manufacturing capacity, utilization rates, expansion projects, plant investments.Pricing & Cost Structure Analysis
Product pricing trends, feedstock costs, energy costs, margin pressures, pricing outlook.Competitive Landscape Assessment
Volume and value estimates confirmed to be fully consistent with one another before publicationInterview Volume by Market Scope
| Study Scope | Number of Interviews |
|---|---|
| Niche Market | 20 – 30 |
| Mid-Sized Market | 30 – 50 |
| Global Market | 50 – 80 |
| Highly Fragmented Market | 80 – 120 |
Interview Details:
Category : Manufacturers, Suppliers, Distributors, End Users, Experts/Associations
Average Duration : 30–60 Minutes
Interview Mode : Video calls, telephonic interviews, expert consultations
Interview Format : Structured / Semi-Structured questionnaire
Focus Areas of Primary Research:
Market Size & Forecast Validation :
Revenue estimates, volume consumption, growth rates, forecast assumptions, regional demand.
Supply Chain & Value Chain Assessment :
Raw material sourcing, supply chain challenges, distribution networks, procurement practices.
Production & Capacity Analysis :
Manufacturing capacity, utilization rates, expansion projects, plant investments.
Pricing & Cost Structure Analysis :
Product pricing trends, feedstock costs, energy costs, margin pressures, pricing outlook.
Competitive Landscape Assessment :
Market share, competitor positioning, strategic initiatives, partnerships, acquisitions.
Primary Research — Stakeholder Coverage by Category
Distribution of interview respondents across stakeholder categories (% share from PPT data)

Primary Research — Respondent Designation Profile
Seniority breakdown of interview respondents (% share from PPT data)

Primary Research — Geographic Coverage of Interviews
Regional distribution of primary research engagement (% share from PPT data)

Phase 6 — Data Triangulation and Market Validation
No single methodology is relied upon in isolation. Multiple independent estimation approaches are combined and reconciled to ensure consistency, accuracy, and analytical defensibility. Any material deviations between approaches are investigated and adjusted through additional validation cycles.
The final market size is derived through weighted triangulation of all validated methodologies. Any material deviations between approaches are investigated and adjusted through additional validation cycles. The outcome represents the most realistic assessment of the market based on available evidence and expert confirmation ensuring that volume and value estimates are fully consistent with one another.
Triangulation Framework — Input Contribution Weight
Relative weight each sizing input contributes to the final reconciled market estimate

Phase 7 — Forecast Modeling: Projecting Future Market Evolution
Forecasting evaluates the future trajectory of the market using a combination of quantitative indicators and qualitative assessments across economic, industry, and regulatory dimensions. Rather than simple extrapolation, each driver is independently modeled and integrated into a composite forecast.
Macroeconomic Indicators
GDP growth, industrial production, manufacturing output, construction activity, consumer spending, and capital investment form the quantitative foundation of long-term demand projections. These are applied at country, regional, and global levels.
Industry Growth Drivers
Urbanization, infrastructure development, industrialization, technological innovation, sustainability initiatives, and evolving product performance requirements are assessed at regional and industry levels — capturing both structural and cyclical demand drivers.
Capacity Expansion Analysis
Announced plant expansions, new manufacturing facilities, technology upgrades, and strategic investments are evaluated to determine future supply-demand dynamics and potential market tightness or oversupply situations.
Regulatory & Sustainability
Environmental regulations, chemical safety standards, emission reduction targets, circular economy initiatives, and sustainability requirements are incorporated as they often influence product adoption rates and market growth trajectories.
Scenario Forecast Range — Indexed Market Growth (Year 1–10)
Illustrative indexed growth trajectories across Base, Optimistic, and Pessimistic scenarios over a 10-year forecast horizon

Forecast Drivers — Relative Impact Score by Category
Impact score (0–100) of each driver type on chemicals & materials market forecast




Comments
Share your thoughts, ask a question, or provide feedback about this report.