
Methanol Market Size, Share, Trends, Production and Forecast 2026 to 2035
For this report, the Methanol Market represents the global revenue value associated with methanol across the defined feedstock, derivative, application, and geographic segments; downstream derivative revenue is excluded unless explicitly attributed to methanol sales.
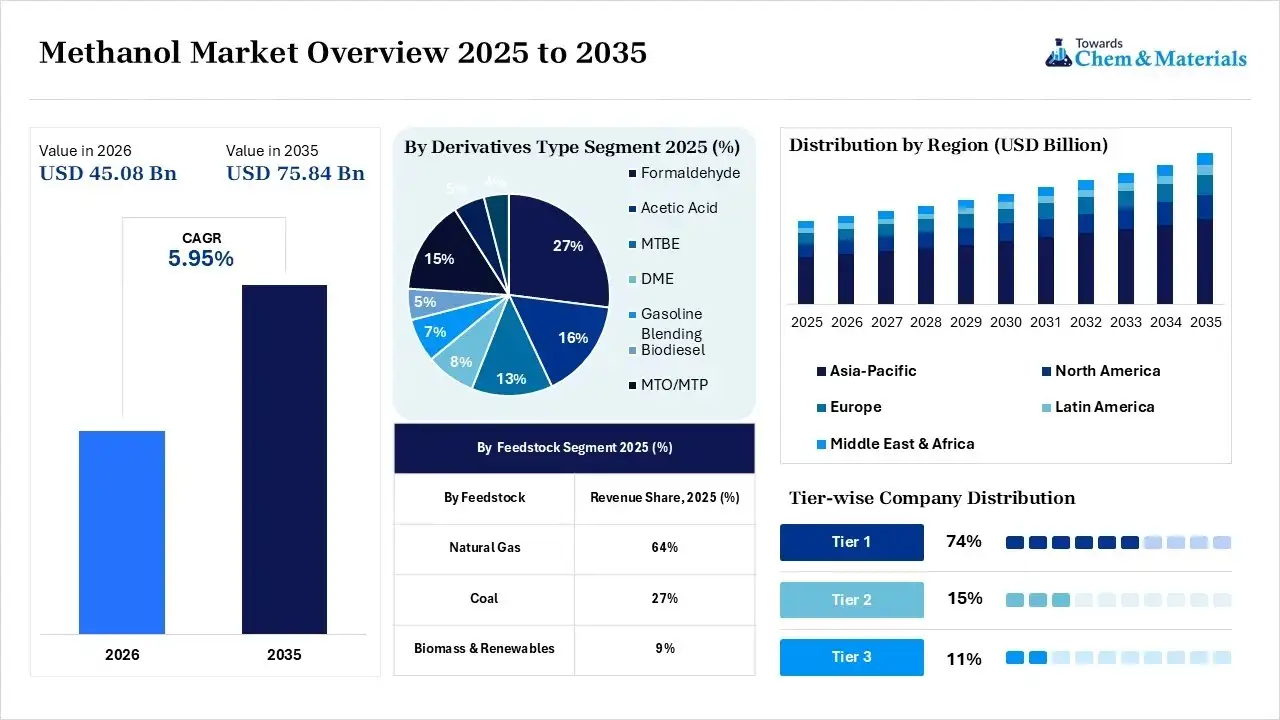
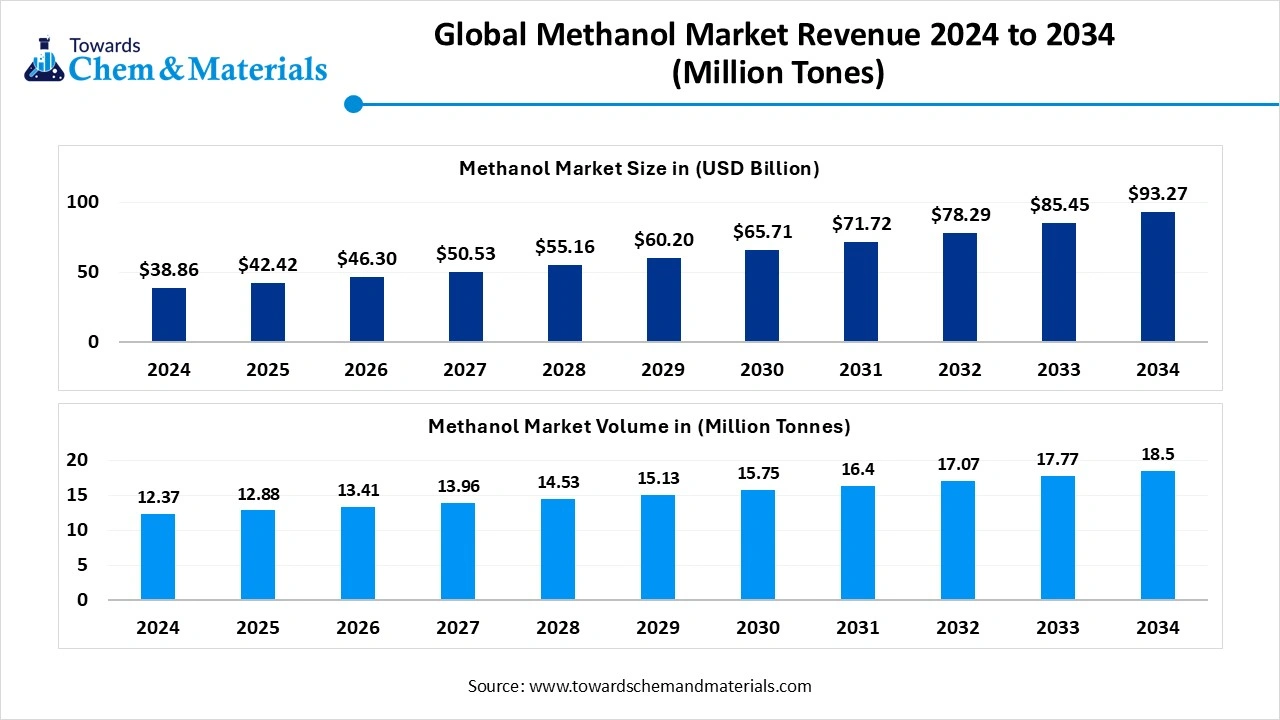
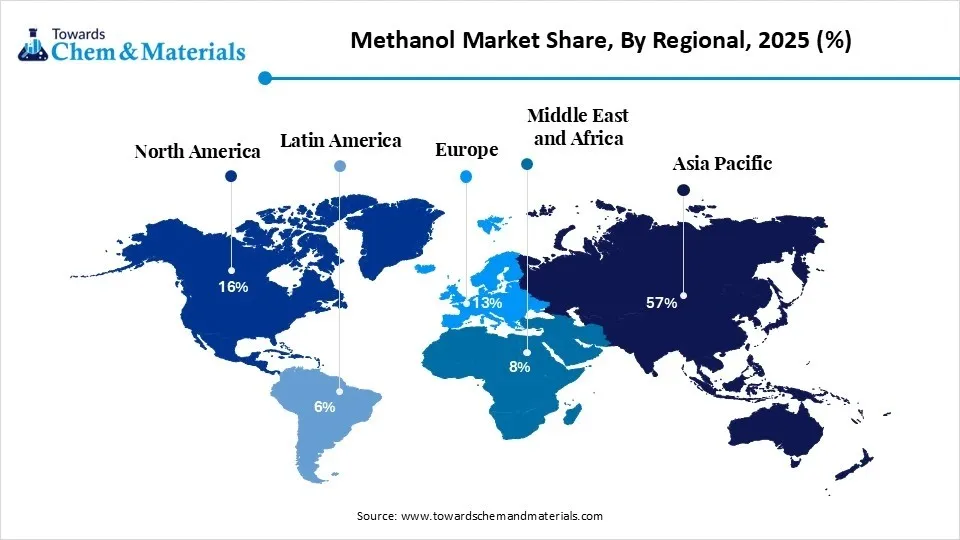
The methanol market size was valued at USD 42.55 billion in 2025, is estimated to reach USD 45.08 billion in 2026, and is projected to reach USD 75.84 billion by 2035, exhibiting a compound annual growth rate (CAGR) of 5.95% over the forecast period from 2026 to 2035.Asia Pacific dominated the methanol market with the largest revenue share of 57% in 2025 and is expected to grow at the fastest CAGR of 6.04% during the forecast period.
In terms of volume, the methanol market is projected to grow from 120.45 million metric tons in 2025 to 195.27 million metric tons by 2035. growing at a CAGR of 5.95% from 2026 to 2035.Methanol becomes the center element of modern industrialization while manufacturers are actively looking for better supply chain statistics. Also, with the push for eco-friendly materials, the methanol industry is likely to create brighter industry capabilities during the forecast period.
Source: Towards Chemical & Materials Analytics and Consulting; market estimates based on the methodology described below and validated against company, trade, industry and primary-research data
Market Highlights
- By region, Asia Pacific dominated the market with a share of 57% in 2025, due to the it is home to some of the world's largest chemical manufacturing industries.
- By region, Europe held 13% market share in 2025 and is expected to be the fastest-growing region in the market, with a CAGR of 7.2% in the forecast period, owing to many countries investing in renewable and low-carbon methanol production.
- By feedstock, the natural gas segment dominated the market with 64% share in 2025, as the increasing development of green and renewable methanol.
- By feedstock, the biomass & renewables segment held the 9% market share in 2025 and is expected to be the fastest-growing in the market, with a CAGR of 12.80% in the forecast period, owing to the increasing development of green and renewable methanol.
- By derivatives, the formaldehyde segment dominated the market with 27% share in 2025, owing to it being one of the most widely used products made from methanol.
- By derivatives, the MTO/MTP segment held a 15% market share in 2025 and is expected to be the fastest-growing in the market, with a CAGR of 8.90% in the forecast period, owing to they allow manufacturers to convert methanol into valuable petrochemical products.
- By application, the construction segment dominated the market with a 39% share in 2025, owing to many construction materials depending on methanol-based chemicals during manufacturing.
- By application, the electronics segment held the 18% market share in 2025 and is expected to be the fastest-growing in the market, with a CAGR of 7.10% in the forecast period, owing to demand for electronic devices across the world.
The greater involvement of methanol in major industrial sectors such as plastics, paints, adhesives, and several other chemical products has already provided huge attention to the industry in recent years. As manufacturers are actively thinking beyond hazardous chemicals usage, trying to switch cleaner fuel alternatives and energy solutions, methanol is expected to create its own presence in the upcoming period as standard research analysis. Also, the quick investments in technology innovations, international trades, and production capacity expansions have supported supply reliability.
- For instance, in June 2026, Evonik established methanol pipelines in collaboration with regional partners while sharing infrastructure information. According to the company, the main motive of this establishment is to secure long-term raw material supply in Europe, as per the published report.
(Source: www.evonik.com)
The industry is now benefiting from continuous investment in production capacity, international trade, and technological innovation. Also, several companies are expanding manufacturing facilities to meet rising global demand while strengthening supply reliability. Research activities are supporting the development of renewable and low-carbon methanol using sustainable feedstocks and carbon capture technologies.
Global Investment Flow for the Methanol Market 2026
Recent project activity includes new conventional and lower-carbon methanol facilities, with investment decisions influenced by feedstock availability, downstream demand, marine-fuel requirements and decarbonization policies. Manufacturers are increasing investment in low-carbon and renewable methanol projects to support global decarbonization goals, while several regional governments are actively implementing sustainable manufacturing practices.
- Strategic partnerships are helping companies strengthen feedstock supply, improve production efficiency, and expand into new international markets, which further strengthens the industry as per the industry analysis.
- For instance, in 2026, Mitsubishi Gas Chemicals expanded its investment in a green methanol project by signing an MOU with Gold Hydrogen in South Australia.(Source: www.mgc.co.jp)
Methanol Market Trends
- Focus areas for low-carbon methanol have aligned with consumer preferences, offering fresh prospects in recent years. Also, industrial manufacturers and energy producers are actively looking to reduce greenhouse gas emissions as per the recent survey.
- Expansion into the marine fuel category is resulting in stronger policy support for the manufacturers in the current period. Also, the shipping companies are actively investing and seeking methanol-powered vessels while following the international environmental requirements.
- The greater expansion of production capacities and establishing local refineries with sophisticated imports is likely to strengthen the foundation for the future sector growth during the forecast period. Also, several manufacturers are trying to reduce dependance form the regular and limited regional production.
Report Scope
| Report Attributes | Details |
| Market Size in 2026 | USD 45.08 Billion/ 126.41 Million Metric Tons |
| Expected Size in 2035 | USD 75.84 Billion/ 195.27 Million Metric Tons |
| Growth Rate | CAGR of 5.95% |
| Base Year of Estimation | 2025 |
| Forecast Period | 2025-2035 |
| Dominant Region | Asia Pacific |
| Segment Covered | By Feedstock, By Derivatives, By Application, By Region |
| Key Companies Profiled | OCI Global, Celanese Corporation, BASF, Petronas Chemicals Group, Mitsubishi Gas Chemical Company, Zagros Petrochemical Company, Sinopec, Methanex Corporation, Proaman, SABIC |
Sustainable Production with Technology
Investment is increasing in lower-carbon methanol pathways, including biomass-based production and routes using renewable hydrogen and captured CO₂, alongside continued conventional production. Also, the companies are investing in Lower-carbon methanol pathways include biomethanol from biomass-derived feedstocks and e-methanol produced using hydrogen and captured CO₂ Modern process technologies are also improving production efficiency while reducing emissions and energy consumption. Digital monitoring systems and advanced process control are helping manufacturers improve plant performance and operational reliability.
Supply Chain Analysis of the Methanol Market
Production & Processing
- Making standard methanol looks like cooking compressed gases over a metallic catalyst. Factories blast natural gas with white-hot steam inside heavy steel reactors to smash the molecules into a blended vapor called syngas.
- They pump this vapor over specialized copper plates under immense pressure, forcing the carbon and hydrogen to lock together and condense into clear, liquid alcohol.
- Methanex Corporation: Methanex Corporation is the world’s largest producer and supplier of methanol.Methanex completed the acquisition of OCI Global’s international methanol business on June 27, 2025, strengthening its global production and supply position
- Key players: SABIC, Proman, OCI Global, Yanzhou Coal Mining Company, and Celanese Corporation.
Quality Testing and Certification
- Testing industrial methanol means confirming the chemical is totally pure, completely dry, and perfectly transparent. Techs shoot chemical samples through specialized laboratory sensors to track down even tiny drops of hidden water or rogue organic oils that could ruin an industrial batch.
- Independent testing networks then verify these metrics against global baselines, stamping the cargo with a formal safety seal before it ever loads onto cargo ships.
- SGS: SGS acts as a premier global inspection giant for the chemical commodities sector. Their field technicians operate advanced testing laboratories directly inside major shipping hubs to independently certify that bulk methanol shipments are completely free of contaminants.
- Key agencies: ASTM International, International Methanol Producers and Consumers Association (IMPCA), and ISO (International Organization for Standardization)
Distribution to Industrial Users
- Moving bulk methanol to industrial plants relies on a tight network of specialized chemical tankers, railcars, and dedicated pipelines.
- Because the liquid alcohol catches fire easily and burns with an invisible flame, distributors utilize highly secure, sealed steel containers. Logistics managers track these shipments continuously to ensure seamless, safe factory delivery.
- Stolt-Nielsen: Stolt-Nielsen is a premier global logistics leader specializing in transporting hazardous liquid chemicals. They operate a massive fleet of deep-sea parcel tankers and thousands of specialized tank containers to safely move methanol across worldwide shipping lanes.
- Key players: Brenntag, Univar Solutions, Helm AG, and Odfjell
Methanol Market Regulatory Landscape: Regulations
| Country Region | Regulatory Body | Key Regulations | Focus Areas |
| United States | U.S. Environmental Protection Agency (EPA) | Clean Air Act (CAA) Amendments [Section 112(b)]: Classifies industrial methanol directly as a Hazardous Air Pollutant (HAP). | Industrial Leak Containment: Mandating the use of heavy-duty, double-walled storage tanks and advanced optical sensors to instantly flag hidden liquid or vapor leaks at manufacturing facilities. |
| Europe | European Chemicals Agency (ECHA) | REACH Regulation [(EC) No 1907/2006] Annex XVII Entry 69: Imposes a strict consumer ban on the chemical. | Maritime Carbon Rules: Driving the shipping industry to swap dirty heavy fuel oil for certified green e-methanol to hit aggressive decarbonisation targets set by regional maritime laws. |
| China | Ministry of Emergency Management (MEM | Regulations on the Safe Management of Hazardous Chemicals [Decree No. 591] Chapter 2: Places methanol on China's Catalog of Hazardous Chemicals. | Coal-to-Chemical Security: Imposing tight environmental checks on inland mega-refineries that bake raw coal into syngas to ensure they do not pollute local regional river basins with chemical wastewater. |
Methanol Market Dynamics
Driver
Essential Feedstock Rise
The industries that depend on methanol as an important raw material for daily production are actively driving the industry demand in recent years. It is widely used to manufacture chemicals, plastics, paints, adhesives, fuels, and several industrial products. In the current period, demand is also increasing from the energy sector as methanol gains attention as a cleaner fuel option. Many manufacturers are expanding production to meet rising industrial requirements while improving supply reliability. Furthermore, growing industrial activity in developing countries is creating additional demand for methanol.
Restraint
Price Uncertainty Pressure
Frequent changes in raw material prices are expected to hinder industry growth during the forecast period. Natural gas, coal, and other feedstocks used for methanol production often experience price fluctuations because of supply conditions, geopolitical events, and energy market changes. When production costs increase, manufacturers may face lower profit margins or higher product prices. Smaller producers are affected more because they have limited flexibility to absorb rising costs.
Opportunity
Green Innovation Fuels Industry Momentum
The increasing development of green and renewable methanol is anticipated to create exceptional opportunities in the industry during the projected time period. Also, many companies are investing in cleaner production methods that use biomass, captured carbon dioxide, and green hydrogen instead of traditional fossil-based feedstocks. These projects are attracting attention from industries that want to reduce carbon emissions while maintaining reliable fuel and chemical supplies. Shipping companies, energy producers, and industrial manufacturers are showing growing interest in renewable methanol.
Segmental Insights
Feedstock Insights
Natural gas accounted for 64% of 2025 revenue, reflecting its established role as a conventional methanol feedstock and the existing production infrastructure based on natural-gas reforming., as the increasing development of green and renewable methanol. Many companies are investing in cleaner production methods that use biomass, captured carbon dioxide, and green hydrogen instead of traditional fossil-based feedstocks. These projects are attracting attention from industries that want to reduce carbon emissions while maintaining reliable fuel and chemical supplies. Shipping companies, energy producers, and industrial manufacturers are showing growing interest in renewable methanol.
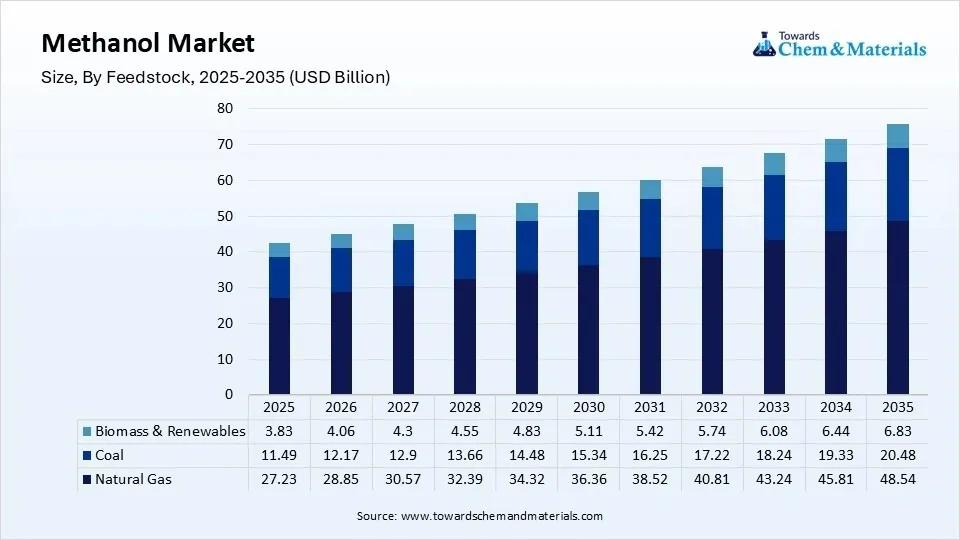
The biomass & renewables segment held a 9% market share in 2025 and is expected to be the fastest-growing in the market, with a CAGR of 12.80% in the forecast period, owing to industries working to reduce their environmental impact. Companies are looking for cleaner raw materials that support low-carbon manufacturing while meeting future sustainability targets. Renewable feedstocks also help producers reduce dependence on fossil resources and create products with a lower carbon footprint.
Methanol Market Share, By Feedstock, 2025 (%)
| By Feedstock | Revenue Share, 2025 (%) |
| Natural Gas | 64% |
| Coal | 27% |
| Biomass & Renewables | 9% |
Derivatives Insights
The formaldehydes segment dominated the market with 27% share in 2025, owing to its being one of the most widely used products made from methanol. It is an essential material for manufacturing wood panels, furniture, construction materials, insulation products, automotive components, and many household goods. Since these industries produce goods in very large quantities throughout the year, formaldehyde demand remains consistently strong.
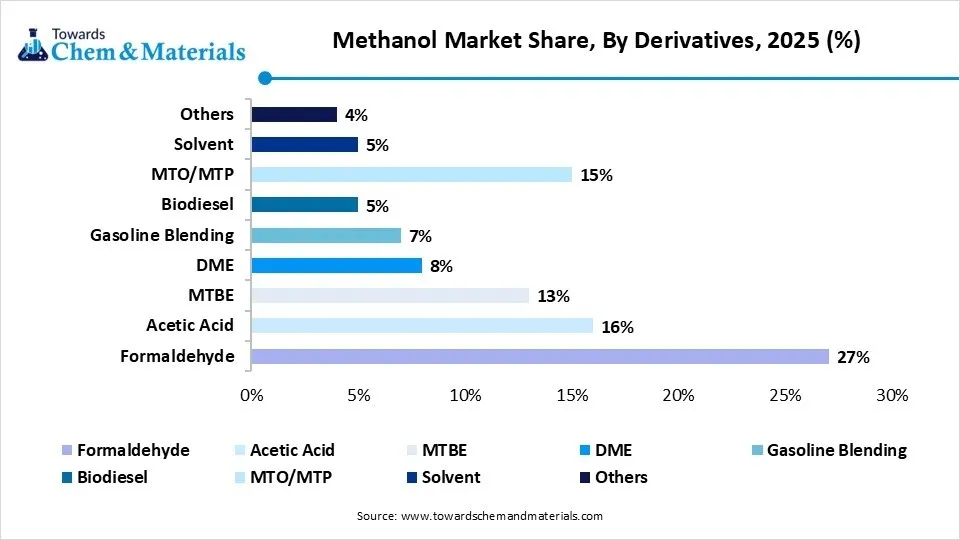
The MTO/MTP segment held a 15% market share in 2025 and is expected to be the fastest-growing in the market, with a CAGR of 8.90% in the forecast period, The MTO/MTP segment is expanding as methanol-to-olefins and methanol-to-propylene technologies provide routes to petrochemical intermediates to convert methanol into valuable petrochemical products. Demand for plastics and packaging materials continues to increase worldwide, encouraging investment in these advanced production routes. Many chemical producers are expanding MTO and MTP projects to improve raw material flexibility while supporting growing petrochemical demand.
Methanol Market Share, By Derivatives, 2025 (%)
| By Derivatives | Revenue Share, 2025 (%) |
| Formaldehyde | 27% |
| Acetic Acid | 16% |
| MTBE | 13% |
| DME | 8% |
| Gasoline Blending | 7% |
| Biodiesel | 5% |
| MTO/MTP | 15% |
| Solvent | 5% |
| Others | 4% |
Application Insights
The construction segment dominated the market with 39% share in 2025, owing to many construction materials depending on methanol-based chemicals during manufacturing. Products such as plywood, laminates, insulation materials, paints, coatings, adhesives, and engineered wood all require methanol derivatives. As urban development and infrastructure projects continue worldwide, demand for these building materials remains high. Construction activities in both developed and developing countries also support continuous consumption of methanol-based products.
The electronics segment is projected to grow at a 7.10% CAGR from 2026 to 2035, supported by methanol and methanol-derived chemicals used in selected electronic-material and semiconductor manufacturing processes. Methanol and its derivatives are used during the production of electronic components, specialty materials, and semiconductor-related products. As technologies such as artificial intelligence, electric vehicles, and advanced communication systems expand, manufacturers are increasing investment in electronics production. This growth is creating additional demand for methanol-based chemicals used in precision manufacturing.
Methanol Market Share, By Application, 2025 (%)
| By Application | Revenue Share, 2025 (%) |
| Construction | 39% |
| Automotive | 26% |
| Electronics | 18% |
| Others | 17% |
Regional Analysis
How Did Asia Pacific Dominate the Methanol Market in 2025?
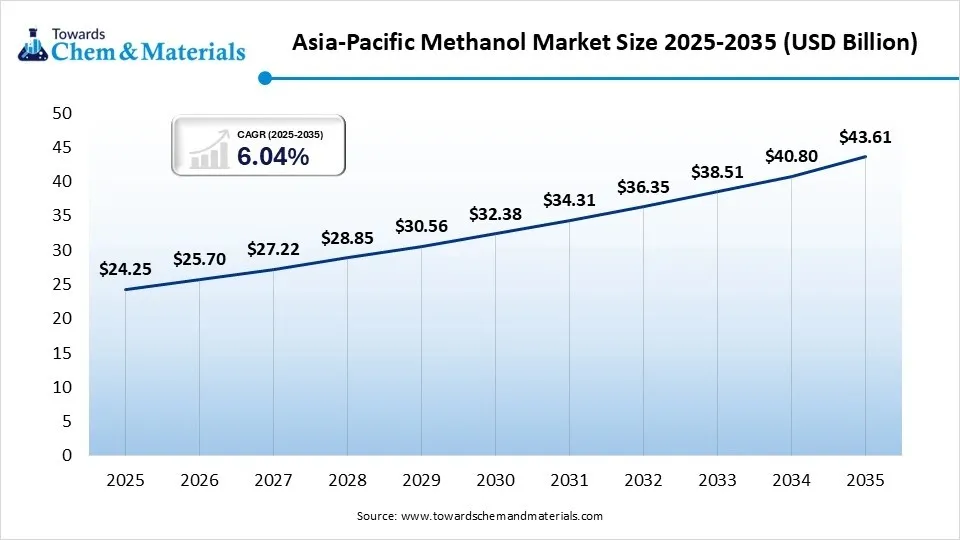
The Asia Pacific methanol market size was estimated at USD 24.25 billion in 2025 and is projected to reach USD 43.61 billion by 2035, growing at a CAGR of 6.04% from 2026 to 2035. Asia Pacific dominated the market with a share of 57% in 2025, due to the it is home to some of the world's largest chemical manufacturing industries. Many countries in the region produce methanol-based products on a large scale to meet both domestic and international demand. Rapid industrial growth, expanding manufacturing activities, and increasing investment in chemical production continue to support methanol consumption.
China
- The country has invested heavily in methanol production and downstream chemical manufacturing, while many chemical companies are expanding facilities that convert methanol into valuable industrial products, helping meet growing domestic demand.
- The country is also increasing the use of methanol in fuel applications and advanced chemical processes to support industrial development.
Japan
- Companies in Japan are increasing research on low-carbon methanol while exploring its use in shipping and sustainable fuel projects, while the country's strong specialty chemical industry is also creating demand for high-quality methanol products used in advanced manufacturing.
- The collaboration between industrial companies to develop environmentally friendly production methods in the country nowadays.
Europe Methanol Market Size, Share and Forecast
The Europe methanol market size was estimated at USD 5.53 billion in 2025 and is projected to reach USD 10.24 billion by 2035, growing at a CAGR of 6.35% from 2026 to 2035. Europe held 13% market share in 2025 and is expected to be the fastest-growing region in the market, with a CAGR of 7.2% in the forecast period, owing to many countries investing in renewable and low-carbon methanol production. The region is placing greater emphasis on reducing industrial emissions while encouraging the development of cleaner fuels for transportation and manufacturing. Many companies are also building partnerships to produce sustainable methanol using renewable resources and captured carbon dioxide. This transition toward cleaner production methods is creating new investment opportunities throughout Europe.
Germany
- Germany is strengthening its methanol industry through investment in green technologies and industrial innovation, while many producers are exploring renewable methanol for use in chemical manufacturing and sustainable energy projects.
- Also, the country's advanced engineering sector is supporting the development of modern production technologies that improve efficiency while lowering emissions.
Italy
- Major companies are exploring methanol as an alternative fuel while improving manufacturing processes that depend on methanol-based chemicals, while the country's ports and shipping activities are also encouraging discussions around cleaner marine fuels for future operations.
- Chemical manufacturers are modernizing production facilities to improve efficiency and reduce environmental impact in the country nowadays.
North America Methanol Market Size, Share and Forecast
The North America methanol market size was estimated at USD 6.81 billion in 2025 and is projected to reach USD 12.51 billion by 2035, growing at a CAGR of 6.27% from 2026 to 2035. North America held a 16% market share in 2025, owing to industries increasing investment in advanced chemical manufacturing and cleaner fuel technologies. Many companies are expanding methanol production while exploring new industrial applications beyond traditional chemical processing. Growing interest in carbon reduction is encouraging research into renewable methanol and carbon capture technologies. The region also benefits from a reliable natural gas supply, supporting competitive methanol production.
United States
- The United States is expanding its methanol market through increasing investment in low-emission fuels and modern chemical production, while manufacturers are developing projects that support renewable methanol while improving production efficiency at existing facilities.
- Also, the country's shipping, energy, and industrial sectors are also exploring methanol as an alternative fuel for future operations.
Canada
- Canada is bolstering its methanol market by making greater use of its natural resource base while investing in cleaner industrial development, & producers are evaluating renewable methanol projects that use sustainable feedstocks and lower-carbon production methods.
- Also, the country's focus on clean energy and environmental innovation is encouraging investment in advanced fuel technologies.
Methanol Market Survey in Latin America
The Latin America methanol market size was estimated at USD 2.55 billion in 2025 and is projected to reach USD 4.93 billion by 2035, growing at a CAGR of 6.81% from 2026 to 2035. Latin America held a 6% market share in 2025 as industrial production continues to expand across several countries. Manufacturers are increasing the production of paints, plastics, construction materials, and chemical products that depend on methanol and its derivatives. At the same time, governments and private companies are investing in industrial development to improve manufacturing capacity and support economic growth.
Brazil
- Brazil is leading the regional market because its large manufacturing and agricultural industries create strong demand for methanol-based products, while chemical producers are increasing the use of methanol to manufacture resins, adhesives, and industrial chemicals used across different sectors.
- The country is also expanding industrial production to support growing domestic demand for consumer and construction products.
Argentina
- The country's chemical sector is improving production efficiency and expanding downstream manufacturing activities, while companies are increasing the use of methanol in industrial processing and improving supply chains for chemical products.
- Also, the growing demand for methanol-based materials used in automotive components, coatings, and industrial manufacturing in Argentina in the current period.
Middle East and Africa Methanol Sector Observation
The Middle East and Africa methanol market size was estimated at USD 3.40 billion in 2025 and is projected to reach USD 6.45 billion by 2035, growing at a CAGR of 6.61% from 2026 to 2035. The Middle East and Africa held an 8% market share in 2025, as several countries have abundant natural gas resources that support competitive methanol production. Many producers are expanding manufacturing capacity while increasing exports to international markets. Governments are also encouraging industrial diversification by investing in downstream chemical industries that use methanol as a key raw material. At the same time, growing infrastructure development is increasing regional demand for methanol-based construction materials.
Saudi Arabia
- The country continues strengthening its methanol industry by expanding its petrochemical sector and increasing production of value-added chemical products, and many manufacturers are investing in integrated industrial projects that convert methanol into higher-value downstream products.
- The country is also focusing on industrial diversification by reducing dependence on crude oil exports and expanding chemical manufacturing.
UAE
- The UAE is expanding its methanol market by increasing investment in modern chemical manufacturing and industrial infrastructure, while companies are exploring new opportunities to improve production efficiency while supporting future energy transition projects.
- Also, the growing interest in sustainable industrial technologies that improve resource efficiency in the country.
Recent Development
- In May 2026, Thermax has created a strategic collaboration with Ankur Scientific regarding the establishment of the green methanol plant in India. Also, the capacity of these future plants is likely to be 18000 tons of methanol production per year, as per the published report.(Source: energy.economictimes.indiatimes.com)
Competitive Analysis
The market is highly competitive because companies are focusing on expanding production capacity, improving manufacturing efficiency, and developing lower-carbon methanol solutions. Instead of competing only through production volume, many manufacturers are investing in technology, sustainability, and global supply chain expansion, as per the recent industry survey.
Methanex Corporation, which continues expanding its global methanol business through production optimization, supply reliability, and low-carbon methanol initiatives, with the introduction of bunkering operations. The company is actively investing in projects that support future sustainable methanol demand while strengthening its position in international markets. (Source: www.methanex.com) https://www.methanex.com/news/release/methanex-launches-global-methanol-bunkering-operations-with-strategic-partnerships-in-the-ara-region-and-south-korea/
Top Vendors in the Methanol Market & Their Offerings:
| Company | Company Type/Position | Major Headquarters | Geographic Presence | Offerings | Key Strength |
| Methanex Corporation | Global Production Leader | Vancouver, Canada | Massively widespread across North America, South America, Europe, the Middle East, and the Asia-Pacific region. | Millions of tons of commercial-grade liquid methanol annually, along with a growing supply of low-carbon bio-methanol. | Total supply chain ownership, backed by a massive, dedicated fleet of transoceanic chemical shipping vessels. |
| Proaman | Integrated Energy & Petrochemical Giant | Wollerau, Switzerland | Highly concentrated production hubs in Trinidad and Tobago, the United States, and Oman, with global export routes. | High-purity industrial methanol, green methanol variants, fertilizer products, and melamine. | Deep vertical integration, managing everything from natural gas extraction to processing and downstream transport. |
| SABIC | Diversified Chemical Heavyweight | Riyadh, Saudi Arabia | Strong distribution networks across the Middle East, Europe, the Americas, and major manufacturing hubs in Asia. | Bulk chemical building blocks including methanol, advanced polymers, industrial plastics, and agri-nutrients. | Vast financial backing and low-cost access to regional raw natural gas feedstocks for highly competitive manufacturing. |
- Proman is currently focusing on strengthening its position in the global methanol industry by expanding its production capabilities and supporting the transition toward lower-carbon methanol investments.(Source: www.guardian.co.tt)
Other Key Players
- OCI Global
- Celanese Corporation
- BASF
- Petronas Chemicals Group
- Mitsubishi Gas Chemical Company
- Zagros Petrochemical Company
- Sinopec
Segments Covered in the Report
By Feedstock
- Natural Gas
- Conventional Natural Gas
- Associated Gas
- Shale Gas
- Coal
- Bituminous Coal
- Lignite Coal
- Biomass & Renewables
- Biomass Gasification
- Municipal Solid Waste
- Renewable Hydrogen + Captured CO₂
- Biomethane
By Derivatives
- Formaldehyde
- Urea Formaldehyde Resins
- Phenol Formaldehyde Resins
- Melamine Formaldehyde Resins
- Acetic Acid
- Vinyl Acetate Monomer
- Purified Terephthalic Acid
- Acetate Esters
- MTBE
- DME
- LPG Blending
- Clean Cooking Fuel
- Gasoline Blending
- Biodiesel
- MTO/MTP
- Ethylene Production
- Propylene Production
- Solvent
- Others
- Methylamines
- Chloromethanes
- Dimethyl Sulfate
By Application
- Construction
- Insulation Materials
- Adhesives & Resins
- Paints & Coatings
- Automotive
- Fuel Applications
- Engineering Plastics
- Coatings
- Electronics
- Semiconductor Chemicals
- Electronic Resins
- Display Materials
- Others
- Pharmaceuticals
- Agriculture
- Marine
- Textile
By Region
- North America
- Europe
- Asia Pacific
- Middle East & Africa
- Latin America
A Seven-Phase Framework
Our methodology is designed to be universally applicable across commodity chemicals, specialty chemicals, petrochemicals, construction chemicals, coatings, electronic chemicals, industrial gases, agrochemicals, water treatment chemicals, and performance materials. Each phase builds upon the last, creating a layered validation structure that minimizes estimation error and maximizes analytical confidence.
The framework ensures comprehensive market coverage, robust cross-validation, and reliable long-term forecasting — producing market estimates that withstand scrutiny from investors, regulators, and corporate strategy teams.

Seven-Phase Framework — Analytical Effort Distribution
Relative analytical effort allocated across each phase of the Chemicals & Materials research framework

Phase 1 - Secondary Research: Establishing the Foundation
Secondary research collects and evaluates publicly available information from authoritative sources, establishing the foundational understanding of market structure, value chain dynamics, competitive landscape, and end-use demand patterns. Every source is evaluated for credibility, recency, geographic relevance, and methodological soundness before inclusion.
Industry Associations
Sources include ACC, CEFIC, ICCA, JCIA, CPCIF, and SOCMA providing production volumes, consumption trends, capacity developments, and sustainability initiatives.
Company Disclosures
Annual reports, investor presentations, earnings transcripts, and regulatory filings reveal product portfolios, manufacturing footprints, capacity expansions, and revenue segmentation.
Government Databases
National statistical offices, customs authorities, environmental agencies, and industrial production databases provide verified statistics on output, trade flows, and regulatory compliance.
Trade Databases
UN Comtrade, ITC, Eurostat, and national customs authorities enable assessment of global product movement, import dependency, and export competitiveness across regions.
Our Secondary Research Sources
- Ministry of Chemicals and Fertilizers
- European Chemicals Agency
- United States Department of Energy
- Ministry of Industry and Information Technology
- Ministry of Economy Trade and Industry
- Ministry of Trade Industry and Energy
- National Institute of Standards and Technology
- Council of Scientific and Industrial Research
- Fraunhofer Society
- National Institute for Materials Science
Phase 2 — Supply-Side Assessment: Mapping Production Capabilities
Production Capacity Analysis
All major manufacturers are assessed for existing installed capacity, planned additions, expansions, new plant announcements, and technology adoption — mapped at global, regional, and country levels.
Capacity Utilization Adjustment
Installed capacity is adjusted using utilization rates based on demand conditions, feedstock availability, plant operating rates, maintenance schedules, and regulatory restrictions.
Manufacturer Revenue Analysis
Product-specific revenues, segment-level performance, regional distribution, average selling prices, and margin trends are evaluated to establish market value estimates.
Supply-Side Assessment — Capacity vs. Effective Production by Region
Illustrative comparison of installed capacity vs. effective production volume (after utilization rate adjustment) across major regions

Phase 3 — Demand-Side Assessment: Quantifying Chemical Consumption
Demand-side analysis quantifies chemical consumption across industries, applications, and geographies — identifying where and how chemicals are consumed throughout the value chain with precision.
End-Use Industry Analysis
Chemical demand is evaluated across automotive, construction, packaging, electronics, agriculture, healthcare, consumer goods, industrial manufacturing, energy and utilities, and water treatment. Industry output, production trends, and consumption intensity are analyzed to determine demand patterns.
Consumption Modeling
Demand is estimated using measurable indicators: kilograms per vehicle, kilograms per square meter of construction, dosage per cubic meter of water treated, kilograms per hectare of agricultural land, and kilograms per ton of manufactured products. Consumption factors are validated through industry publications and primary interviews.
Application Analysis
The market is segmented by application area to understand product performance requirements, formulation trends, technology adoption, customer preferences, and regulatory requirements improving demand accuracy and segmentation granularity.
Demand-Side Assessment — End-Use Industry Demand Distribution
Illustrative distribution of chemical & materials demand across key end-use industries

Phase 4 - Trade Flow Analysis: Balancing Regional Supply and Demand
Trade flow analysis reconciles regional supply and demand estimates through import and export data, identifying net supply positions, regional dependencies, and market imbalances. It serves as an independent validation layer that tests the consistency of supply-side and demand-side estimates.
Import Analysis
Import data is evaluated to determine volumes, source countries, product dependency, regional supply gaps, and pricing trends — identifying markets that rely heavily on external supply and where domestic production is insufficient to meet demand.
Export Analysis
Export assessments reveal production surplus, export competitiveness, regional manufacturing strength, and global market participation. Export patterns also help validate domestic production estimates and identify net exporting regions.
Apparent Consumption Model
Regional consumption is assessed using the standard apparent consumption formula:
Results identify net importing regions, net exporting regions, regional deficits, and surpluses — serving as an independent validation of supply and demand estimates.
Trade Flow Analysis — Net Supply Position by Region
Illustrative apparent consumption vs. domestic production across major regions — positive gap indicates net import dependency

Phase 5 — Primary Research: The Critical Validation Layer
Primary research tests and refines findings from secondary research through direct engagement with industry participants across the supply chain, demand side, and expert community. It captures intelligence that no database or published report can provide — the real-world experience of manufacturers, buyers, and specialists operating in the market.

Supply-Side Interviews
Conversations with chemical manufacturers, raw material suppliers, contract manufacturers, technology providers, and plant operators cover production trends, capacity utilization, pricing developments, technology shifts, and competitive dynamics.

Demand-Side Interviews
Engagement with OEMs, industrial consumers, procurement managers, distributors, formulators, and end-use manufacturers focuses on consumption trends, purchasing behavior, product substitution, demand outlook, and emerging applications.

Industry Expert Consultations
Additional interviews with industry consultants, independent experts, regulatory specialists, technical professionals, and research institutions provide deeper market context and validate key analytical assumptions.
Focus Areas of Primary Research:
Market Size & Forecast Validation
Revenue estimates, volume consumption, growth rates, forecast assumptions, regional demand.Supply Chain & Value Chain Assessment
Raw material sourcing, supply chain challenges, distribution networks, procurement practices.Production & Capacity Analysis
Manufacturing capacity, utilization rates, expansion projects, plant investments.Pricing & Cost Structure Analysis
Product pricing trends, feedstock costs, energy costs, margin pressures, pricing outlook.Competitive Landscape Assessment
Volume and value estimates confirmed to be fully consistent with one another before publicationInterview Volume by Market Scope
| Study Scope | Number of Interviews |
|---|---|
| Niche Market | 20 – 30 |
| Mid-Sized Market | 30 – 50 |
| Global Market | 50 – 80 |
| Highly Fragmented Market | 80 – 120 |
Interview Details:
Category : Manufacturers, Suppliers, Distributors, End Users, Experts/Associations
Average Duration : 30–60 Minutes
Interview Mode : Video calls, telephonic interviews, expert consultations
Interview Format : Structured / Semi-Structured questionnaire
Focus Areas of Primary Research:
Market Size & Forecast Validation :
Revenue estimates, volume consumption, growth rates, forecast assumptions, regional demand.
Supply Chain & Value Chain Assessment :
Raw material sourcing, supply chain challenges, distribution networks, procurement practices.
Production & Capacity Analysis :
Manufacturing capacity, utilization rates, expansion projects, plant investments.
Pricing & Cost Structure Analysis :
Product pricing trends, feedstock costs, energy costs, margin pressures, pricing outlook.
Competitive Landscape Assessment :
Market share, competitor positioning, strategic initiatives, partnerships, acquisitions.
Primary Research — Stakeholder Coverage by Category
Distribution of interview respondents across stakeholder categories (% share from PPT data)

Primary Research — Respondent Designation Profile
Seniority breakdown of interview respondents (% share from PPT data)

Primary Research — Geographic Coverage of Interviews
Regional distribution of primary research engagement (% share from PPT data)

Phase 6 — Data Triangulation and Market Validation
No single methodology is relied upon in isolation. Multiple independent estimation approaches are combined and reconciled to ensure consistency, accuracy, and analytical defensibility. Any material deviations between approaches are investigated and adjusted through additional validation cycles.
The final market size is derived through weighted triangulation of all validated methodologies. Any material deviations between approaches are investigated and adjusted through additional validation cycles. The outcome represents the most realistic assessment of the market based on available evidence and expert confirmation ensuring that volume and value estimates are fully consistent with one another.
Triangulation Framework — Input Contribution Weight
Relative weight each sizing input contributes to the final reconciled market estimate

Phase 7 — Forecast Modeling: Projecting Future Market Evolution
Forecasting evaluates the future trajectory of the market using a combination of quantitative indicators and qualitative assessments across economic, industry, and regulatory dimensions. Rather than simple extrapolation, each driver is independently modeled and integrated into a composite forecast.
Macroeconomic Indicators
GDP growth, industrial production, manufacturing output, construction activity, consumer spending, and capital investment form the quantitative foundation of long-term demand projections. These are applied at country, regional, and global levels.
Industry Growth Drivers
Urbanization, infrastructure development, industrialization, technological innovation, sustainability initiatives, and evolving product performance requirements are assessed at regional and industry levels — capturing both structural and cyclical demand drivers.
Capacity Expansion Analysis
Announced plant expansions, new manufacturing facilities, technology upgrades, and strategic investments are evaluated to determine future supply-demand dynamics and potential market tightness or oversupply situations.
Regulatory & Sustainability
Environmental regulations, chemical safety standards, emission reduction targets, circular economy initiatives, and sustainability requirements are incorporated as they often influence product adoption rates and market growth trajectories.
Scenario Forecast Range — Indexed Market Growth (Year 1–10)
Illustrative indexed growth trajectories across Base, Optimistic, and Pessimistic scenarios over a 10-year forecast horizon

Forecast Drivers — Relative Impact Score by Category
Impact score (0–100) of each driver type on chemicals & materials market forecast




Comments
Share your thoughts, ask a question, or provide feedback about this report.