
Carbon Dioxide Removal Market Size, Competitive Landscape Analysis Report 2035
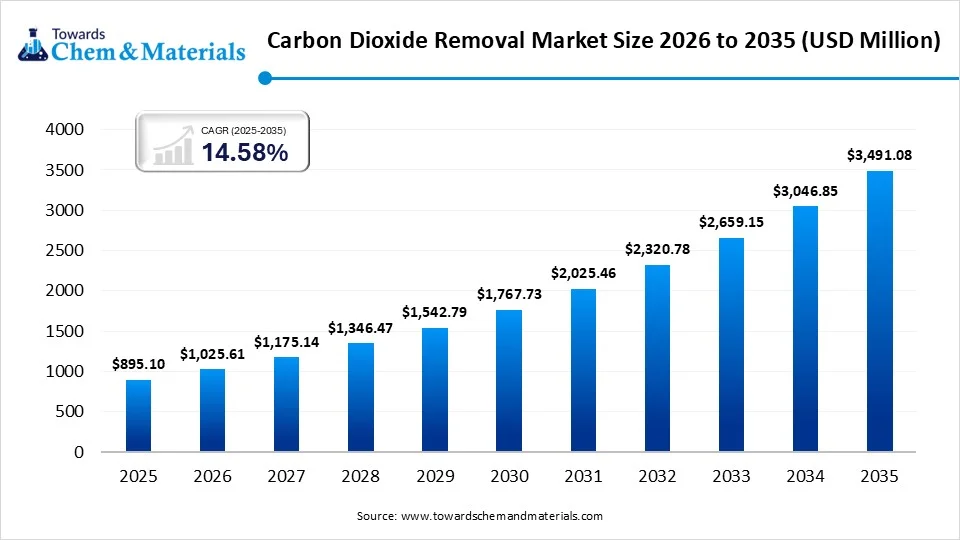
The global carbon dioxide removal market size was valued at USD 895.10 million in 2025 and is expected to hit around USD 3,491.08 million by 2035, growing at a compound annual growth rate (CAGR) of 14.58% over the forecast period 2025 to 2035.The increasing governmental initiatives toward sustainability and advancement in CDR technology are elevating the industry dynamics in the current market scenario.
Market Highlights
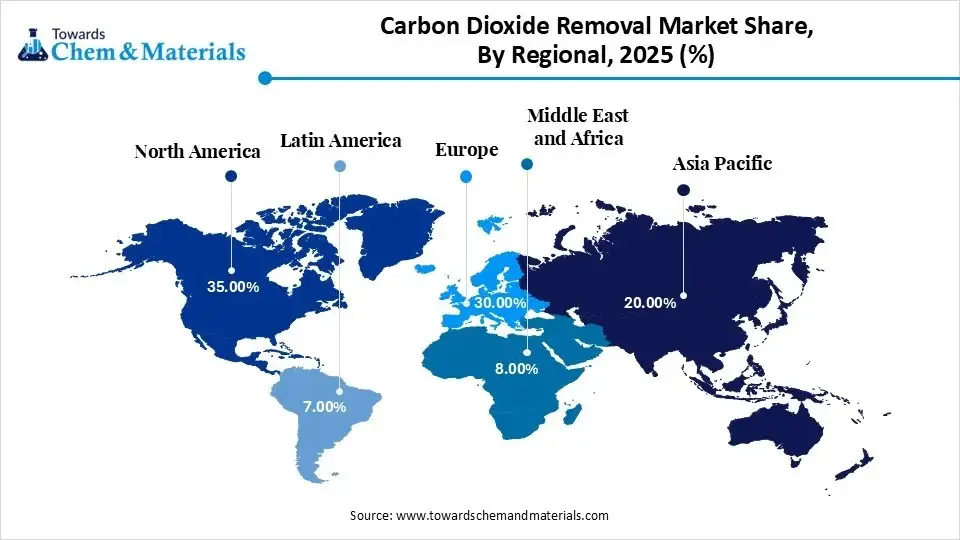
- By region, North America dominated the carbon dioxide removal market revenue share 35% in 2025.The rising government intervention in reducing carbon emission drives the market growth in the region.
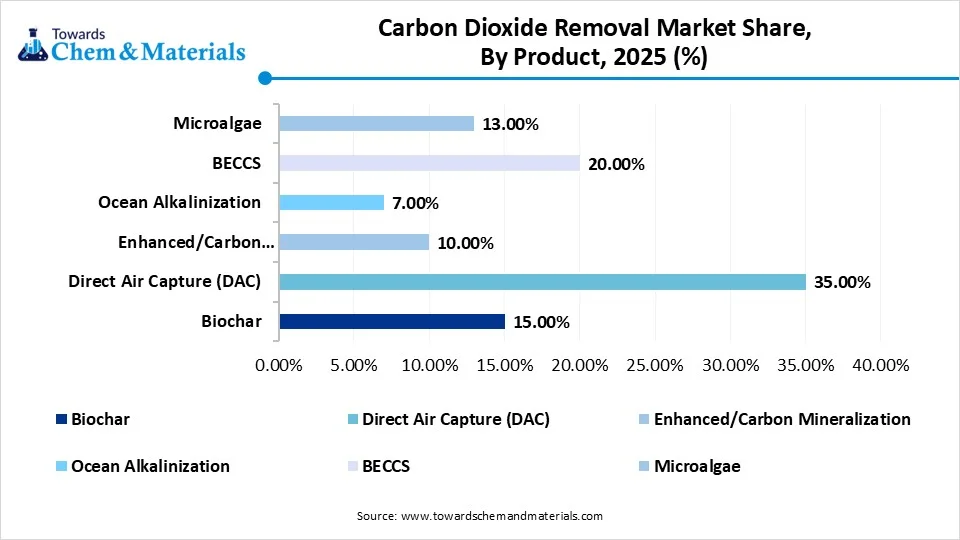
- By product type, the direct air capture (DAC) segment held the dominating share of the market revenue share 35.00% in 2025, akin to its advanced technology capabilities.
- By application, the technology sector segment dominated the market with the largest share 75.00% in 2025, with increasing investments in advanced carbon removal technologies.
From Reforestation to High Tech: CDR Market Gains Momentum Across All Fronts
The carbon dioxide removal market has witnessed rapid growth in the recent period. Carbon dioxide removal programs are playing a major role in heavy industries nowadays as the increasing trend toward sustainability and eco-friendly environment. Moreover, the innovation of the latest carbon dioxide removal technologies is majorly contributing to industry growth in the current period.Also, the increasing need for long-term and reliable carbon offset is expected to gain major market share during the forecast period as industries are seen moving to advanced emission control strategies from traditional ones in recent years. Several industries are looking for customized carbon removal models according to their specific needs, which are likely to grab some market share in the coming years as per expectations.
The global push toward zero carbon emissions has been driving the growth of the carbon dioxide removal market. As the country and its enlarged companies are seen in setting targets for minimizing carbon emissions for upcoming years. Moreover, carbon dioxide removal technology manufacturers are gaining major market share by providing the latest custom models for these industries and countries nowadays.Also, several governments are increasing collaboration and agreements with industries to minimize carbon emissions in the future, which is apparently creating lucrative opportunities for the carbon dioxide removal technology manufacturer in the coming years. Also, the reforestation programs and investments are majorly.
Technological Shift Unlocks New Removal Pathways
The technological shift shows revolutionary change where CO2 acts as a high-value feedstock by re-engineering high-efficiency sorbents. The AI develops direct air capture systems and bioenergy with carbon capture by optimizing real-time monitoring and verification to prevent costly downtime.
Trade Analysis of the Carbon Dioxide Removal Market: Import and Export Statistics
- China exported 53 shipments of carbon dioxide removal.
- The United States exported 50 shipments of carbon dioxide removal.
- Japan exported 18 shipments of carbon dioxide removal.
- From June 2024 to May 2025, the world exported 123 shipments of carbon dioxide removal.
Market Trends
- The increasing use of direct air capture (DAC) technology is spearheading the carbon dioxide removal market growth in the current period. This technology allows large manufacturing units to capture carbon dioxide directly from the air with minimum processes. As the sustainability initiatives increase, technology is expected to gain major market growth.
- The rising need for nature-based and hybrid solutions is driving industry growth in the current period. Several countries are seen using natural carbon dioxide removal solutions like afforestation, blue carbon, and soil carbon storage, akin to its affordability. Moreover, the hybrid models will also give a heavy consumer base to the market in the future as individuals adopt technology with a natural impact during the forecast period.
- In November 2024, the National Oceanic and Atmospheric Administration (NOAA) collaborated with the Carbon to Sea Initiative. This collaboration aims to develop guidelines for marine carbon dioxide removal projects and support research and technology development.
Report Scope
| Report Attributes | Details |
| Market Size in 2025 | USD 1,025.61 Million |
| Expected Size in 2035 | USD 3,491.08 Million |
| Growth Rate | CAGR of 14.58% |
| Base Year of Estimation | 2025 |
| Forecast Period | 2025-2035 |
| High Impact Region | North America |
| Segment Covered | By Product, By Application, By Region |
| Key Companies Profiled | Climeworks,Global Thermostat,Cella Mineral Storage Inc.,Bussme Energy AB,Carbofex Ltd.,Neustark Ag,Carbon Engineering Ltd.,Arca, Ebb Carbon,CarbonCure Technologies Inc.,CarbonFree,Carbfix hf.,HEIMDAL,Oregon Biochar Solutions,Wakefield Biochar,Novocarbo GmbH,Carbicrete,Blue Planet Systems,Pacific Biochar Benefit,Charm Industrial |
Value Chain Analysis: Carbon Dioxide Removal Market
- Carbon Capture and Extraction: The stage of separation of carbon dioxide from biogenic sources and bio-char production using DAC and BECCS.
- Key Players: 1PointFive, Climeworks, Carbonfuture, and Carbon Engineering
- Transport and Storage: The stage of compression and liquefaction in CO2 pipeline logistics, shipping, and deep geological mineralization.
- Key Players: Shell plc, Carbfix, Aker Carbon Capture, and Equinor
- Verification and Sales: The final stage of removal into a financial asset through monitoring, reporting, and verification to create a carbon credit.
- Key Players: Sylvera, BeZero Carbon, Patch, and Puro. earth
Market Opportunity
Customized Carbon Dioxide Removal Technologies to Become Key Differentiator in Competitive Landscape
The increasing need for tailored carbon dioxide removal solutions for businesses is expected to create substantial growth opportunities in the carbon dioxide removal market in the forecast period. Major industries are actively looking for specific carbon dioxide removal strategies according to their work conditions.
Thus, the carbon dioxide removal solution provider will gain major market traction by providing carbon dioxide removal solutions according to their needs in the future. Also, the manufacturers can integrate the latest technological advances for system enhancement and other benefits, which is anticipated to give popularity in the market during the projected period as per observation.
Market Challenge
Without Funding and Awareness, Carbon Removal Struggles to Reach Full Potential
The high operational cost of carbon dioxide removal technology is expected to hamper industry growth during the projected period. Setting up carbon removal projects can create some cost barriers for the new entrants in the market.
A few things, such as building infrastructure, verification of removal process, and creation of monitoring systems, can be expensive sometimes, which is anticipated to hinder market growth potential in the coming years. Furthermore, limited public awareness and policy support can impede industry growth akin to rising problems in raising funding and attention towards climate change in the current period.
Segmental Insights
By Product Insights
The direct air capture (DAC) segment led the dominating share of the carbon dioxide removal market share 35.00% in 2025. Having advanced technology capabilities, flexibility, and huge investments is leading the segment growth in the current period. Moreover, the Dac method can easily measure carbon removal scale exactly, which has gained the heavy industry attraction in recent period.Also, the location suitability is expected to gain a major market share of the segment during the forecast period, as the DAC does not need any specific land to establish, which can be set up in industrial zones or deserts. Thus, several manufacturers are increasingly adopting DAC technology while freely setting these plants according to their suitable space as per observations.
The enhanced carbon mineralization segment is expected to experience significant carbon dioxide removal market growth during the predicted period. The growth of the segment is attributed to its characteristics such as scalability, high performance, and compatibility.
Moreover, the long-term storage capability will provide a heavy consumer base to the carbon mineralization segment during the forecast period, as the carbon formed from the mineralization has greater stability, which easily sustains thousands of years. Also, the vast availability of raw materials for mineralization can gain robust market attraction in the coming years as the traditional process needs specific and rare raw materials in the current period.
Carbon Dioxide Removal Market Share, By Product , 2025 (%)
| By Product | Revenue Share, 2025 (%) |
| Biochar | 15.00% |
| Direct Air Capture (DAC) | 35.00% |
| Enhanced/Carbon Mineralization | 10.00% |
| Ocean Alkalinization | 7.00% |
| BECCS | 20.00% |
| Microalgae | 13.00% |
By Application Insights
The technology sector segment dominated the carbon dioxide removal market with the largest share 75.00% in 2025, Carbon removal has become a critical function in today's sustainable environment practices in several industries. Moreover, the technology sector is seen under heavy investments and innovation in the current period, which has led the segment growth in recent years. Major technology firms are increasingly investing in sustainable initiatives with carbon removal activities while purchasing carbon removal credits in the current industry scenario.
The finance sector segment is seen to grow at a notable rate during the predicted timeframe. The increasing government regulations toward an eco-friendly environment are expected to contribute to the segment growth during the forecast period. Several major financial institutions, such as banks, insurance companies, and investment firms, are seen as trying to meet net-zero emission goals in the current period. As for the future trend toward carbon credit trading, the financial sector will gain major market traction during the projected period as sector involvement in carbon trading has been observed recently.
Carbon Dioxide Removal Market Share, By Application , 2025 (%)
| By Application | Revenue Share, 2025 (%) |
| Technology Sector | 75.00% |
| Finance Sector | 25.00% |
Regional Insights
The North America carbon dioxide removal market size was valued at USD 313.29 billion in 2025 and is expected to be worth around USD 1,239.33 billion by 2035, exhibiting at a compound annual growth rate (CAGR) of 14.74% over the forecast period from 2026 to 2035.The region is maintaining its dominance based on fewer initiatives, such as favorable government policies and heavy funding and others in the current period. The governments in the region, such as the United States and Canada are seen in offering several benefits, such as subsidies and tax minimization, to support carbon removal technologies in several industries nowadays.
Also, rising initiatives toward research and development programs for technologies such as direct air capture and bioenergy are leading the regional growth of the market in the current period.
United States Leads North American Market with Innovation and First-Mover Advantage
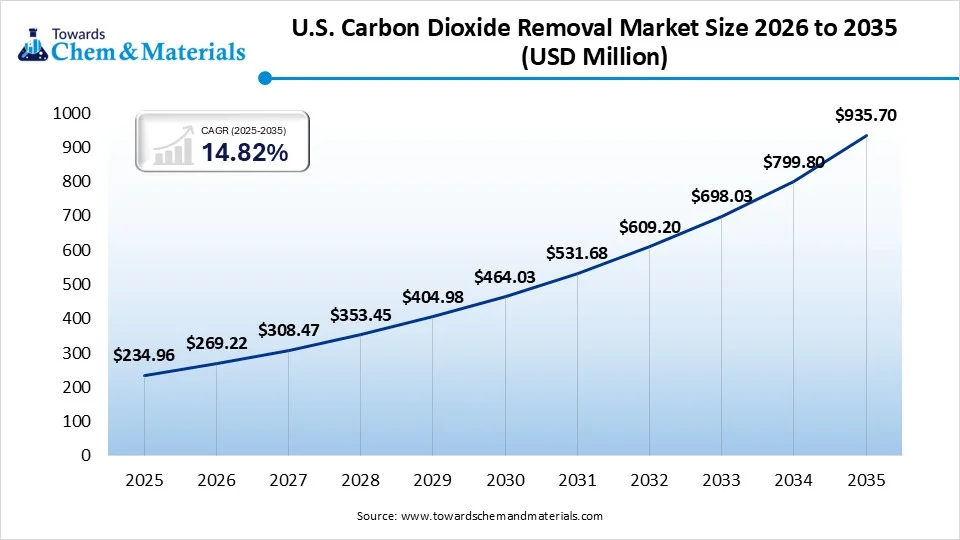
The U.S. carbon dioxide removal market size was valued at USD 234.96 billion in 2025 and is expected to be worth around USD 935.70 billion by 2035, exhibiting at a compound annual growth rate (CAGR) of 14.82% over the forecast period from 2026 to 2035. United States is the leading market in the North American region. With the presence of major companies and startups, the United States is gaining major industry attraction in the current market environment. Also, these companies have been developing innovative technologies for ocean-based carbon removal recently. Thus, these key players are anticipated to gain first-move advantage during the forecast period in the market as per observation reports.
 The Asia Pacific is expected to grow at the fastest pace in the coming period. The region includes heavy industries, policy support, and heavy carbon emissions in the present period. Countries like India, China, and Japan have enlarged industrial sectors, and these industries are seen in cutting off maximum carbon emissions in the recent period, which is anticipated to increase market potential in these countries in the future. Also, the countries are collaborating with innovative technologies for the green environment initiatives in the current period. These partnerships are projected to lead the carbon dioxide removal market growth in the coming years.
China’s Strategic Shift Toward Carbon Removal: Government Initiatives and Industrial Investments Driving Market Growth
China is expected to play a crucial role in the development of the carbon dioxide removal market during the forecast period, as China is currently considered the world's largest carbon emitter. Thus, the government in China is actively promoting the low carbon emission proposals to the heavy industries. Also, the large investments towards carbon capture and storage are anticipated to gain major industry share in the coming years in China.
- Moreover, programs like the three north shelterbelt programs and others will influence individuals to shift toward the minimization of carbon emissions in the future.
Carbon Dioxide Removal Market Share, By Regional, 2025 (%)
| Regional | Revenue Share, 2025 (%) |
| North America | 35.00% |
| Europe | 30.00% |
| Asia Pacific | 20.00% |
| Latin America | 7.00% |
| Middle East & Africa | 8.00% |
Europe Carbon Dioxide Removal Market Growth Trends
Europe Market is evolving into a regulatory-driven innovation and emphasizing permanent storage. Europe uses the Carbon Removal Certification Framework to set standards for quality and duration. As a regional technological shift for removals like direct air capture and bioenergy with carbon capture, it is supported by significant investment and funding. Additionally, the Net-Zero Industry Act introduces emissions trading by ensuring long-term market stability and growth.
 Germany Carbon Dioxide Removal Market Growth Trends
Germany’s market is driven by the conversion of research-focused to a commercial transformation, promoted by federal funding aimed at atmospheric cleaning. Their domestic financing framework and legal reforms offer large-scale storage and CO2 pipelines. The balances innovations with ecological projects that position them as Europe’s carbon management hub, where certified negative emissions are dynamic for reaching climate neutrality.
Recent Developments
Aramco
- Unit Launch: In 2025, Aramco established its first CO2 Direct Air Capture test unit in Saudi Arabia. The unit can remove 12 tons of carbon dioxide annually from the environment. For this development, Aramco created a partnership with Siemens Energy.
TDK Ventures
- Investment: In 2025, TDK Ventures planned to invest in Spiritus, which is a CO2 removal startup. The investment aims to support Spiritus’s direct air capture technology while minimizing its carbon
Morgan Stanely and Clime works
- Collaboration: In 2024, Morgan Stanley created a partnership with Climeworks. The collaboration aims to focus on removing 40,000 tons of carbon dioxide from the environment. Moreover, this partnership agreement is considered the second-largest agreement, which is expected to last until 2037.
Market Top Companies List
- Climeworks
- Global Thermostat
- Cella Mineral Storage Inc.
- Bussme Energy AB
- Carbofex Ltd.
- Neustark Ag
- Carbon Engineering Ltd.
- Arca
- Ebb Carbon
- CarbonCure Technologies Inc.
- CarbonFree
- Carbfix hf.
- HEIMDAL
- Oregon Biochar Solutions
- Wakefield BioChar
- Novocarbo GmbH
- Carbicrete
- Blue Planet Systems
- Pacific Biochar Benefit
- Charm Industrial
Segment covered in the report
By Product
- Biochar
- Direct Air Capture (DAC)
- Enhanced/Carbon Mineralization
- Ocean Alkalinization
- BECCS
- Microalgae
By Application
- Technology Sector
- Finance Sector
By Regional
- North America
- U.S.
- Canada
- Mexico
- Europe
- UK
- Germany
- France
- Italy
- Spain
- Sweden
- Denmark
- Norway
- Asia Pacific
- Japan
- China
- India
- Australia
- South Korea
- Thailand
- Latin America
- Brazil
- Argentina
- The Middle East and Africa
- South Africa
- Saudi Arabia
- UAE
- Kuwait
A Seven-Phase Framework
Our methodology is designed to be universally applicable across commodity chemicals, specialty chemicals, petrochemicals, construction chemicals, coatings, electronic chemicals, industrial gases, agrochemicals, water treatment chemicals, and performance materials. Each phase builds upon the last, creating a layered validation structure that minimizes estimation error and maximizes analytical confidence.
The framework ensures comprehensive market coverage, robust cross-validation, and reliable long-term forecasting — producing market estimates that withstand scrutiny from investors, regulators, and corporate strategy teams.

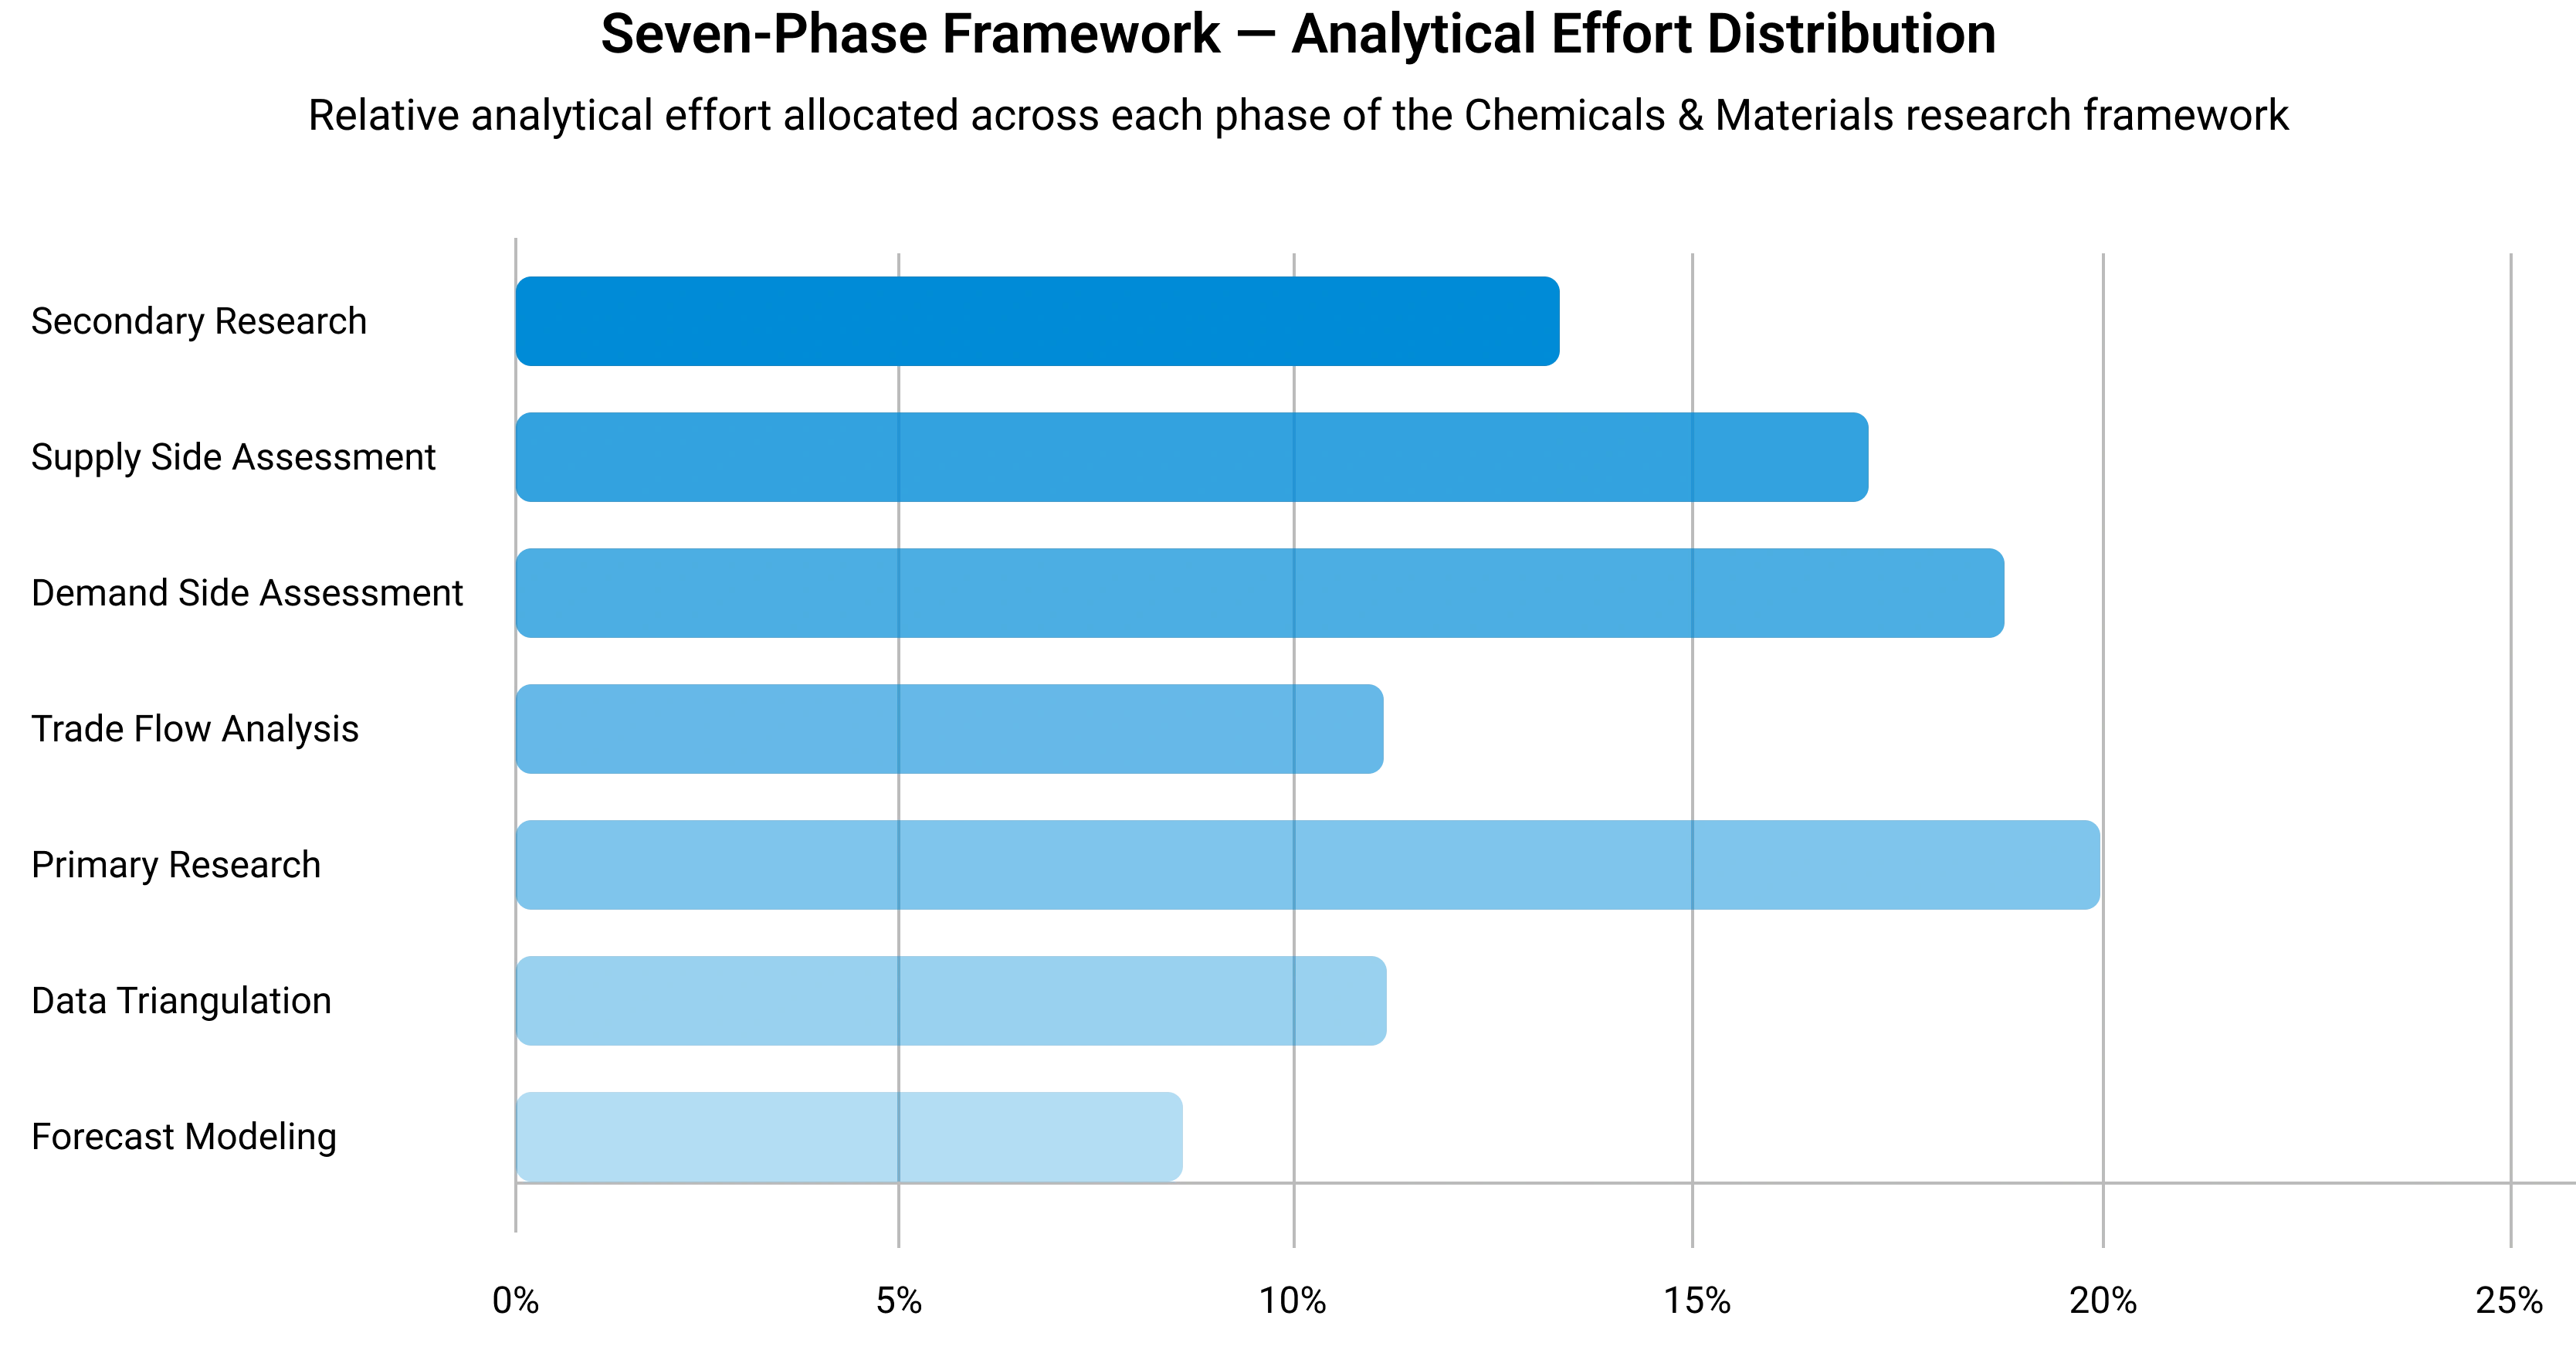
Seven-Phase Framework — Analytical Effort Distribution
Relative analytical effort allocated across each phase of the Chemicals & Materials research framework
Phase 1 - Secondary Research: Establishing the Foundation
Secondary research collects and evaluates publicly available information from authoritative sources, establishing the foundational understanding of market structure, value chain dynamics, competitive landscape, and end-use demand patterns. Every source is evaluated for credibility, recency, geographic relevance, and methodological soundness before inclusion.
Industry Associations
Sources include ACC, CEFIC, ICCA, JCIA, CPCIF, and SOCMA providing production volumes, consumption trends, capacity developments, and sustainability initiatives.
Company Disclosures
Annual reports, investor presentations, earnings transcripts, and regulatory filings reveal product portfolios, manufacturing footprints, capacity expansions, and revenue segmentation.
Government Databases
National statistical offices, customs authorities, environmental agencies, and industrial production databases provide verified statistics on output, trade flows, and regulatory compliance.
Trade Databases
UN Comtrade, ITC, Eurostat, and national customs authorities enable assessment of global product movement, import dependency, and export competitiveness across regions.
Our Secondary Research Sources
- Ministry of Chemicals and Fertilizers
- European Chemicals Agency
- United States Department of Energy
- Ministry of Industry and Information Technology
- Ministry of Economy Trade and Industry
- Ministry of Trade Industry and Energy
- National Institute of Standards and Technology
- Council of Scientific and Industrial Research
- Fraunhofer Society
- National Institute for Materials Science
Phase 2 — Supply-Side Assessment: Mapping Production Capabilities
Production Capacity Analysis
All major manufacturers are assessed for existing installed capacity, planned additions, expansions, new plant announcements, and technology adoption — mapped at global, regional, and country levels.
Capacity Utilization Adjustment
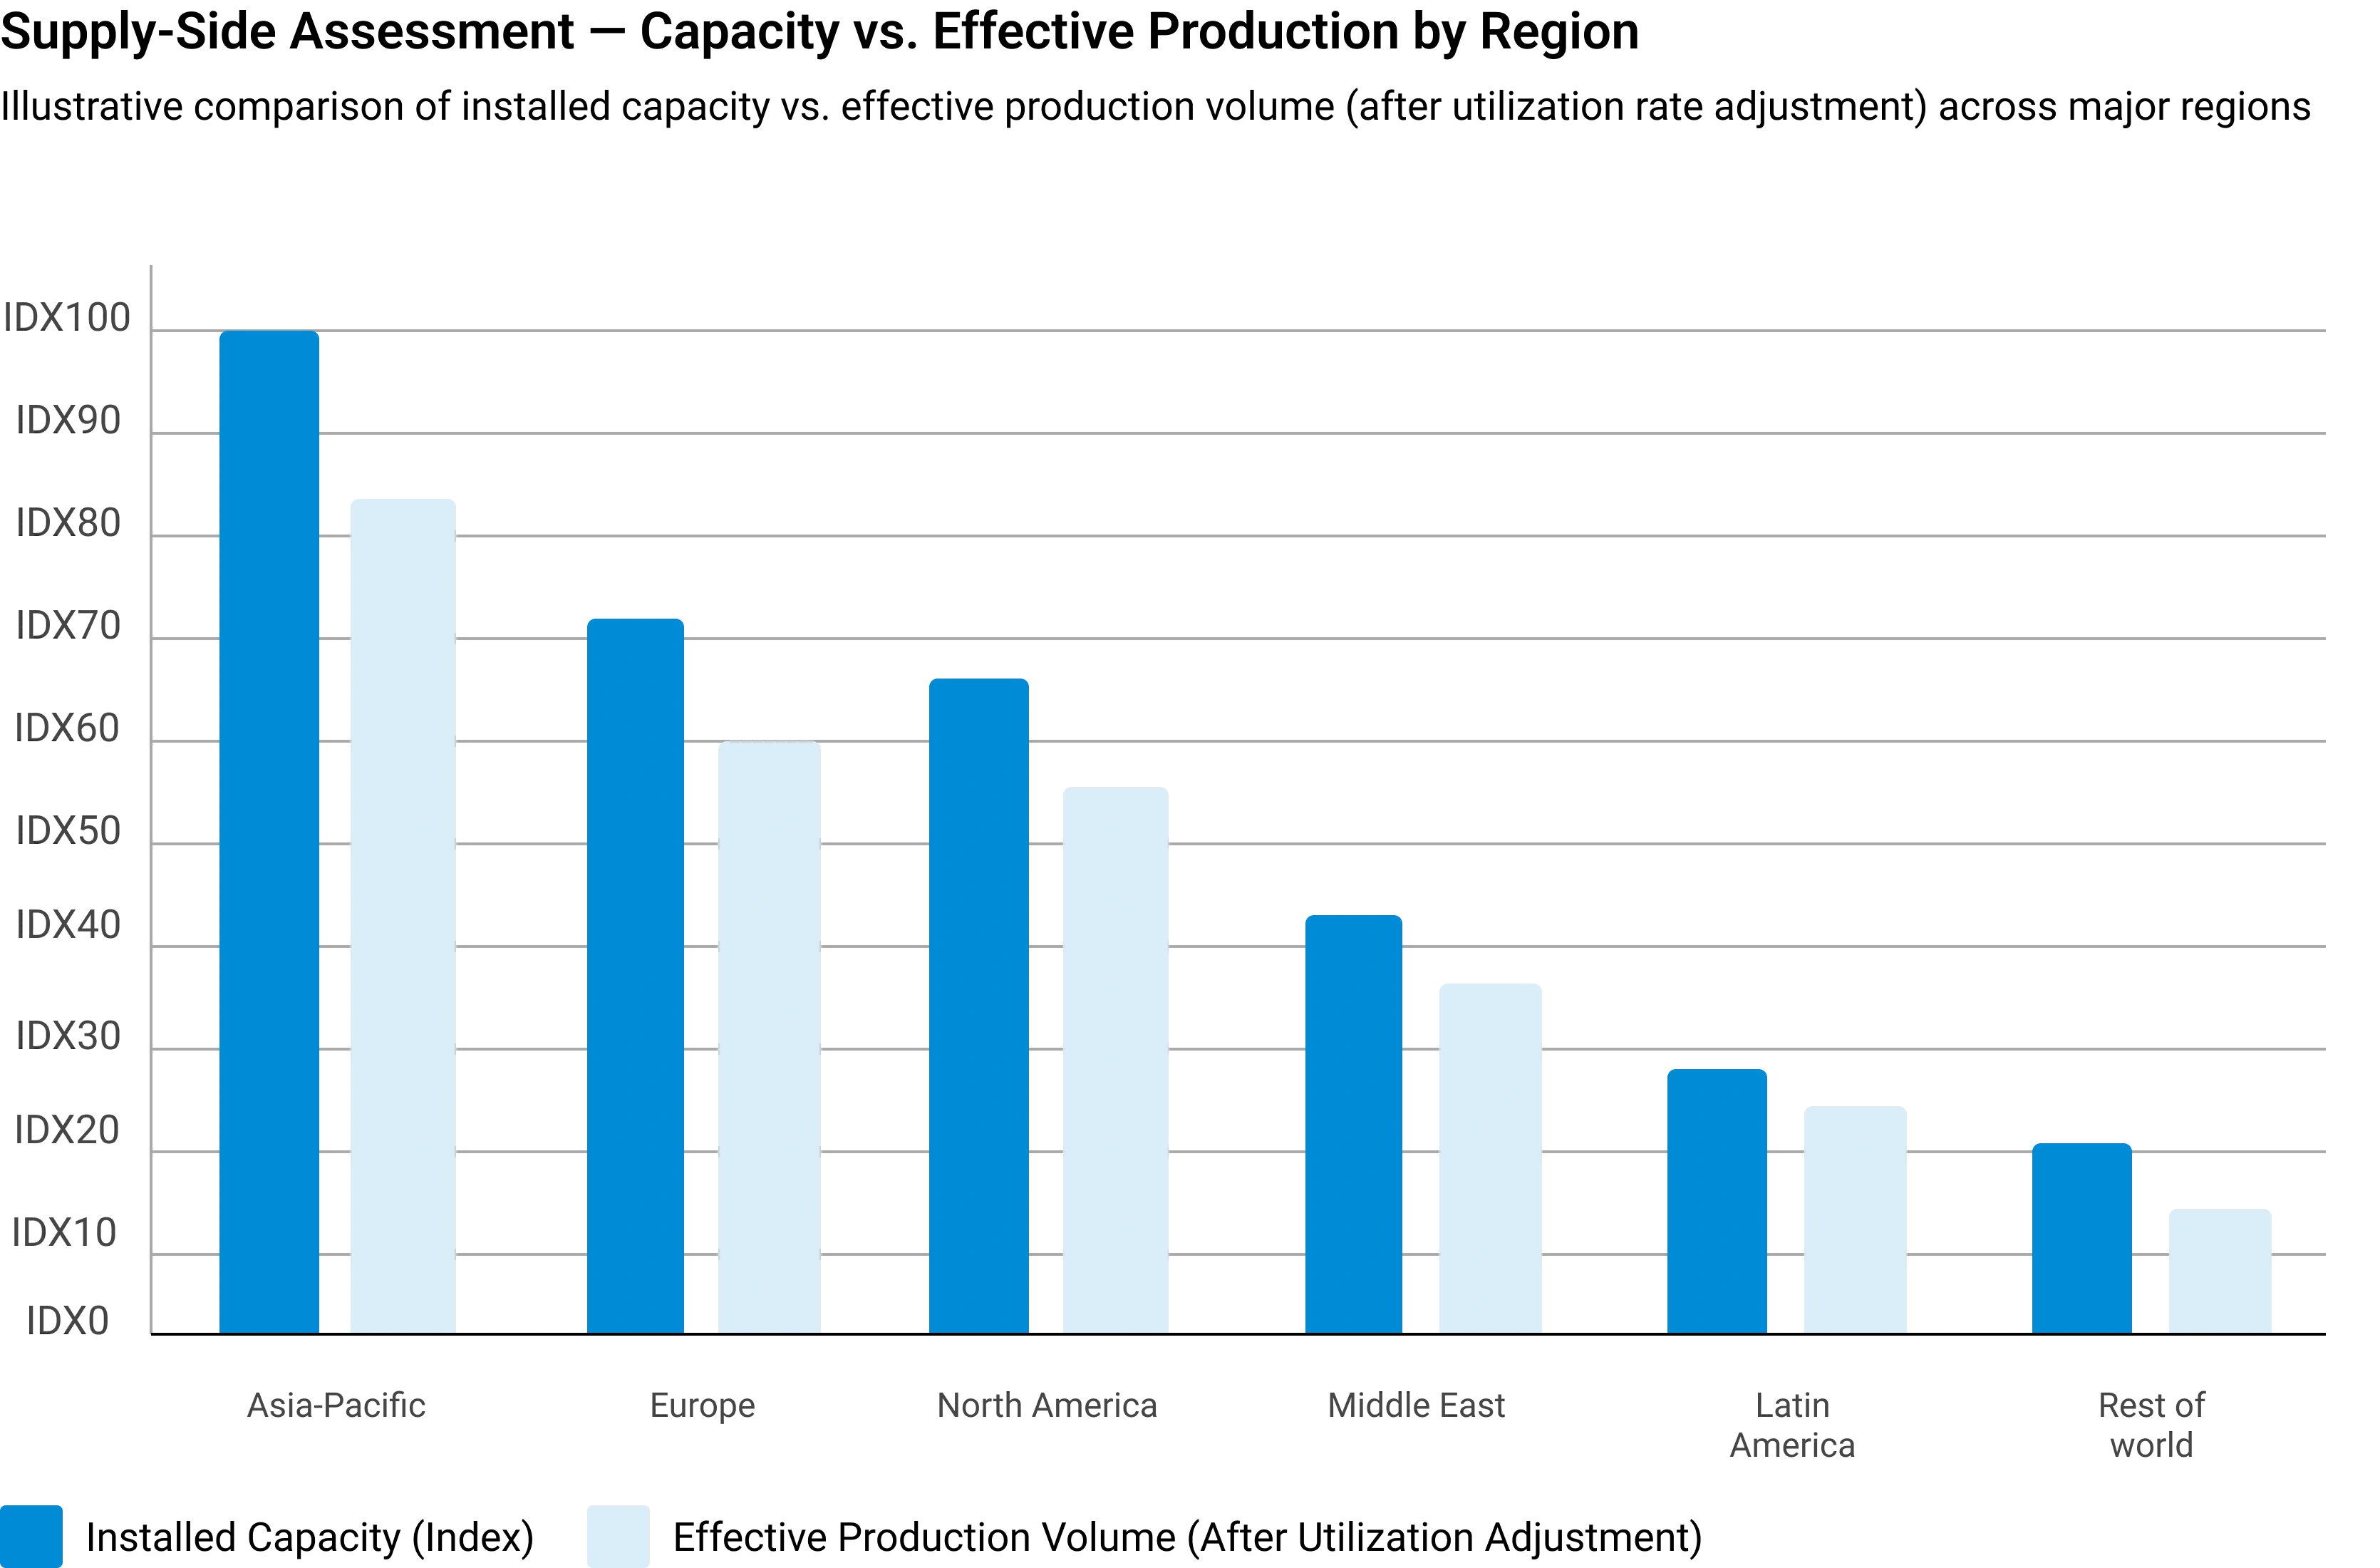
Installed capacity is adjusted using utilization rates based on demand conditions, feedstock availability, plant operating rates, maintenance schedules, and regulatory restrictions.
Manufacturer Revenue Analysis
Product-specific revenues, segment-level performance, regional distribution, average selling prices, and margin trends are evaluated to establish market value estimates.
Supply-Side Assessment — Capacity vs. Effective Production by Region
Illustrative comparison of installed capacity vs. effective production volume (after utilization rate adjustment) across major regions
Phase 3 — Demand-Side Assessment: Quantifying Chemical Consumption
Demand-side analysis quantifies chemical consumption across industries, applications, and geographies — identifying where and how chemicals are consumed throughout the value chain with precision.
End-Use Industry Analysis
Chemical demand is evaluated across automotive, construction, packaging, electronics, agriculture, healthcare, consumer goods, industrial manufacturing, energy and utilities, and water treatment. Industry output, production trends, and consumption intensity are analyzed to determine demand patterns.
Consumption Modeling
Demand is estimated using measurable indicators: kilograms per vehicle, kilograms per square meter of construction, dosage per cubic meter of water treated, kilograms per hectare of agricultural land, and kilograms per ton of manufactured products. Consumption factors are validated through industry publications and primary interviews.
Application Analysis
The market is segmented by application area to understand product performance requirements, formulation trends, technology adoption, customer preferences, and regulatory requirements improving demand accuracy and segmentation granularity.
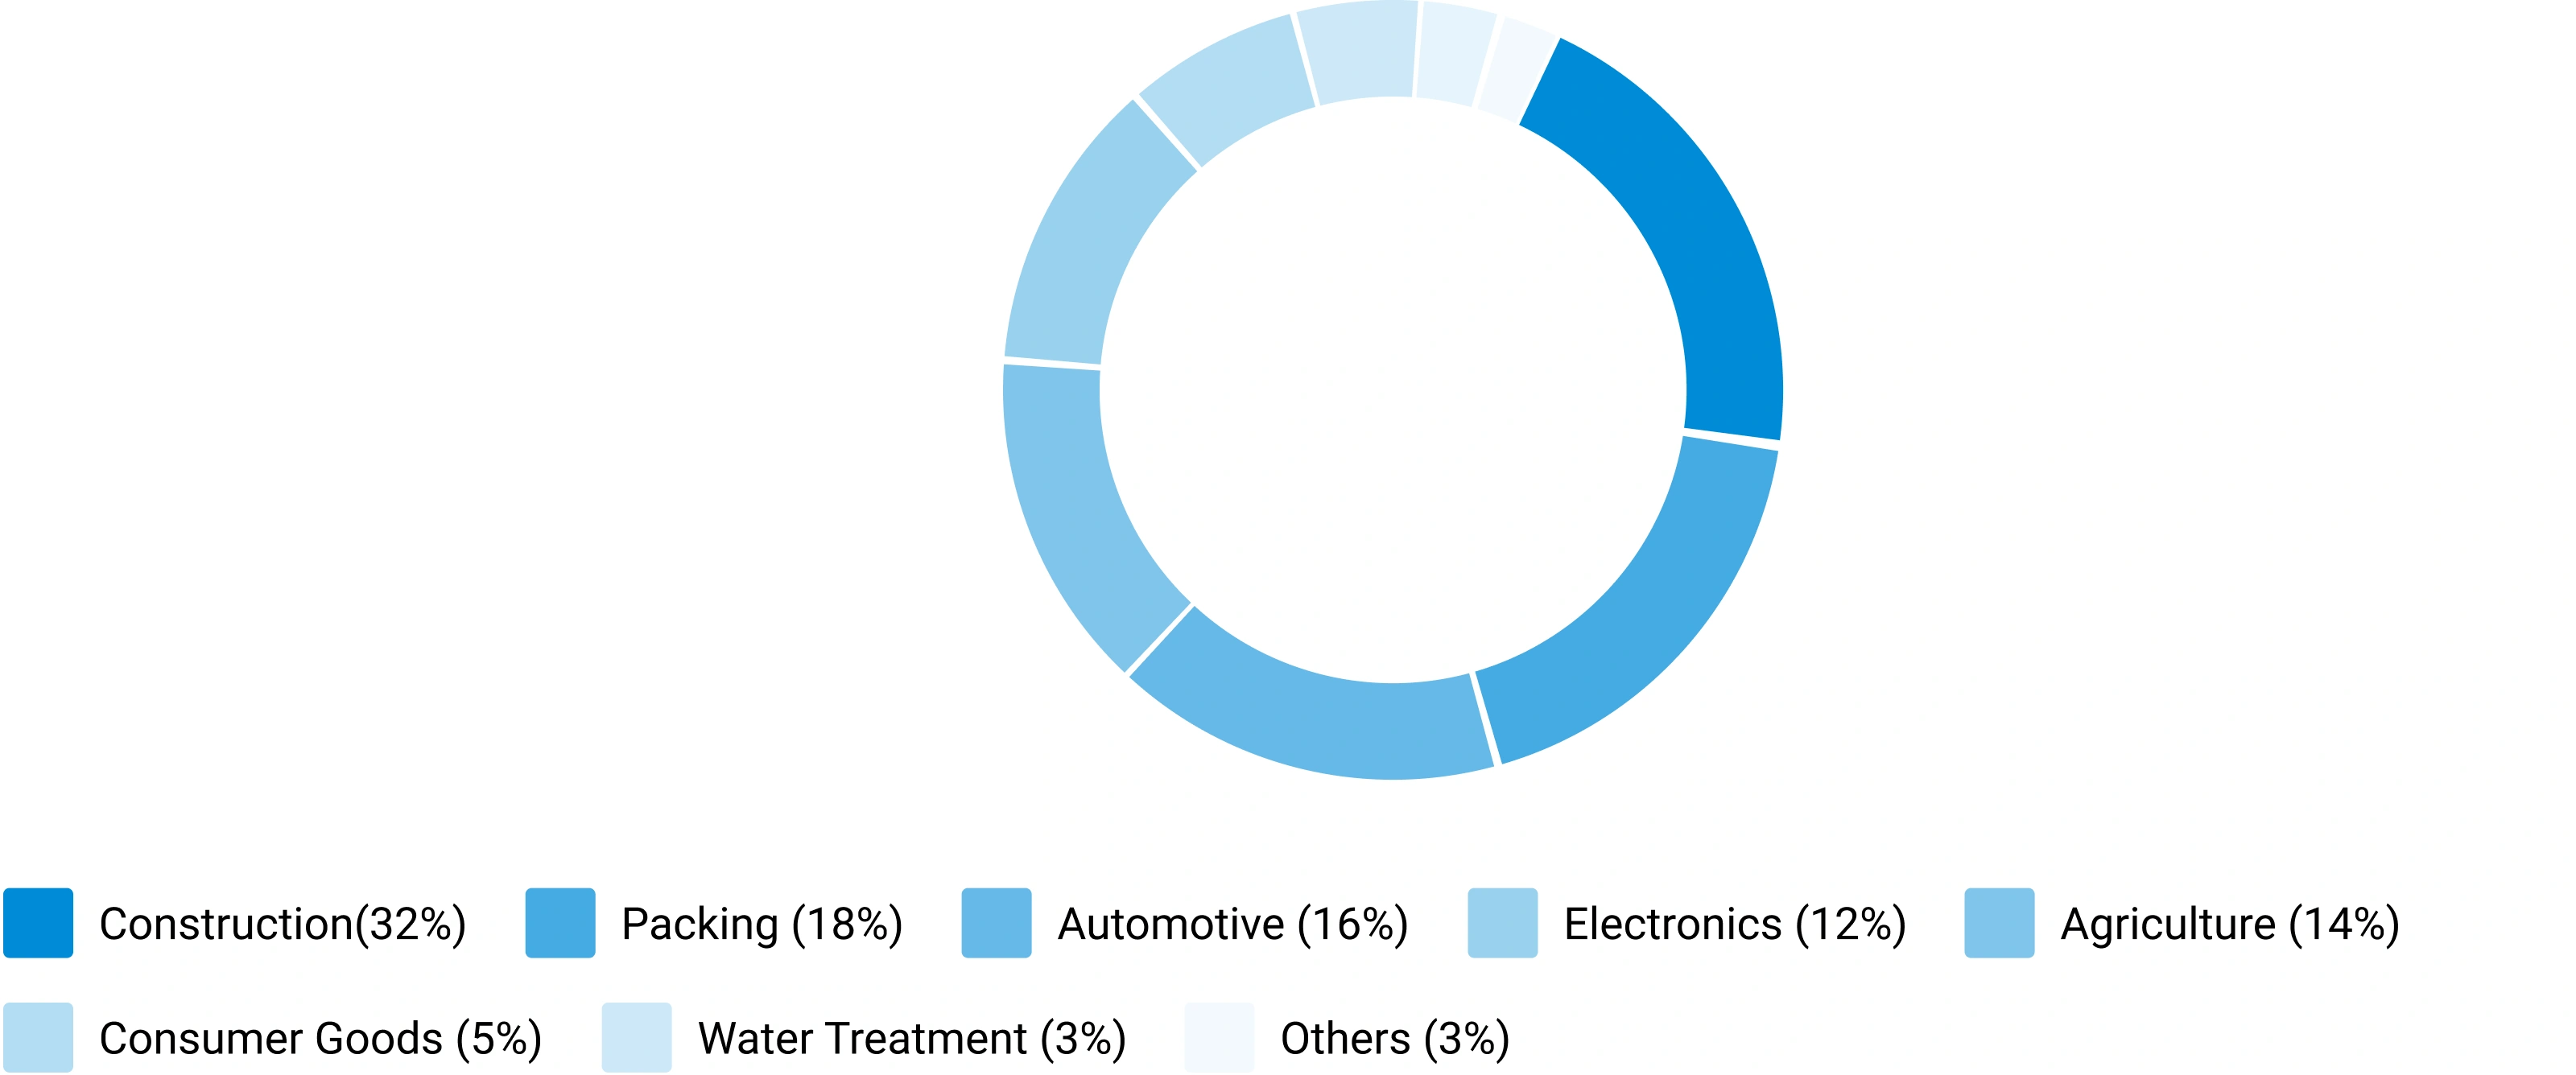
Demand-Side Assessment — End-Use Industry Demand Distribution
Illustrative distribution of chemical & materials demand across key end-use industries
Phase 4 - Trade Flow Analysis: Balancing Regional Supply and Demand
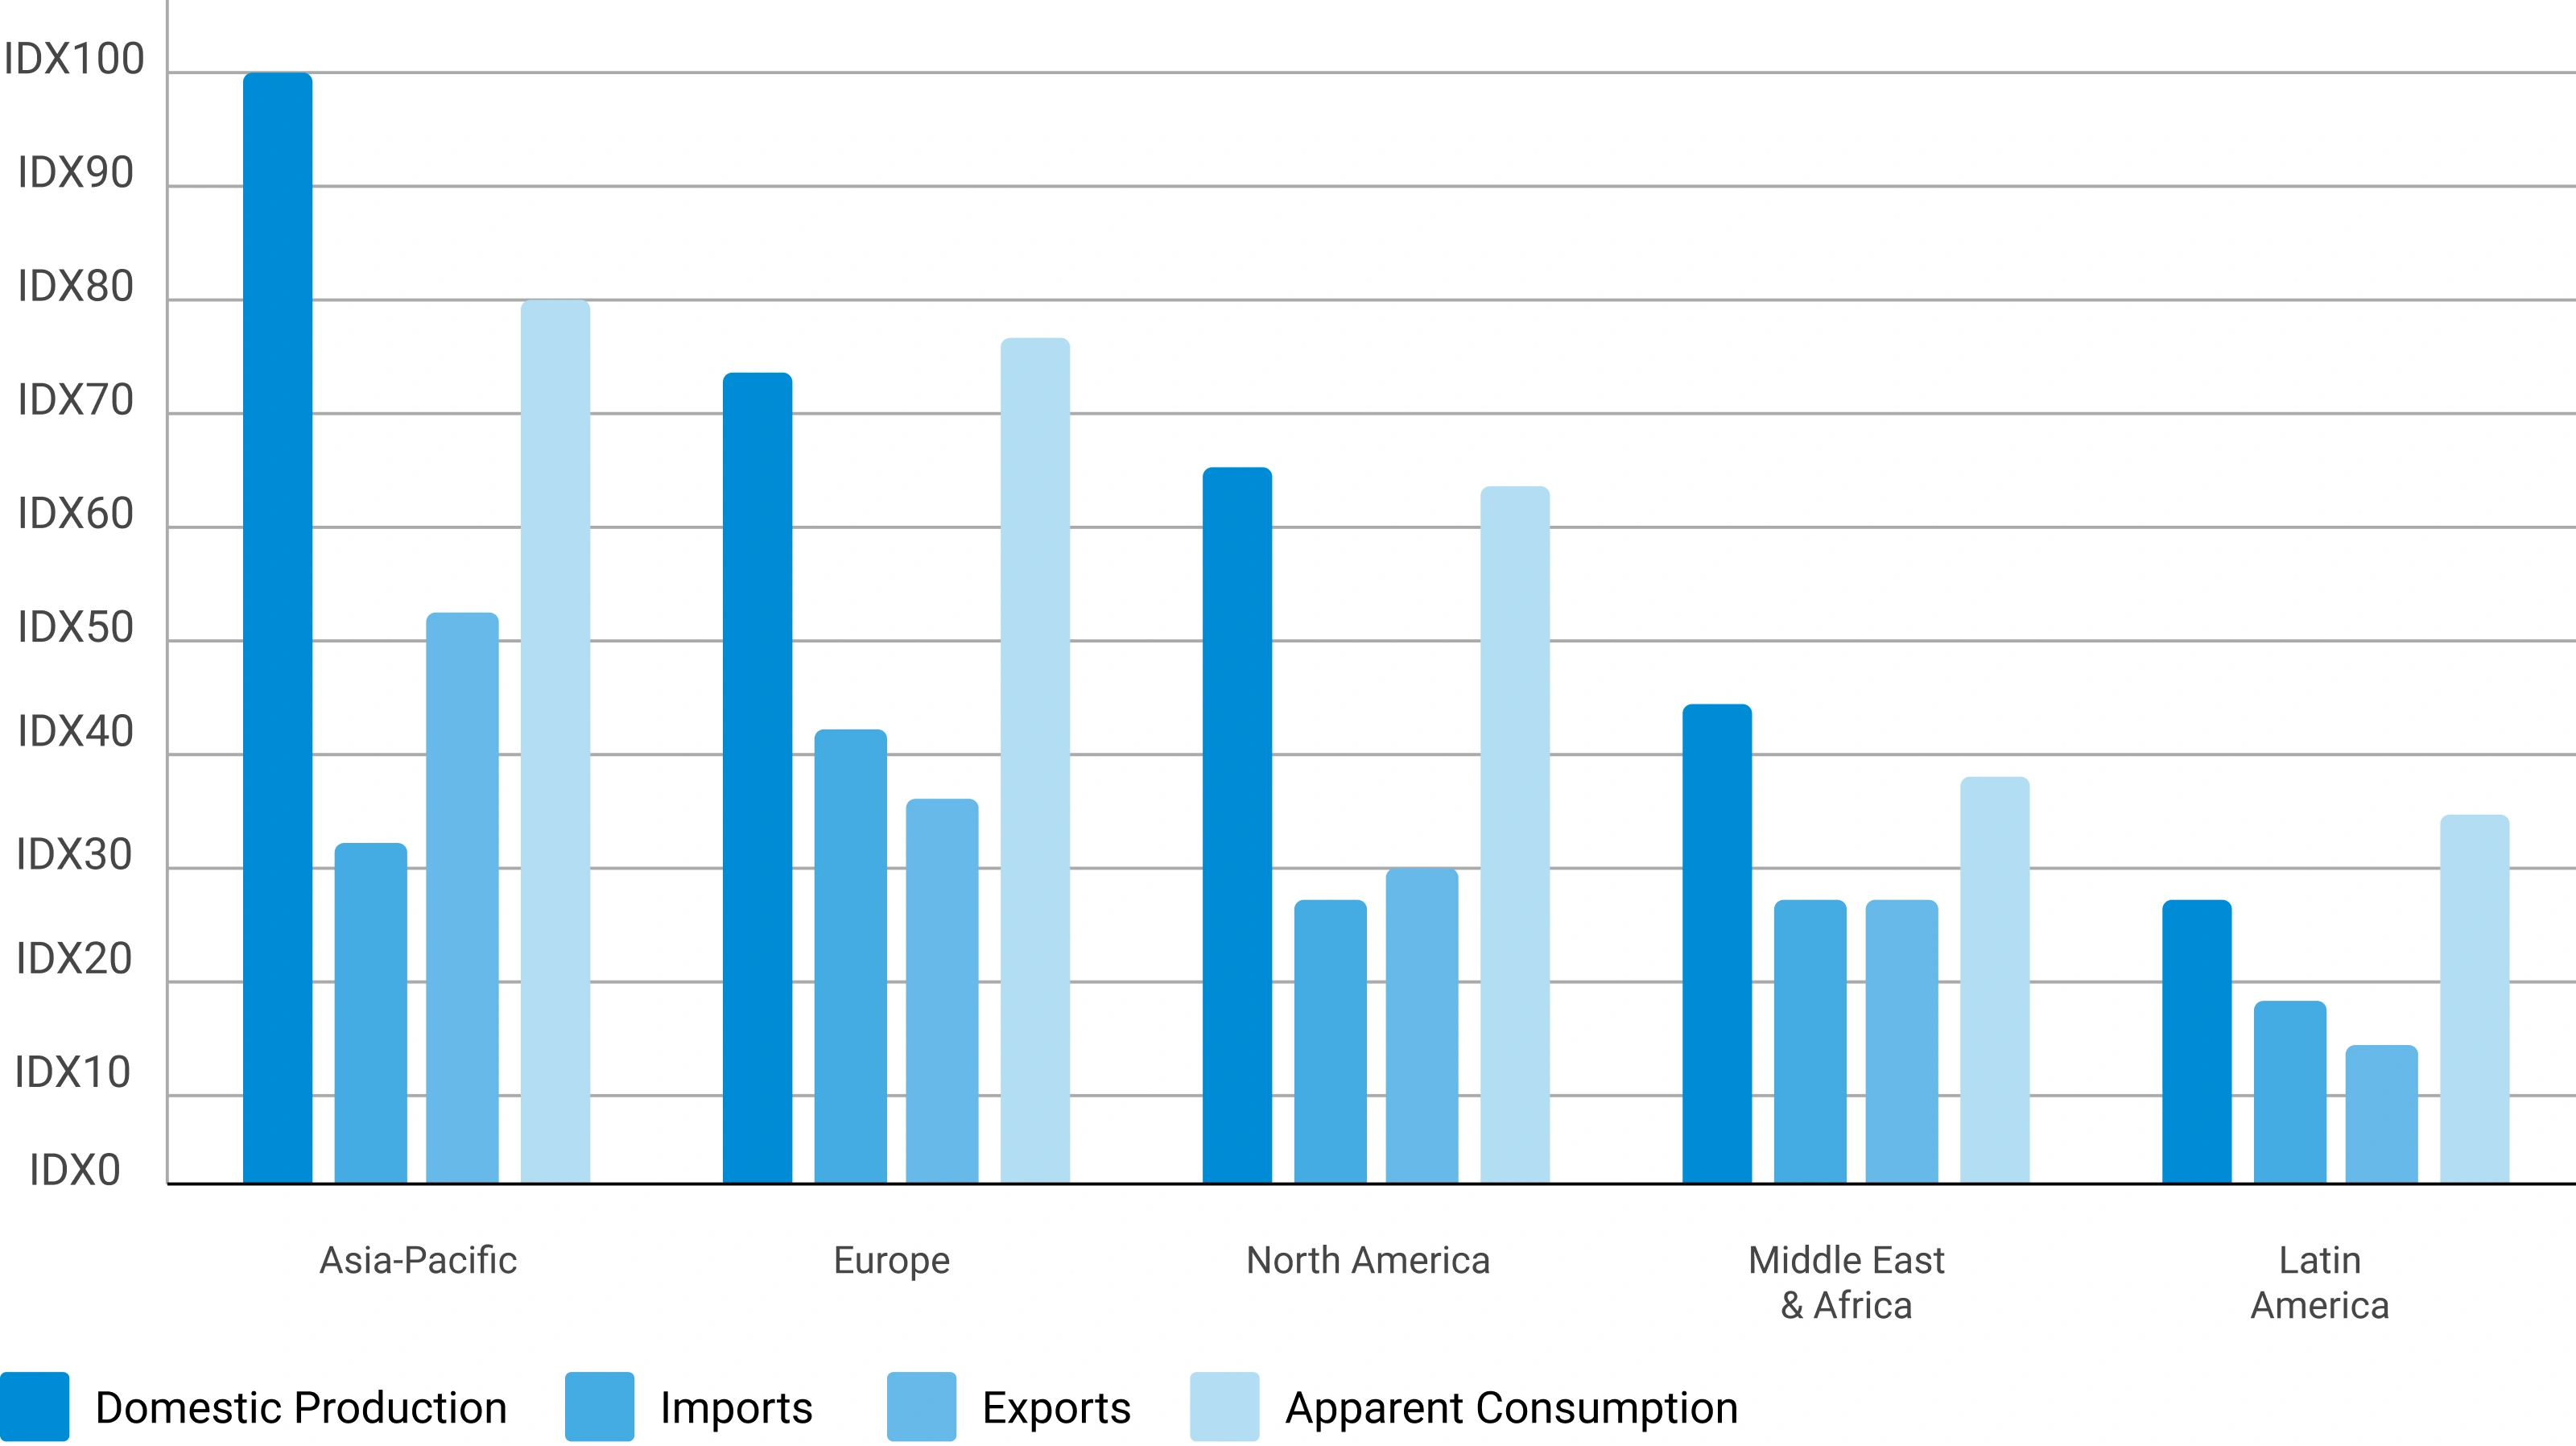
Trade flow analysis reconciles regional supply and demand estimates through import and export data, identifying net supply positions, regional dependencies, and market imbalances. It serves as an independent validation layer that tests the consistency of supply-side and demand-side estimates.
Import Analysis
Import data is evaluated to determine volumes, source countries, product dependency, regional supply gaps, and pricing trends — identifying markets that rely heavily on external supply and where domestic production is insufficient to meet demand.
Export Analysis
Export assessments reveal production surplus, export competitiveness, regional manufacturing strength, and global market participation. Export patterns also help validate domestic production estimates and identify net exporting regions.
Apparent Consumption Model
Regional consumption is assessed using the standard apparent consumption formula:
Results identify net importing regions, net exporting regions, regional deficits, and surpluses — serving as an independent validation of supply and demand estimates.
Trade Flow Analysis — Net Supply Position by Region
Illustrative apparent consumption vs. domestic production across major regions — positive gap indicates net import dependency
Phase 5 — Primary Research: The Critical Validation Layer
Primary research tests and refines findings from secondary research through direct engagement with industry participants across the supply chain, demand side, and expert community. It captures intelligence that no database or published report can provide — the real-world experience of manufacturers, buyers, and specialists operating in the market.

Supply-Side Interviews
Conversations with chemical manufacturers, raw material suppliers, contract manufacturers, technology providers, and plant operators cover production trends, capacity utilization, pricing developments, technology shifts, and competitive dynamics.

Demand-Side Interviews
Engagement with OEMs, industrial consumers, procurement managers, distributors, formulators, and end-use manufacturers focuses on consumption trends, purchasing behavior, product substitution, demand outlook, and emerging applications.

Industry Expert Consultations
Additional interviews with industry consultants, independent experts, regulatory specialists, technical professionals, and research institutions provide deeper market context and validate key analytical assumptions.
Focus Areas of Primary Research:
Market Size & Forecast Validation
Revenue estimates, volume consumption, growth rates, forecast assumptions, regional demand.Supply Chain & Value Chain Assessment
Raw material sourcing, supply chain challenges, distribution networks, procurement practices.Production & Capacity Analysis
Manufacturing capacity, utilization rates, expansion projects, plant investments.Pricing & Cost Structure Analysis
Product pricing trends, feedstock costs, energy costs, margin pressures, pricing outlook.Competitive Landscape Assessment
Volume and value estimates confirmed to be fully consistent with one another before publicationInterview Volume by Market Scope
| Study Scope | Number of Interviews |
|---|---|
| Niche Market | 20 – 30 |
| Mid-Sized Market | 30 – 50 |
| Global Market | 50 – 80 |
| Highly Fragmented Market | 80 – 120 |
Interview Details:
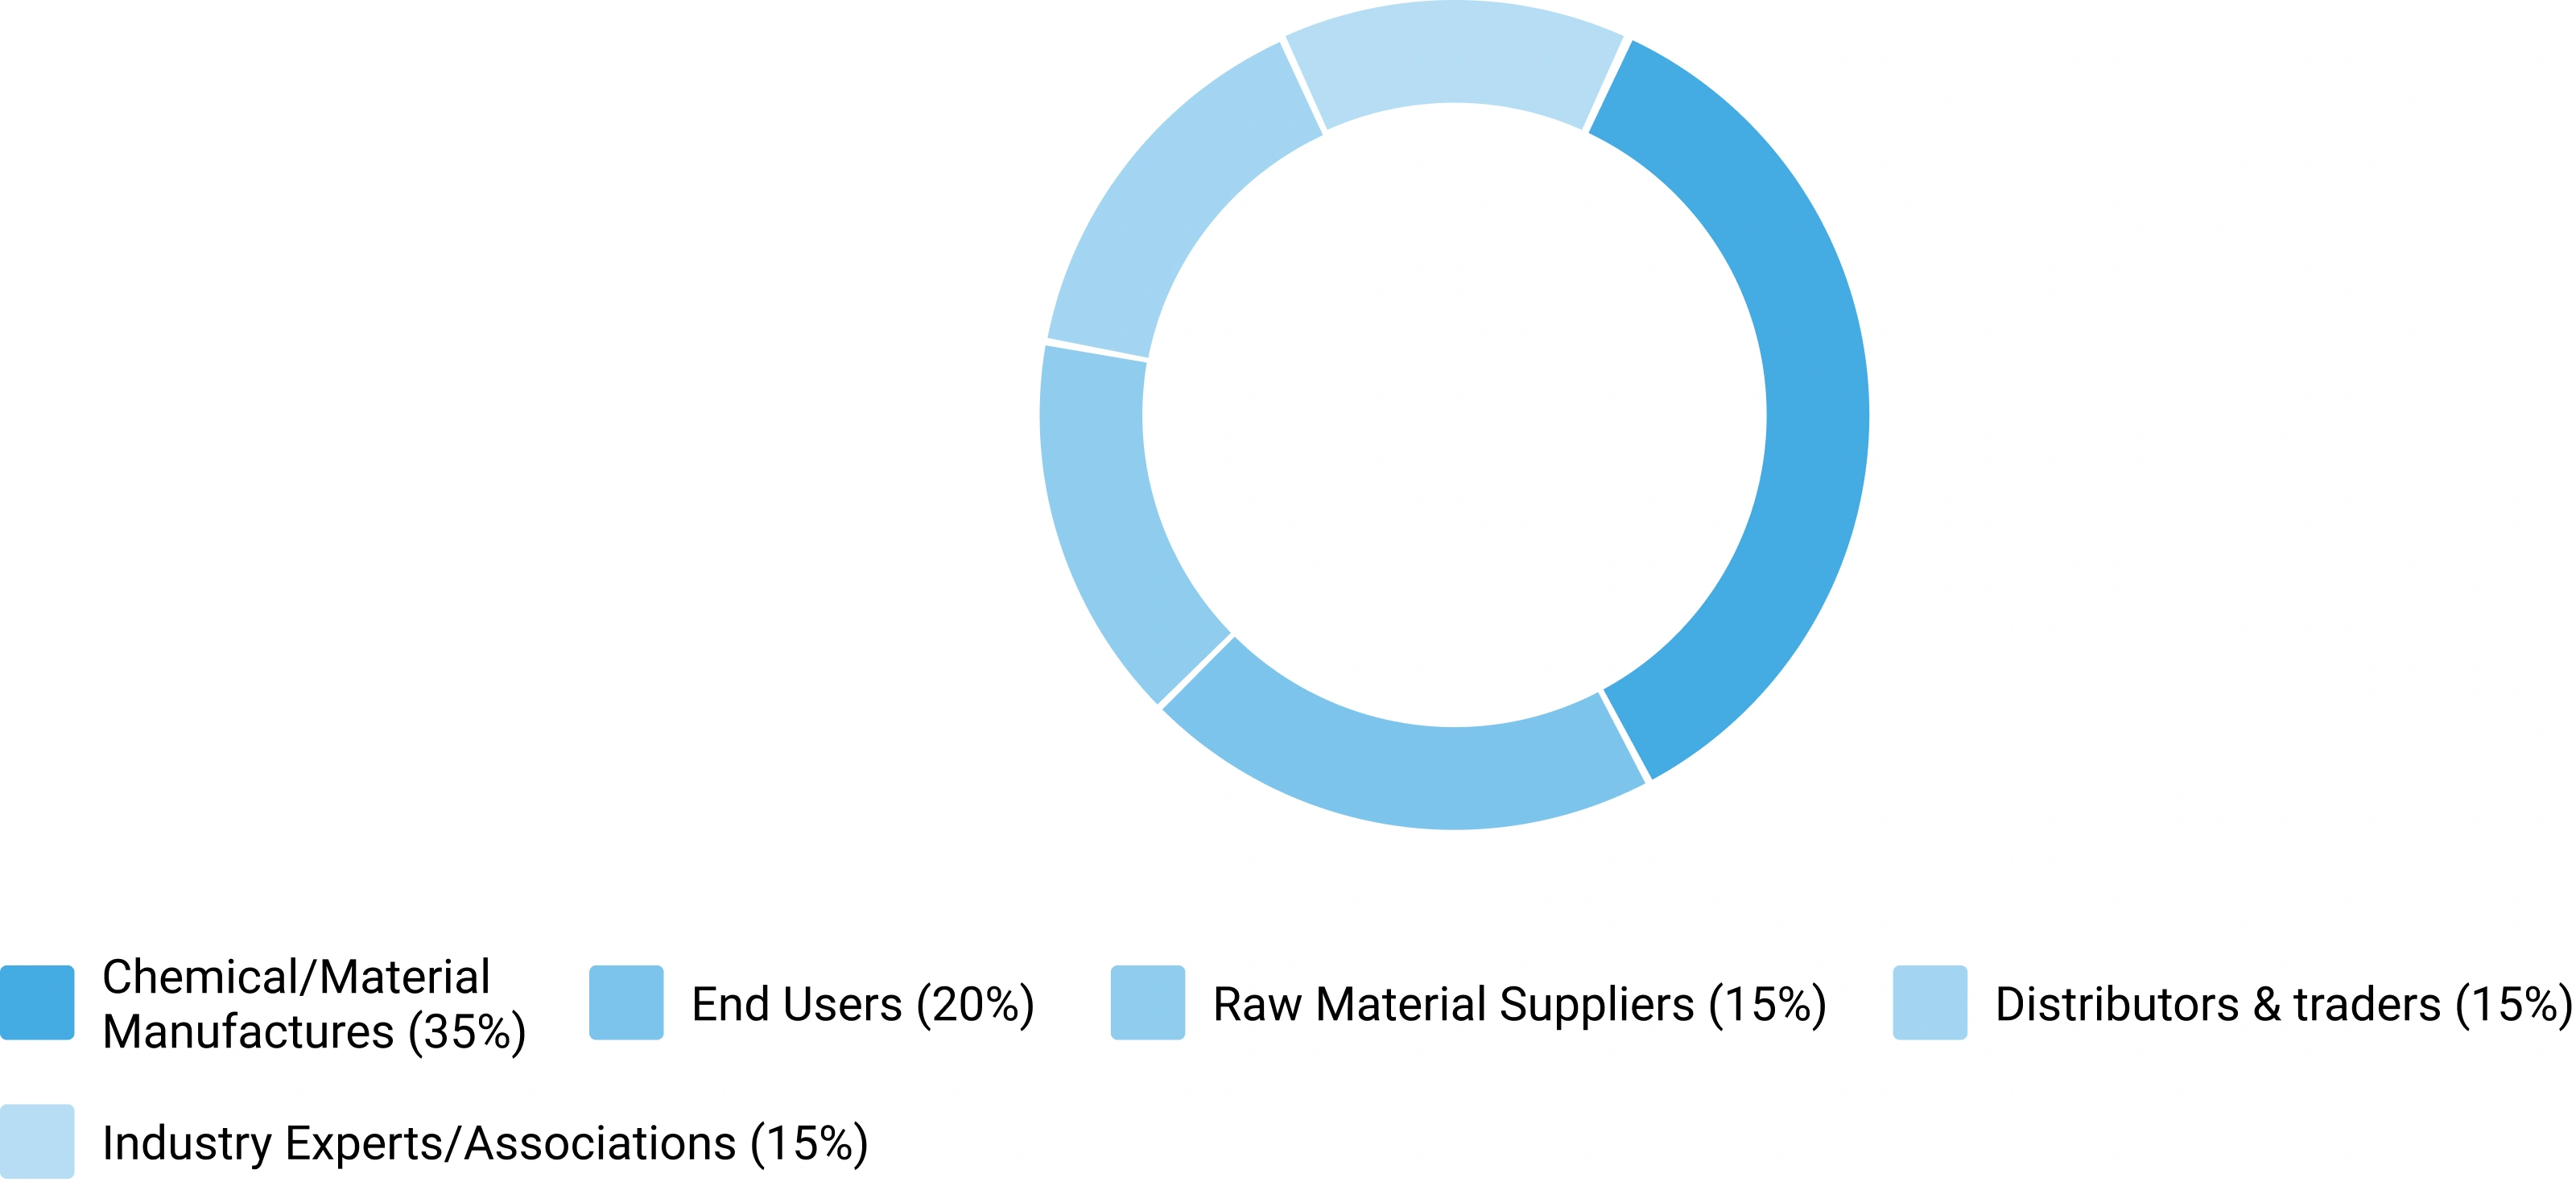
Category : Manufacturers, Suppliers, Distributors, End Users, Experts/Associations
Average Duration : 30–60 Minutes
Interview Mode : Video calls, telephonic interviews, expert consultations
Interview Format : Structured / Semi-Structured questionnaire
Focus Areas of Primary Research:
Market Size & Forecast Validation :
Revenue estimates, volume consumption, growth rates, forecast assumptions, regional demand.
Supply Chain & Value Chain Assessment :
Raw material sourcing, supply chain challenges, distribution networks, procurement practices.
Production & Capacity Analysis :
Manufacturing capacity, utilization rates, expansion projects, plant investments.
Pricing & Cost Structure Analysis :
Product pricing trends, feedstock costs, energy costs, margin pressures, pricing outlook.
Competitive Landscape Assessment :
Market share, competitor positioning, strategic initiatives, partnerships, acquisitions.
Primary Research — Stakeholder Coverage by Category
Distribution of interview respondents across stakeholder categories (% share from PPT data)
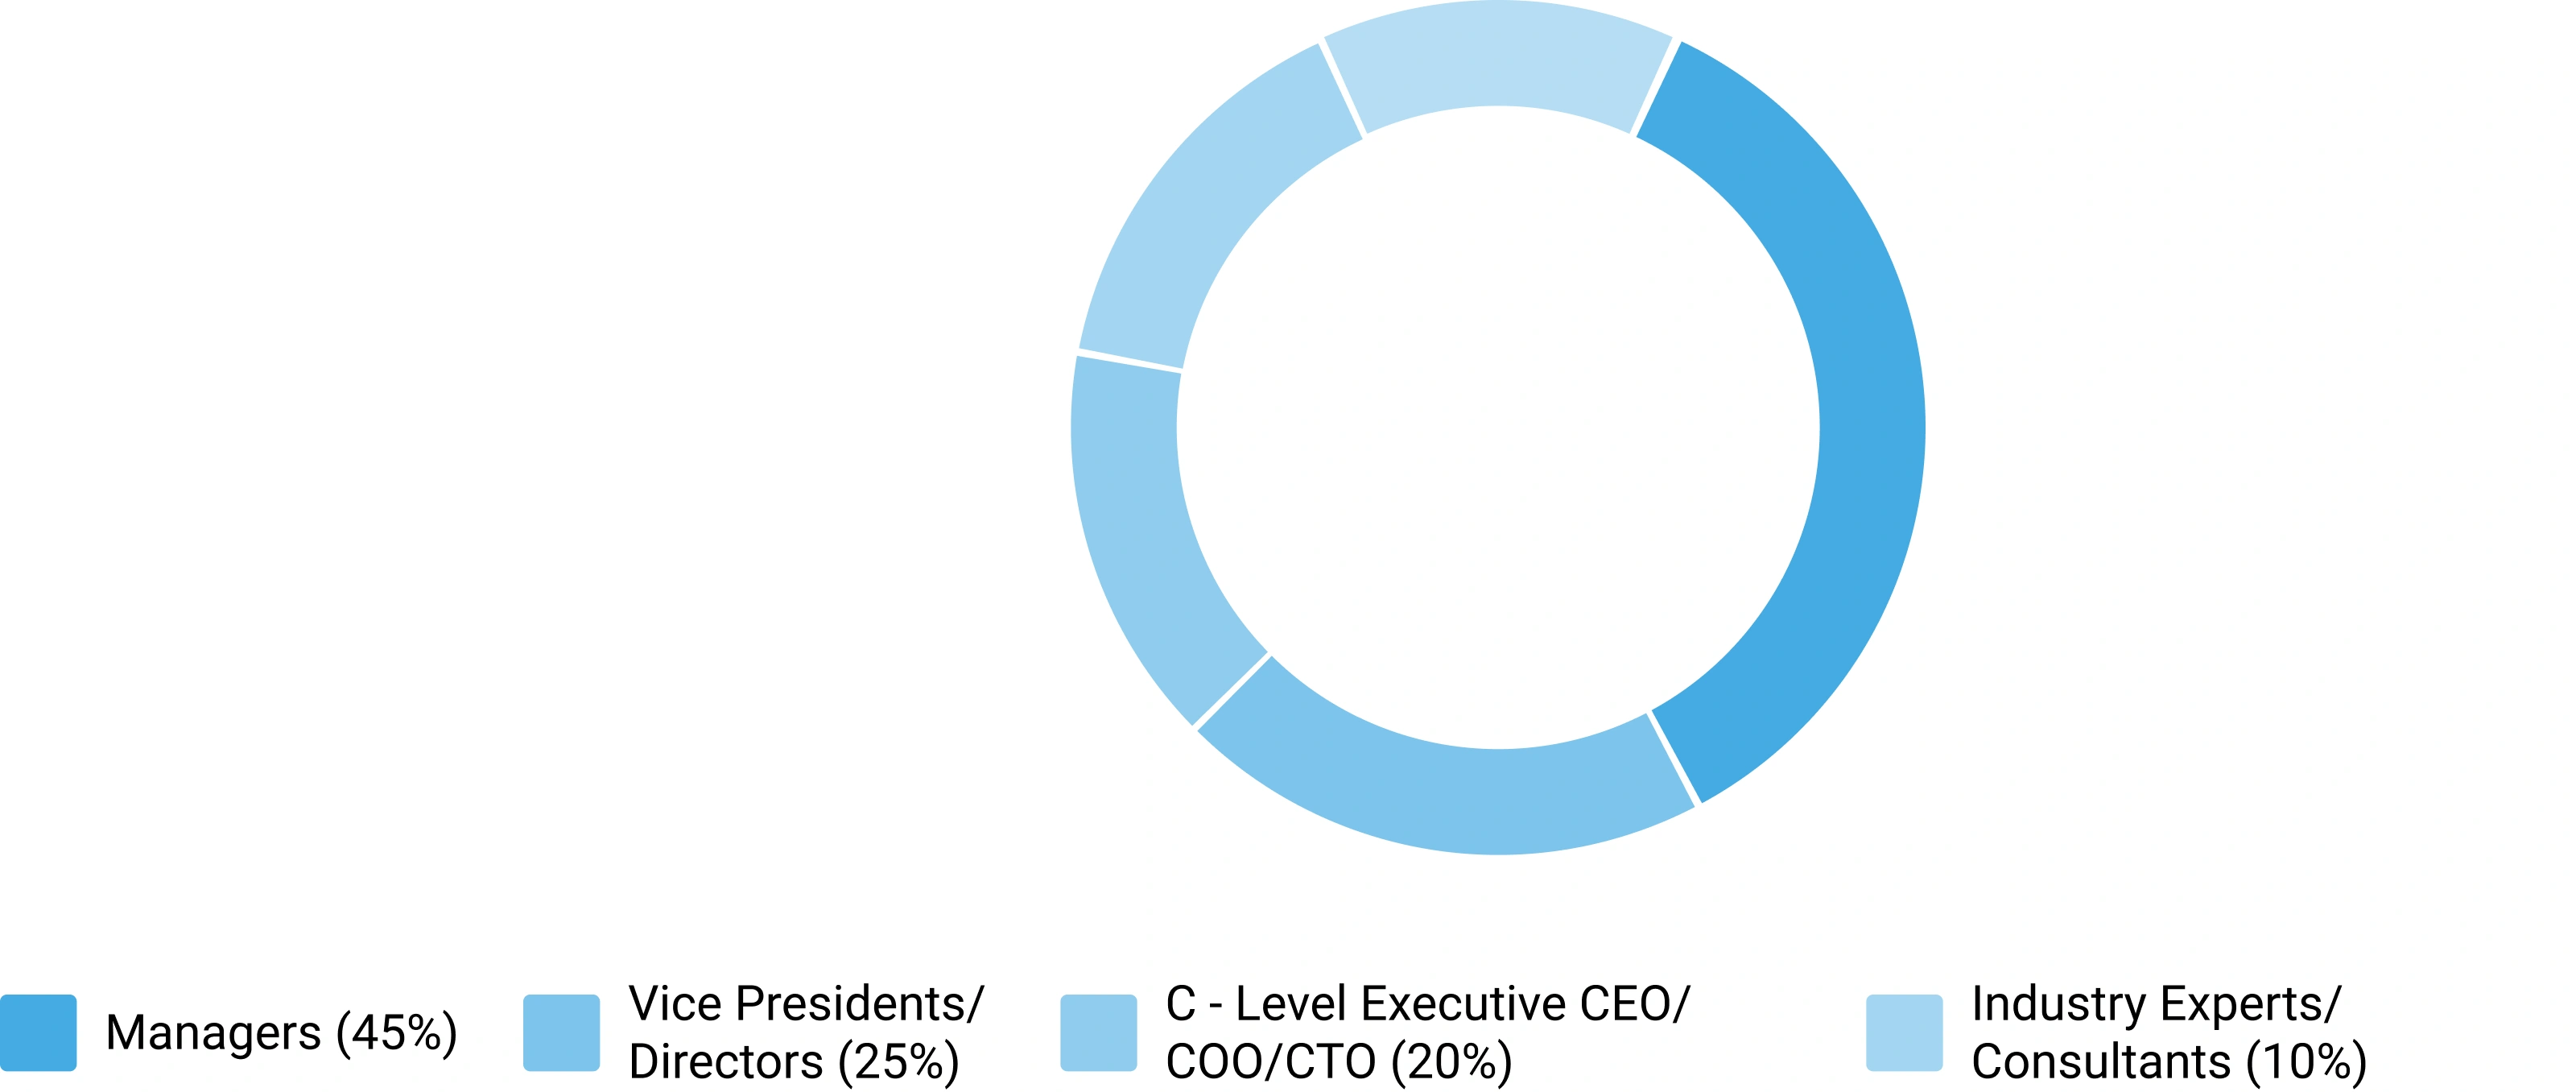
Primary Research — Respondent Designation Profile
Seniority breakdown of interview respondents (% share from PPT data)
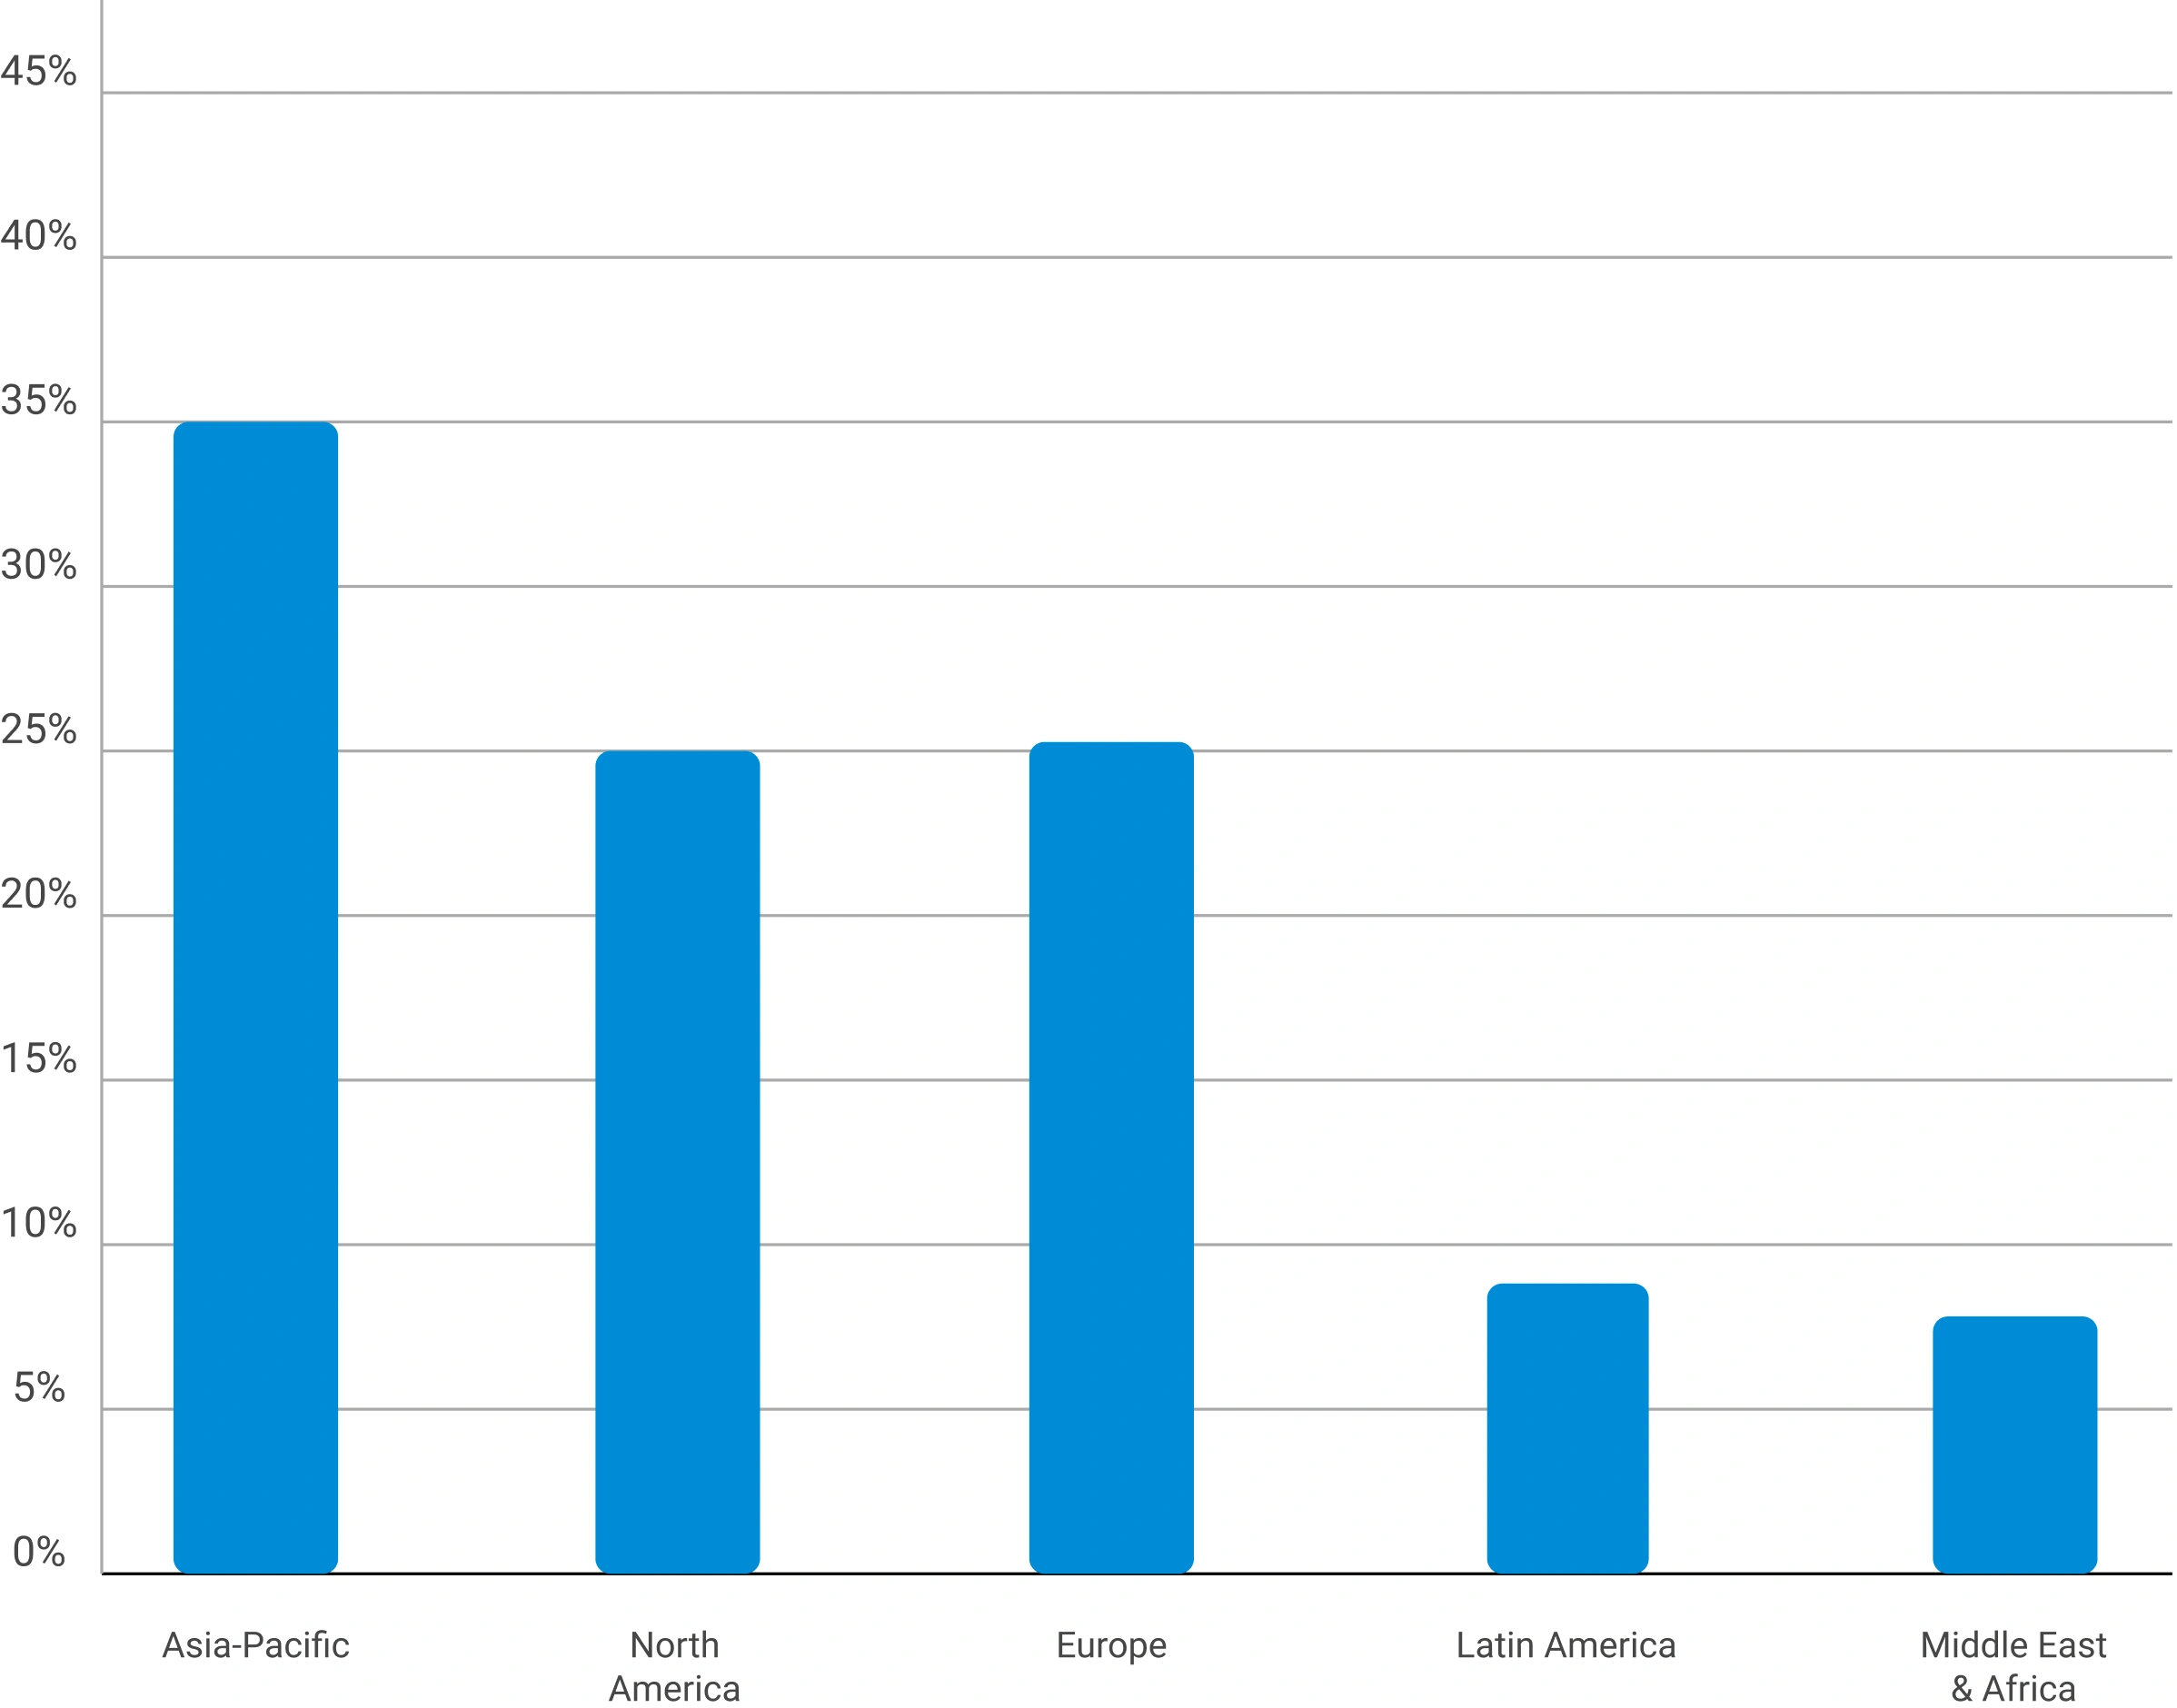
Primary Research — Geographic Coverage of Interviews
Regional distribution of primary research engagement (% share from PPT data)
Phase 6 — Data Triangulation and Market Validation
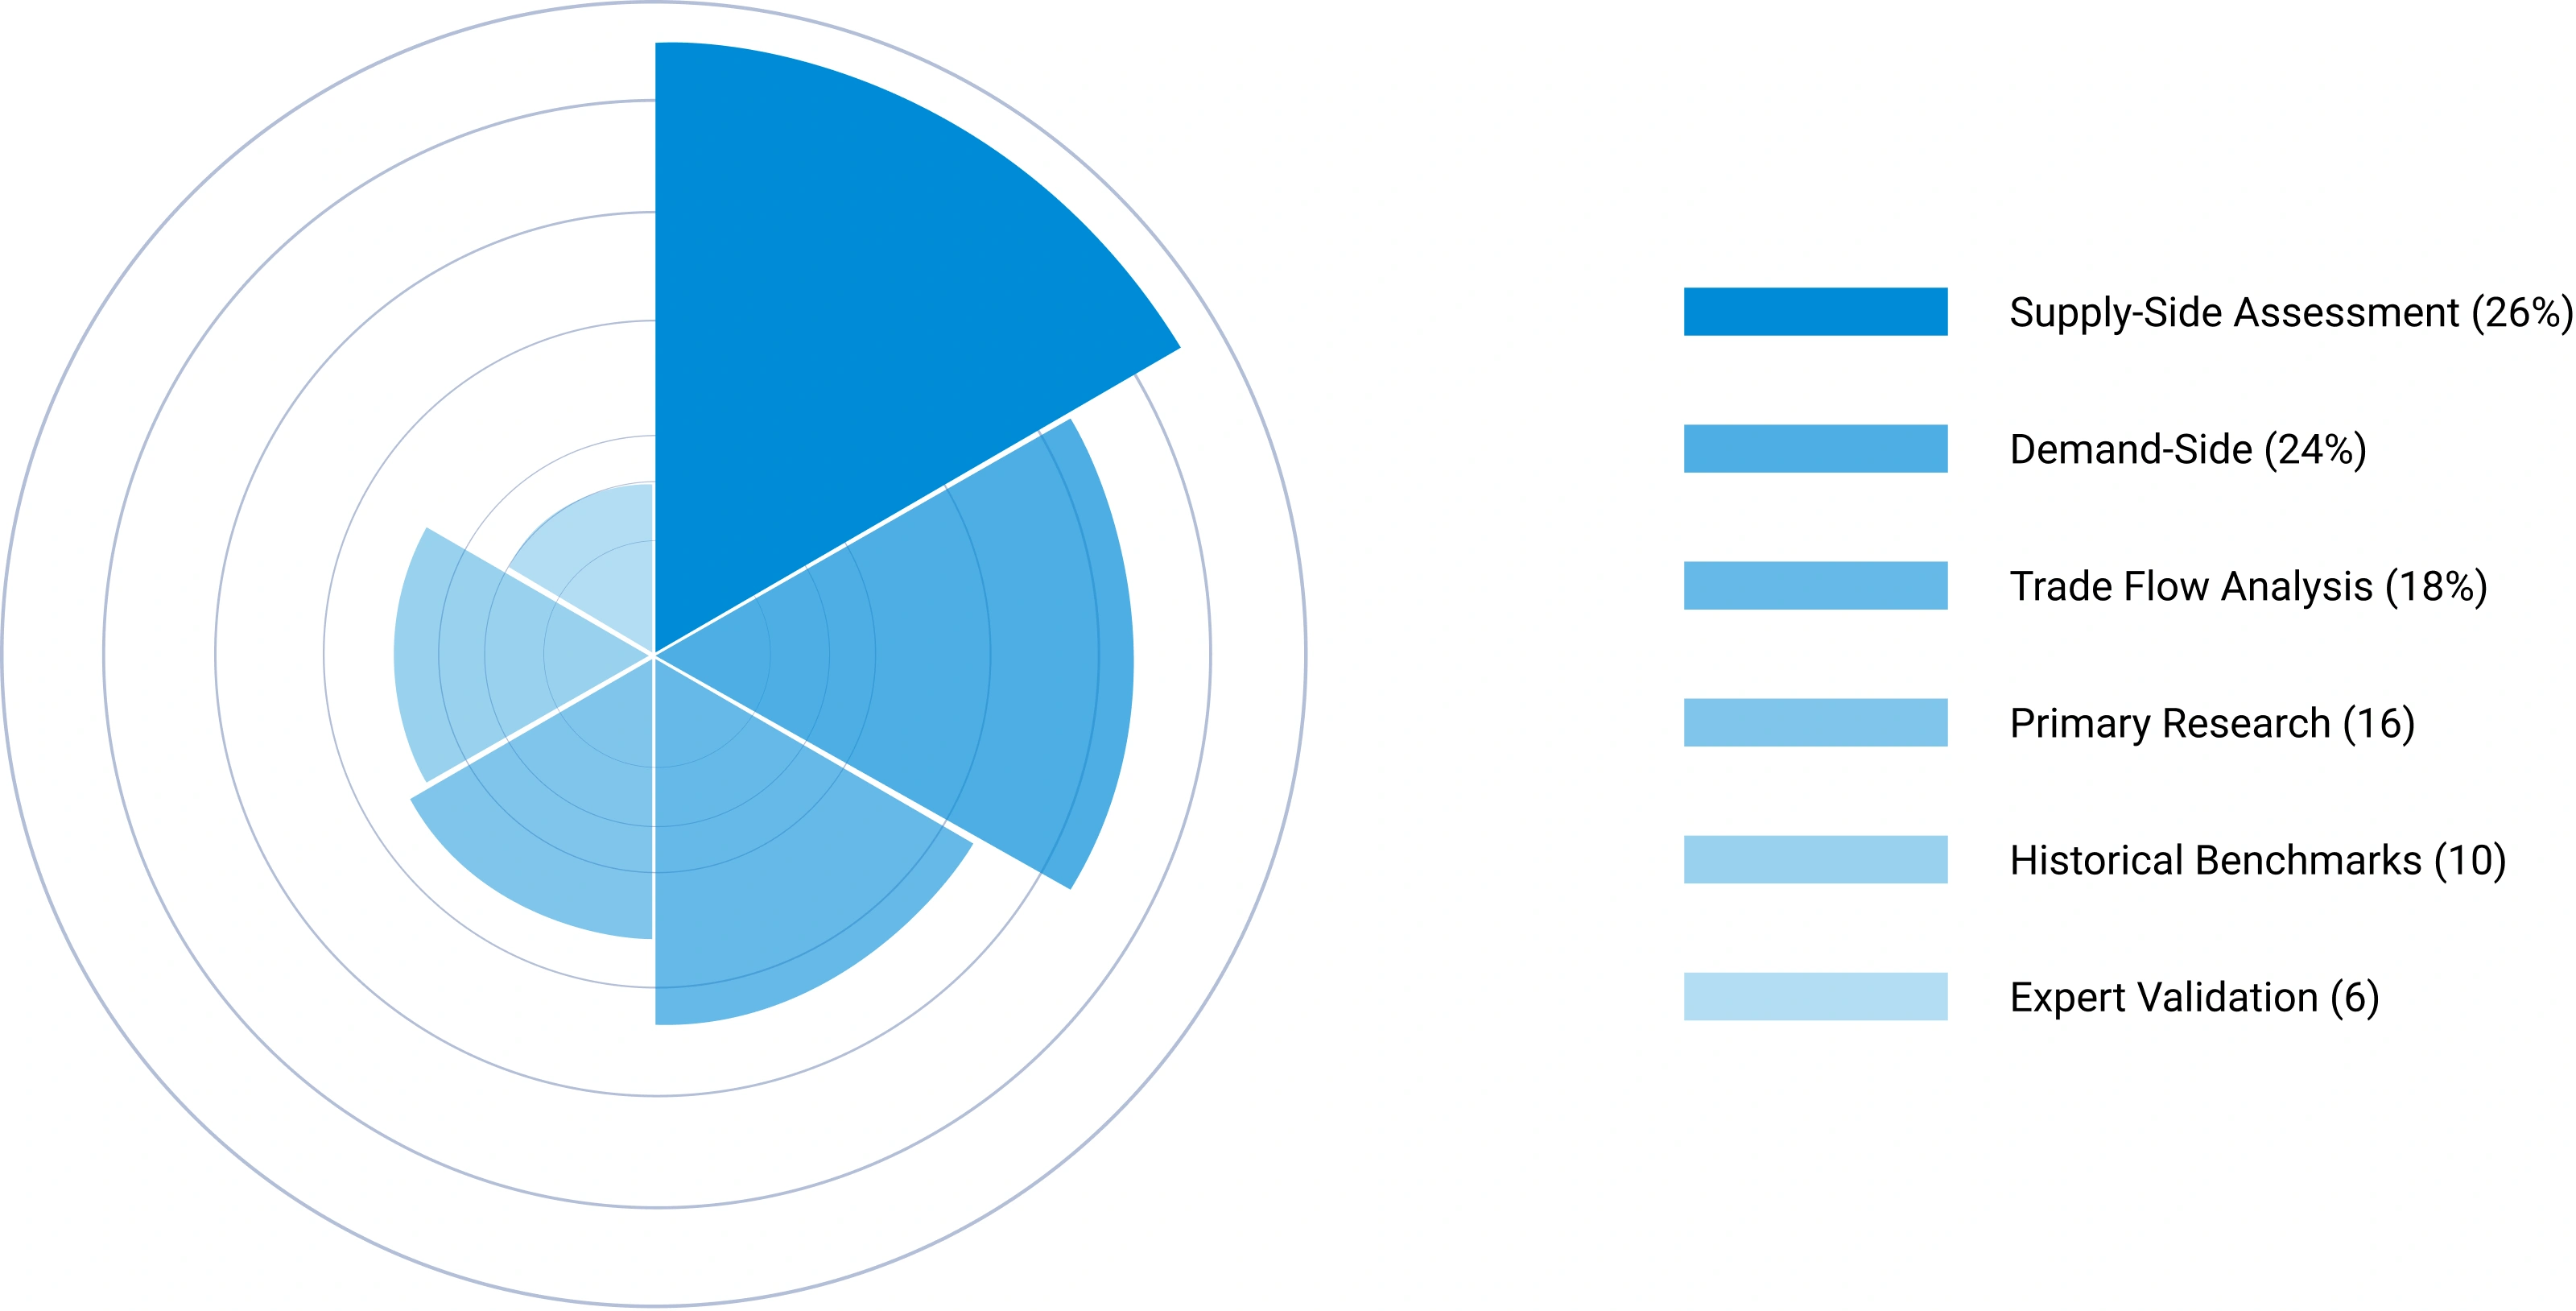
No single methodology is relied upon in isolation. Multiple independent estimation approaches are combined and reconciled to ensure consistency, accuracy, and analytical defensibility. Any material deviations between approaches are investigated and adjusted through additional validation cycles.
The final market size is derived through weighted triangulation of all validated methodologies. Any material deviations between approaches are investigated and adjusted through additional validation cycles. The outcome represents the most realistic assessment of the market based on available evidence and expert confirmation ensuring that volume and value estimates are fully consistent with one another.
Triangulation Framework — Input Contribution Weight
Relative weight each sizing input contributes to the final reconciled market estimate
Phase 7 — Forecast Modeling: Projecting Future Market Evolution
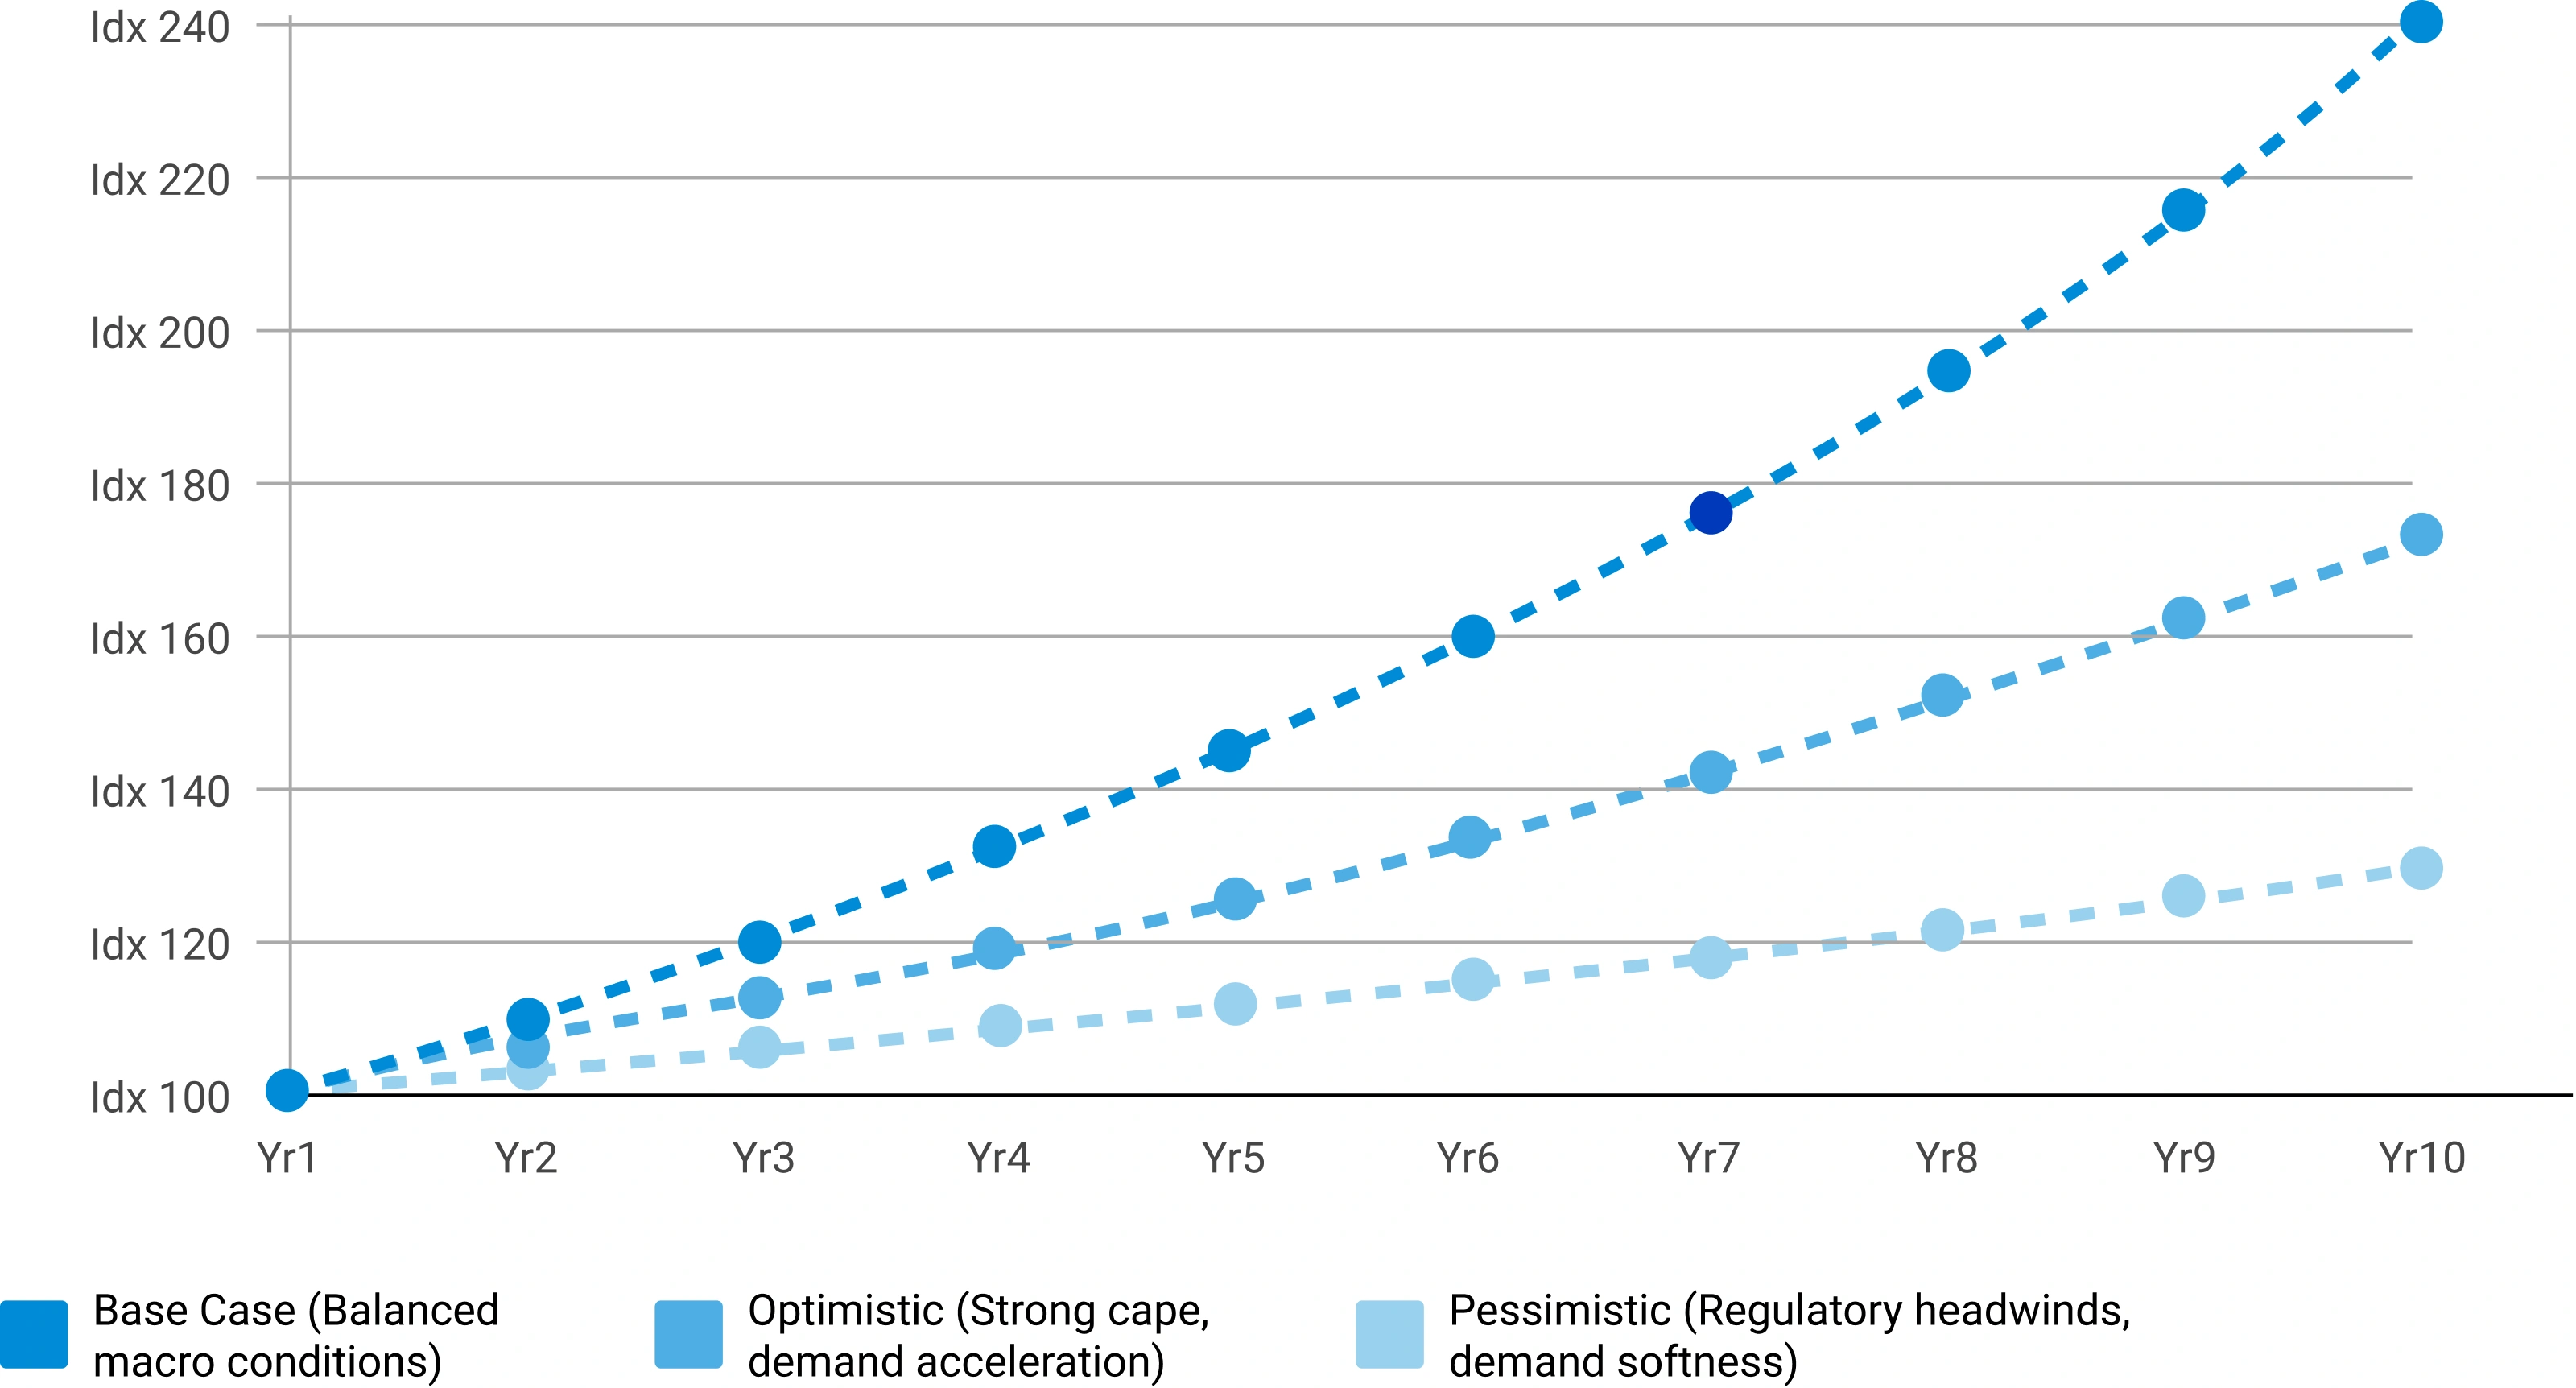
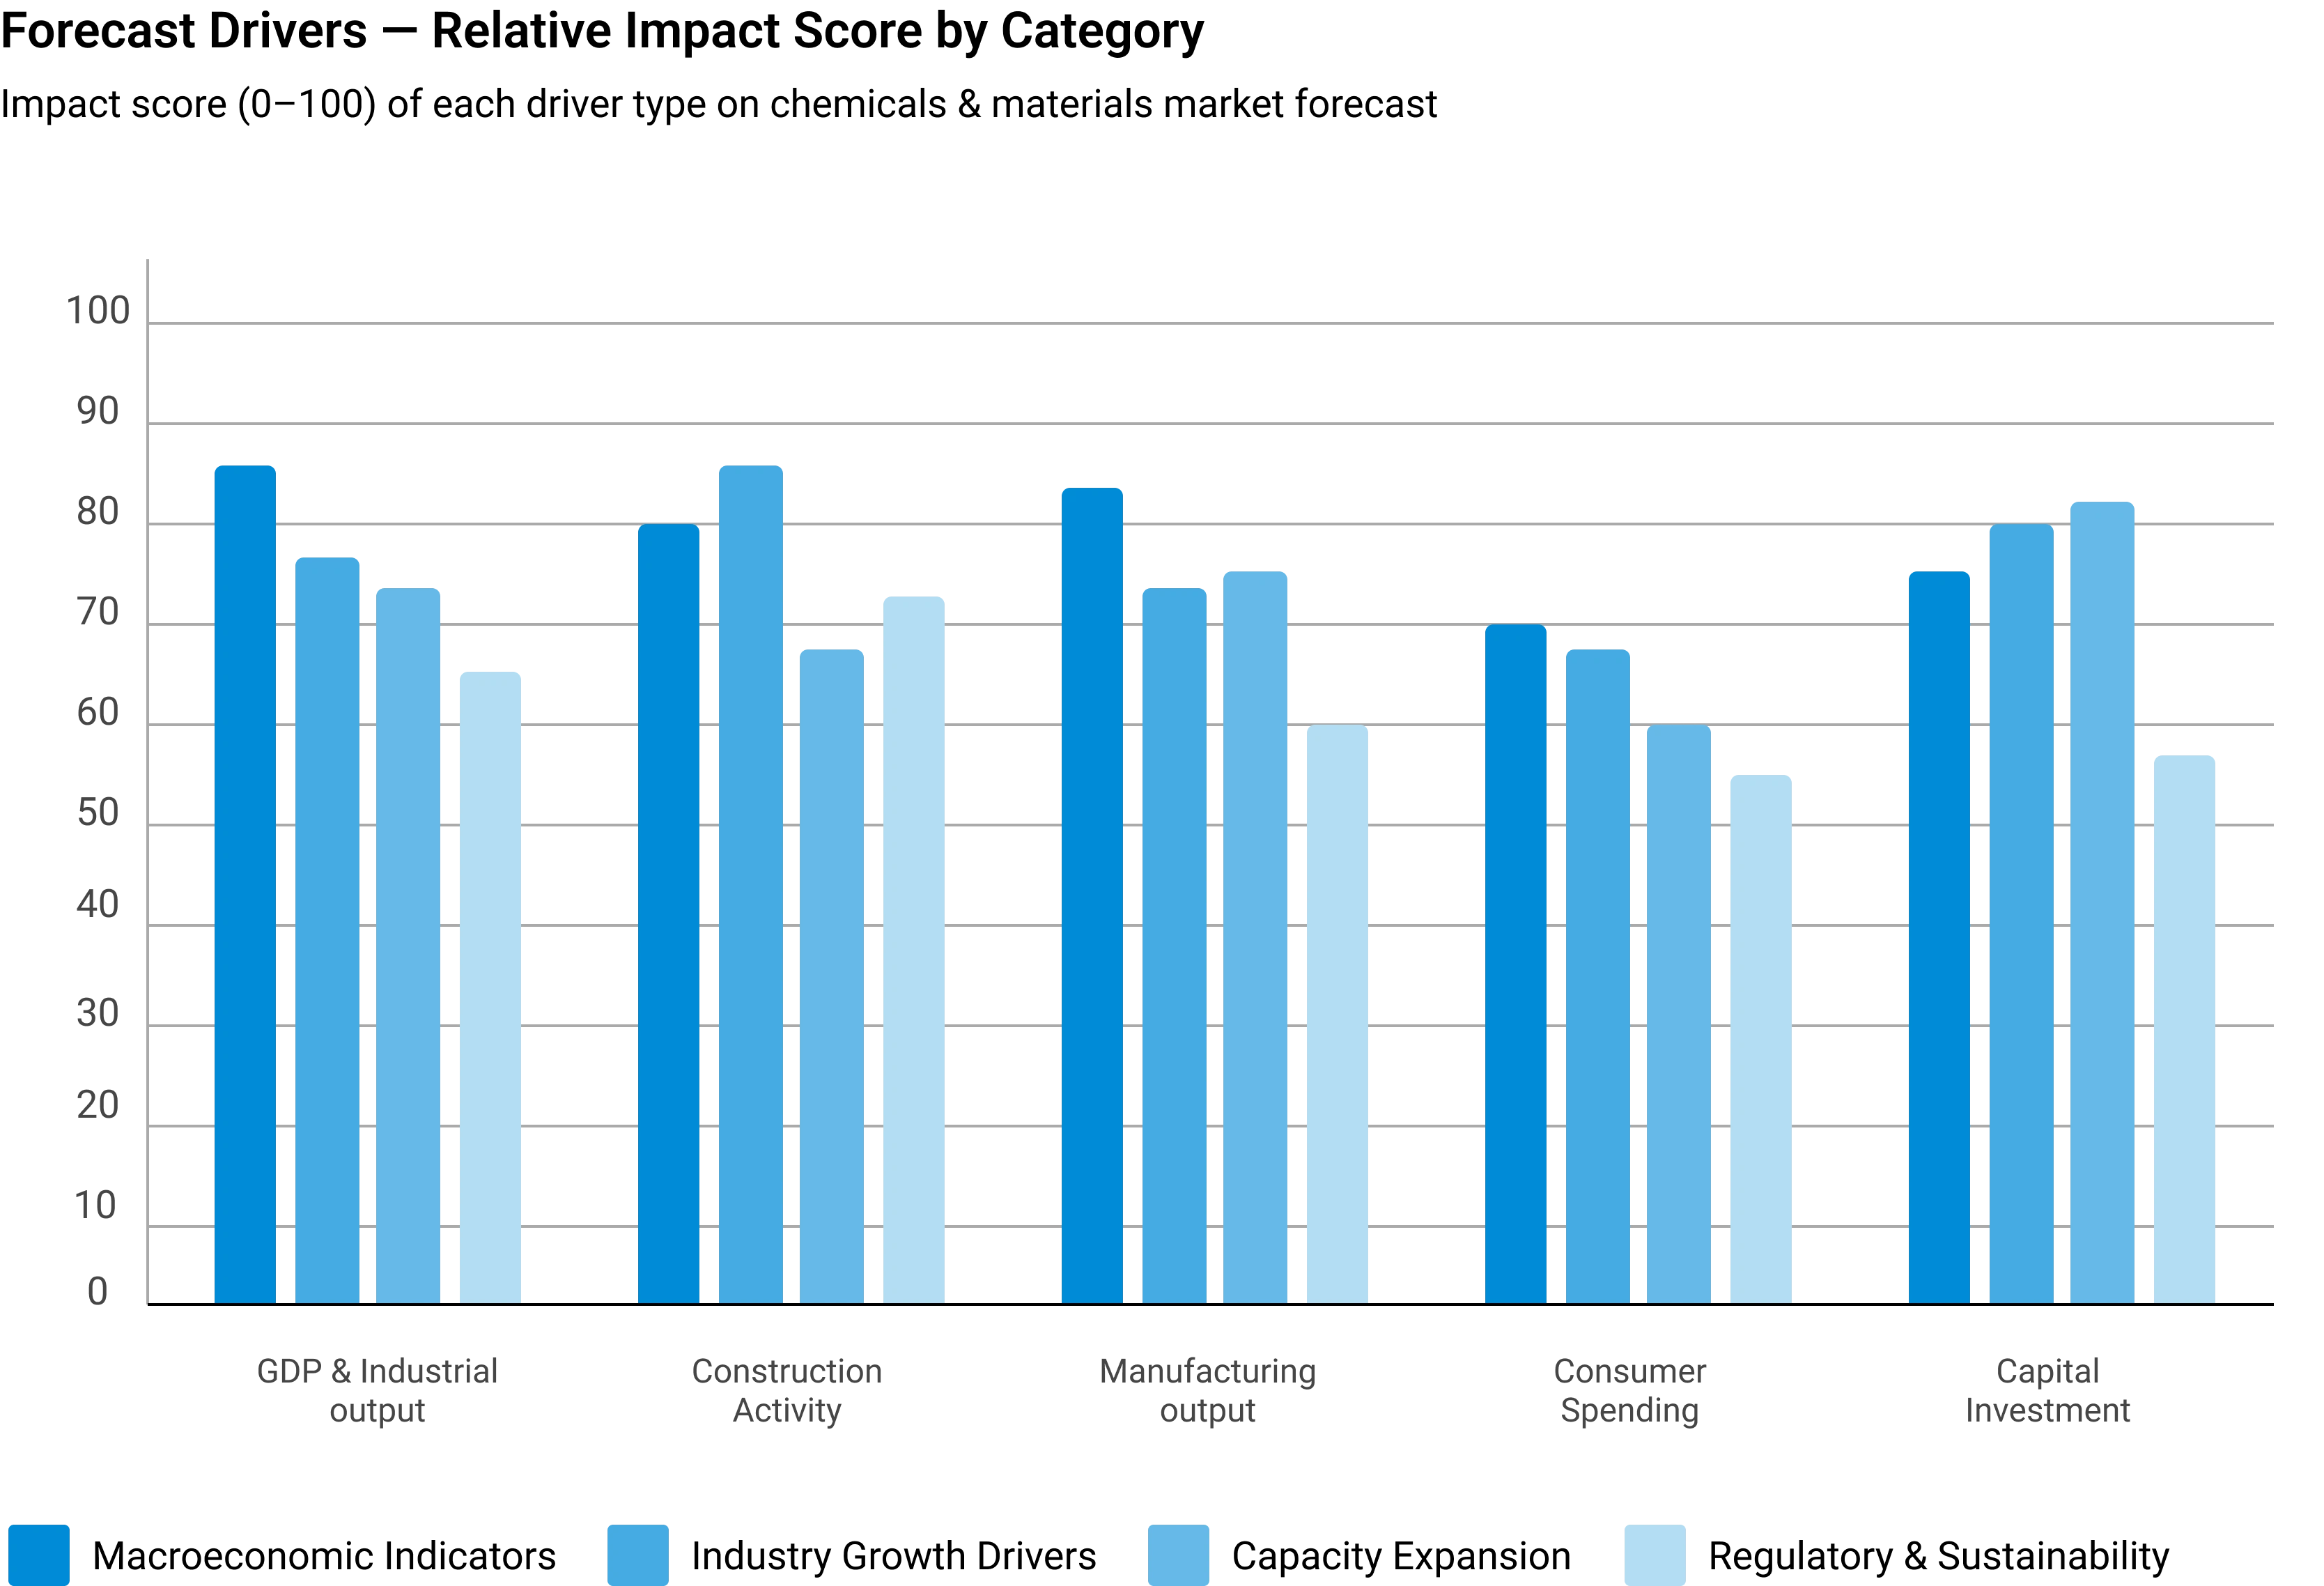
Forecasting evaluates the future trajectory of the market using a combination of quantitative indicators and qualitative assessments across economic, industry, and regulatory dimensions. Rather than simple extrapolation, each driver is independently modeled and integrated into a composite forecast.
Macroeconomic Indicators
GDP growth, industrial production, manufacturing output, construction activity, consumer spending, and capital investment form the quantitative foundation of long-term demand projections. These are applied at country, regional, and global levels.
Industry Growth Drivers
Urbanization, infrastructure development, industrialization, technological innovation, sustainability initiatives, and evolving product performance requirements are assessed at regional and industry levels — capturing both structural and cyclical demand drivers.
Capacity Expansion Analysis
Announced plant expansions, new manufacturing facilities, technology upgrades, and strategic investments are evaluated to determine future supply-demand dynamics and potential market tightness or oversupply situations.
Regulatory & Sustainability
Environmental regulations, chemical safety standards, emission reduction targets, circular economy initiatives, and sustainability requirements are incorporated as they often influence product adoption rates and market growth trajectories.
Scenario Forecast Range — Indexed Market Growth (Year 1–10)
Illustrative indexed growth trajectories across Base, Optimistic, and Pessimistic scenarios over a 10-year forecast horizon
Forecast Drivers — Relative Impact Score by Category
Impact score (0–100) of each driver type on chemicals & materials market forecast



Comments
Share your thoughts, ask a question, or provide feedback about this report.