
U.S. Biodiesel Market Size, Competitive Landscape Analysis Report 2035
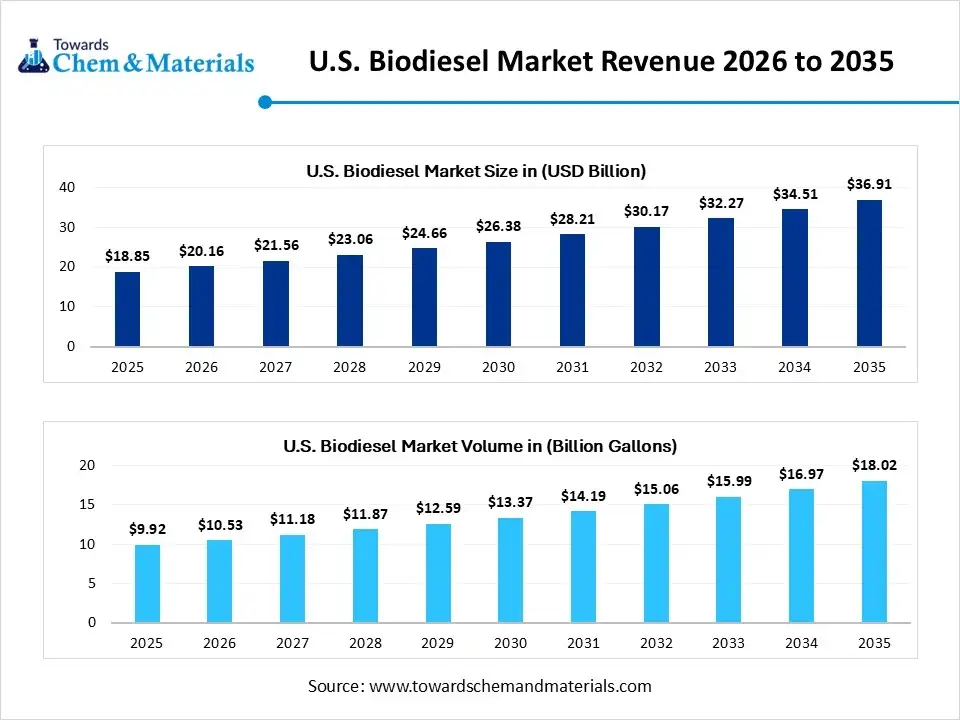
The U.S. biodiesel market size was estimated at USD 18.85 billion in 2025 and is expected to be worth around USD 36.91 billion by 2035, growing at a CAGR of 6.95% from 2026 to 2035. In terms of volume, the U.S. biodiesel market industry is projected to grow from 9.92 billion gallons in 2025 to 18.02 billion gallons by 2035, exhibiting a compound annual growth rate (CAGR) of 4.85% over the forecast period from 2026 to 2035. Global shift towards sustainable and cleaner fuels has driven investor confidence in the industry’s future.
Key Takeaways
- By feedstock type, the soybean oil segment led the U.S. biodiesel market with approximately 42% industry share in 2025.
- By feedstock type, the waste cooking oil / yellow grease segment is expected to grow at the fastest rate in the market during the forecast period.
- By product/fuel type, the B20 segment emerged as the top-performing segment in the market with approximately 36% of the industry share in 2025.
- By product/fuel type, the B100 / renewable diesel segment is expected to lead the market in the coming years.
- By production tech, the transesterification segment led the market with approximately 58% share in 2025.
- By production tech, the hydroprocessing/HEFA segment is expected to capture the biggest portion of the market in the coming years.
- By end user, the commercial transport fleets segment led the market with approximately 46% industry share in 2025.
- By end user, the government/municipal fleets segment is expected to grow at the fastest rate in the market during the forecast period.
Market Size and Volume Forecast
- Market Estimated Size (2025): USD 18.85 Billion | CAGR (2026–2035): 6.95%
- Market Projected Size (2035): USD 36.91 Billion
- Market Volume (2025): 9.92 Billion Gallons | Volume CAGR (2026–2035):4.85%
- Market Projected Volume (2035): 18.02 Billion Gallons
- Pricing Data (2025):
- Average Manufacturing Price (2025): USD 3.87/Gallon
- Average Selling Price (2025): USD 4.49/Gallon
- Pricing CAGR (2025–2035): 3.6%
Is Biodiesel the Future of Clean Transportation in America?
The U.S. biodiesel industry refers to the domestic industry involved in the production, distribution, and use of biodiesel as an alternative fuel. Biodiesel is a renewable, biodegradable fuel derived primarily from vegetable oils, animal fats, and waste cooking oils, which can be blended with conventional diesel (B5, B20, B100) for transportation and industrial applications.
The market is driven by environmental regulations, renewable fuel standards (RFS), demand for low-emission fuels, rising adoption in transportation and heavy-duty sectors, and incentives promoting biofuel production and consumption. It is blended and offers long-lasting fragrances, as per the recent industry observation.
Report Scope
| Report Attributes | Details |
| Market Size in 2026 | USD 20.16 Billion |
| Expected Size by 2035 | USD 36.91 Billion |
| Growth Rate from 2025 to 2035 | CAGR 6.95% |
| Base Year of Estimation | 2025 |
| Forecast Period | 2025 - 2035 |
| Segment Covered | By Feedstock Type, By Product / Fuel Type, By Production Technology, By End-User |
| Key Companies Profiled | Pacific Biodiesel Technologies, Neste Corporation (U.S. operations) , Bunge Limited , Green Plains Inc. , World Energy , Valero Energy Corporation , Pacific Ethanol, Inc. , Tyson Foods, Inc. (animal fat feedstock partnerships) , Sustainable Oils, LLC |
U.S. Biodiesel Market Outlook:
- Industry Growth Overview: Between 2025 and 2030, the country has actively shifted towards cleaner fuel options in recent years by reducing dependence on traditional fossil fuels. Moreover, by playing a crucial role in decarbonizing transportation and logistics, biodiesel has gained recognition for its innovative potential in the past few years.
- Sustainability Trends: The biodiesel manufacturers are seen as integrating waste-based feedstock in the production of biodiesel nowadays. Furthermore, these waste feedstocks are actively reducing the dependence on food crops and lowering carbon intensity while promoting sustainability standards in the sector.
- Global Expansion: The global expansion of the biodiesel sector is primarily reflected through technology sharing and exports. Moreover, the biodiesel manufacturers of the United States are seen in exporting biodiesel to nations that are facing emission targets, like Asia and Europe, nowadays.
Key Technological Shifts in the U.S. Biodiesel Market:
The market has observed the under-technology integration while maintaining expense and using traditional refineries in recent years. Moreover, several manufacturers are investing in advanced technology, which is likely to drive the industry growth in the coming year. Also, initiatives like co-processing in existing refineries and usage for domestic feedstock are contributing to the industry's potential in recent years.
Trade Analysis of the U.S. Biodiesel Market: Import & Export Statistics
The United States has exported a heavy amount of biodiesel in 2024, which is estimated as 176.8 million gallons.(Source: www.fastmarkets.com)
Value Chain Analysis of the U.S. Biodiesel Market
- Distribution to Industrial Users: The distribution of biodiesel in the United States includes a multi-tier supply chain and major industry users
- Key Players: Cargill Inc. and Neste
- Chemical Synthesis and Processing: The chemical synthesis and the processing of the biodiesel in the United States are associated with processes like transesterification and others.
- Regulatory Compliance and Safety Monitoring: The safety and regulatory process of biodiesel in the United States revolves around the federal agencies and their key regulations.
U.S. Biodiesel Market’s Regulatory Landscape: Global Regulations
| Country / Region | Regulatory Body | Key Regulations | Focus Areas | Notable Notes |
| United States | Environmental Protection Agency (EPA) | Renewable Fuel Standard (RFS) | Blended volumes and Greenhouse gas (GHG) reductions | The EPA is the central federal agency regulating biodiesel production and other fuels in the United States. |
Segmental Insights
Feedstock Type Insights
How did the Soybean Oil Segment Dominate the U.S. Biodiesel Market in 2025?
The soybean oil segment held approximately 42% share of the market in 2025, due to its wide availability and cost-effectiveness. Furthermore, the United States is considered one of the leading soybean producers, which has contributed to the segment's growth in recent years. Moreover, factors like a stronger domestic chain and compatibility with existing biodiesel technology, the soybean oil segment, have gained major industry share in recent years, as per the recent survey.
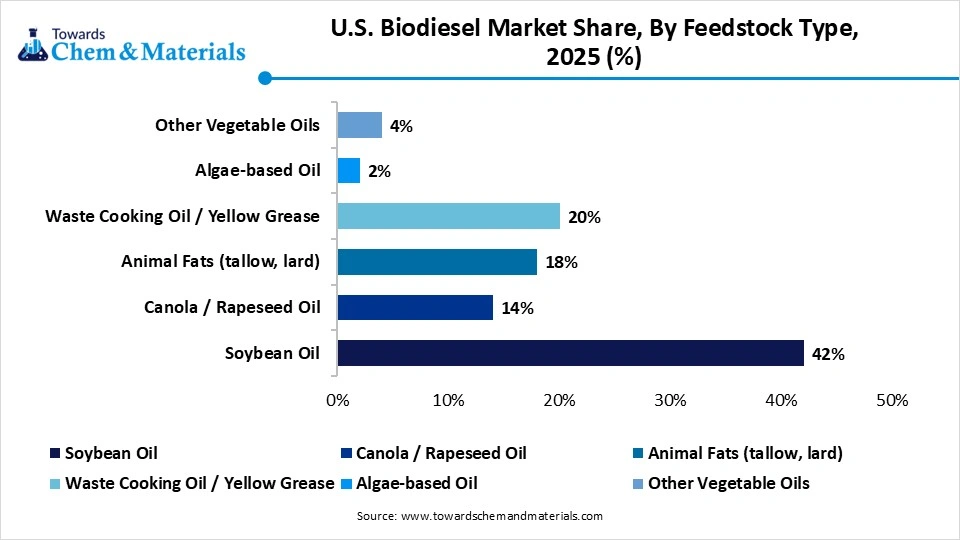
The waste cooking oil /yellow grease segment is expected to grow at a notable rate during the predicted timeframe, owing to the ongoing sustainability shift and circular economy models. Furthermore, these feedstocks have been seen in lower carbon intensity than regular crop-based feedstock, which is likely to create lucrative opportunities in the coming years.
U.S. Biodiesel Market Share, By Feedstock Type , 2025 (%)
| By Feedstock Type | Revenue Share, 2025 (%) |
| Soybean Oil | 42% |
| Canola / Rapeseed Oil | 14% |
| Animal Fats (tallow, lard) | 18% |
| Waste Cooking Oil / Yellow Grease | 20% |
| Algae-based Oil | 2% |
| Other Vegetable Oils | 4% |
- The revenue distribution for the U.S. biodiesel market by feedstock type in 2025 reflects a strategic move toward domestic agricultural reliability and the increasing utilization of low-carbon waste products.
- Soybean Oil leads the market with a revenue share of 42% because it remains the most abundant and established domestic vegetable oil source, supported by a massive Midwestern production base and favorable federal blending incentives.
- Waste Cooking Oil / Yellow Grease accounts for 20% of the revenue share as the industry shifts toward "circular" feedstocks that offer significantly lower carbon intensity scores, making it highly valuable for meeting California’s Low Carbon Fuel Standard (LCFS).
- Animal Fats including tallow and lard capture 18% of the revenue share due to their high energy density and cost-effective availability as byproducts from the large-scale U.S. meat processing industry.
- Canola / Rapeseed Oil represents 14% of the revenue share as it provides a higher oil yield per acre than soybeans and remains a critical feedstock for biodiesel used in colder climates due to its superior cold-flow properties.
- Other Vegetable Oils contribute 4% to the total revenue share, encompassing emerging crops like camelina and pennycress which are being developed as cover crops to provide additional feedstock without competing with food production.
- Algae-based Oil holds 2% of the market share as it remains an expensive but high-potential niche focused on next-generation biofuels that require minimal land use and offer rapid carbon sequestration.
Product/ Fuel Type Insights
Why does the B20 Segment Dominate the U.S. Biodiesel Market by Fuel Type?
The B20 segment held approximately 36% of the Market in 2025, because it provides the best balance of performance, cost, and ease. It works seamlessly in existing engines without modifications, making it a practical choice for fleets and drivers. B20 also delivers strong environmental benefits by reducing emissions without the supply chain challenges of pure biodiesel. Fuel stations and distributors prefer B20 because infrastructure adjustments are minimal.
The B100 / renewable diesel segment is expected to grow at a notable rate during the forecast period, because of the push for deeper decarbonization. Unlike blends, pure biodiesel and renewable diesel deliver near-total replacement for petroleum diesel. Renewable diesel is chemically identical to petroleum diesel, which means it can be used in existing infrastructure with zero modification.
U.S. Biodiesel Market Share, By Product , 2025 (%)
| By Product | Revenue Share, 2025 (%) |
| B5 (5% Biodiesel, 95% Diesel) | 24% |
| B20 (20% Biodiesel) | 36% |
| B50 / B100 (50–100% Biodiesel) | 15% |
| Renewable Diesel (HEFA / HVO) | 25% |
- B20 (20% Biodiesel) leads the market with a revenue share of 36% because it represents the "sweet spot" for fleet operators, offering a significant reduction in emissions while remaining fully compatible with most existing diesel engines and fueling infrastructure without requiring modifications.
- Renewable Diesel (HEFA / HVO) captures 25% of the revenue share as it is chemically identical to petroleum diesel, allowing it to be used as a 100% replacement; its growth is heavily driven by its high carbon-intensity value under the California Low Carbon Fuel Standard and federal tax incentives.
- B5 (5% Biodiesel, 95% Diesel) accounts for 24% of the revenue share because it is widely utilized as a standard lubricity additive in the general retail diesel pool, meeting ASTM specifications that allow it to be sold at regular pumps without specialized labeling.
- B50 / B100 (50–100% Biodiesel) represents 15% of the revenue share as a specialized segment used primarily by environmentally conscious municipal fleets and in high-blend heating oil applications, though its growth is occasionally limited by cold-weather performance challenges.
Production Tech Insights
How Did The Transesterification Segment Dominate The U.S. Biodiesel Market In 2025?
The transesterification segment dominated the market with approximately 58% share in 2025, because it is simple, proven, and cost-effective. This process chemically transforms oils and fats into biodiesel using alcohol and a catalyst, making it ideal for soybean oil and other traditional feedstocks. U.S. producers favored transesterification because of its efficiency and ability to scale quickly. It became the backbone of early biodiesel production plants, ensuring consistent quality and output.
The hydroprocessing/HEFA segment is expected to grow at a significant rate during the forecast period, because it produces renewable diesel with higher quality and broader applications. Unlike transesterification biodiesel, HEFA-based renewable diesel is chemically like petroleum diesel, making it a fully "drop-in" fuel for engines, pipelines, and refineries. This technology is also better suited for scaling up large refineries, many of which are being converted into renewable fuel plants.
U.S. Biodiesel Market Share, By Production Technology , 2025 (%)
| By Production Technology | Revenue Share, 2025 (%) |
| Transesterification | 58% |
| Hydroprocessing / Hydrogenation | 32% |
| Enzymatic / Advanced Biofuel Processes | 10% |
- Transesterification leads the market with a revenue share of 58% because it remains the most established and cost-effective method for converting vegetable oils, particularly soybean oil, into conventional biodiesel (FAME) using existing domestic infrastructure.
- Hydroprocessing / Hydrogenation accounts for 32% of the revenue share as it is the primary technology used to produce renewable diesel, a premium "drop-in" fuel that is rapidly expanding due to its superior compatibility with existing petroleum pipelines and engines.
- Enzymatic / Advanced Biofuel Processes capture 10% of the market share because these emerging technologies allow for higher yields and the processing of lower-quality, high-acidity waste feedstocks without the need for intensive chemical catalysts.
End User Insights
Why does the Commercial Transport Fleets Segment Dominate the U.S. Biodiesel Market?
The commercial transport fleets segment held 50% of the Market in 2025 because they are high-volume fuel consumers and need cost-effective ways to reduce emissions. Trucking companies, logistics providers, and shipping fleets embraced biodiesel because it offered immediate carbon reductions without costly engine replacements.
The government / municipal fleets segment is expected to grow at a notable rate during the forecast period, because of strict public sector sustainability mandates. Cities, states, and federal agencies are under pressure to decarbonize their vehicle operations, including buses, police cars, and public works vehicles. Unlike private fleets, governments are driven not just by cost but also by policy commitments and climate pledges.
U.S. Biodiesel Market Share, By End-User, 2025 (%)
| By End-User | Revenue Share, 2025 (%) |
| Commercial Transport Fleets (trucking, buses) | 46% |
| Government Vehicles (municipal fleets, defense) | 18% |
| Industrial / Manufacturing Units | 22% |
| Aviation / Marine (biojet blends and marine biodiesel) | 14% |
- Commercial Transport Fleets lead the market with a revenue share of 46% because trucking and logistics companies rely on biodiesel as the most cost-effective "drop-in" solution to meet corporate ESG goals without the high capital expenditure of transitioning to electric heavy-duty vehicles.
- Industrial and Manufacturing Units account for 22% of the revenue share as the sector utilizes biodiesel for off-road equipment, backup power generators, and heating systems to comply with tightening industrial emission standards and state-level carbon mandates.
- Government Vehicles represent 18% of the revenue share due to longstanding federal and state procurement policies that require municipal fleets, postal services, and military transport to incorporate minimum percentages of renewable fuels into their daily operations.
- Aviation and Marine applications capture 14% of the market share as a rapidly growing segment, fueled by the scaling of Sustainable Aviation Fuel (SAF) and international maritime regulations that encourage the use of biodiesel blends to decarbonize long-haul shipping and air travel.
Country-level Investments & Funding Trends for the U.S Biodiesel Industry:
- The United States Department of Energy in the United States has invested heavily in biorefinery research and development and bioenergy, which is approximately $500 million.(Source : www.ieabioenergy.com)
Recent Development
- In May 2025, The Argus has expanded its electronic price discovery platform for biodiesel in the United States. Also, the newly extended platform called the Argus Open Market, which is real real-time electronic price discovery platform, as per the report published by the company recently.(Source: www.prnewswire.com)
Top Vendors In The U.S. Biodiesel Market & Their Offerings:
- Archer Daniels Midland (ADM): The company is known for its heavy agricultural processes and crop transformations into renewable energy.
- Renewable Energy Group, Inc. (REG): The company is seen as a huge biodiesel and renewable chemicals.
Cargill, Inc.: The company has multinational headquarters and focuses on food and agriculture solutions - Louis Dreyfus Company: The company is a major processor and merchant of agricultural goods, as per the latest information.
Other Key Players
- Pacific Biodiesel Technologies
- Neste Corporation (U.S. operations)
- Bunge Limited
- Green Plains Inc.
- World Energy
- Valero Energy Corporation
- Pacific Ethanol, Inc.
- Tyson Foods, Inc. (animal fat feedstock partnerships)
- Sustainable Oils, LLC
Segments Covered in the Report
By Feedstock Type
- Soybean Oil
- Canola / Rapeseed Oil
- Animal Fats (tallow, lard)
- Waste Cooking Oil / Yellow Grease
- Algae-based Oil
- Other Vegetable Oils
By Product / Fuel Type
- B5 (5% Biodiesel, 95% Diesel)
- B20 (20% Biodiesel)
- B50 / B100 (50–100% Biodiesel)
- Renewable Diesel (HEFA / HVO)
By Production Technology
- Transesterification
- Hydroprocessing / Hydrogenation
- Enzymatic / Advanced Biofuel Processes
By End-User
- Commercial Transport Fleets (trucking, buses)
- Government Vehicles (municipal fleets, defense)
- Industrial / Manufacturing Units
- Aviation / Marine (biojet blends and marine biodiesel)
A Seven-Phase Framework
Our methodology is designed to be universally applicable across commodity chemicals, specialty chemicals, petrochemicals, construction chemicals, coatings, electronic chemicals, industrial gases, agrochemicals, water treatment chemicals, and performance materials. Each phase builds upon the last, creating a layered validation structure that minimizes estimation error and maximizes analytical confidence.
The framework ensures comprehensive market coverage, robust cross-validation, and reliable long-term forecasting — producing market estimates that withstand scrutiny from investors, regulators, and corporate strategy teams.

Seven-Phase Framework — Analytical Effort Distribution
Relative analytical effort allocated across each phase of the Chemicals & Materials research framework

Phase 1 - Secondary Research: Establishing the Foundation
Secondary research collects and evaluates publicly available information from authoritative sources, establishing the foundational understanding of market structure, value chain dynamics, competitive landscape, and end-use demand patterns. Every source is evaluated for credibility, recency, geographic relevance, and methodological soundness before inclusion.
Industry Associations
Sources include ACC, CEFIC, ICCA, JCIA, CPCIF, and SOCMA providing production volumes, consumption trends, capacity developments, and sustainability initiatives.
Company Disclosures
Annual reports, investor presentations, earnings transcripts, and regulatory filings reveal product portfolios, manufacturing footprints, capacity expansions, and revenue segmentation.
Government Databases
National statistical offices, customs authorities, environmental agencies, and industrial production databases provide verified statistics on output, trade flows, and regulatory compliance.
Trade Databases
UN Comtrade, ITC, Eurostat, and national customs authorities enable assessment of global product movement, import dependency, and export competitiveness across regions.
Our Secondary Research Sources
- Ministry of Chemicals and Fertilizers
- European Chemicals Agency
- United States Department of Energy
- Ministry of Industry and Information Technology
- Ministry of Economy Trade and Industry
- Ministry of Trade Industry and Energy
- National Institute of Standards and Technology
- Council of Scientific and Industrial Research
- Fraunhofer Society
- National Institute for Materials Science
Phase 2 — Supply-Side Assessment: Mapping Production Capabilities
Production Capacity Analysis
All major manufacturers are assessed for existing installed capacity, planned additions, expansions, new plant announcements, and technology adoption — mapped at global, regional, and country levels.
Capacity Utilization Adjustment
Installed capacity is adjusted using utilization rates based on demand conditions, feedstock availability, plant operating rates, maintenance schedules, and regulatory restrictions.
Manufacturer Revenue Analysis
Product-specific revenues, segment-level performance, regional distribution, average selling prices, and margin trends are evaluated to establish market value estimates.
Supply-Side Assessment — Capacity vs. Effective Production by Region
Illustrative comparison of installed capacity vs. effective production volume (after utilization rate adjustment) across major regions

Phase 3 — Demand-Side Assessment: Quantifying Chemical Consumption
Demand-side analysis quantifies chemical consumption across industries, applications, and geographies — identifying where and how chemicals are consumed throughout the value chain with precision.
End-Use Industry Analysis
Chemical demand is evaluated across automotive, construction, packaging, electronics, agriculture, healthcare, consumer goods, industrial manufacturing, energy and utilities, and water treatment. Industry output, production trends, and consumption intensity are analyzed to determine demand patterns.
Consumption Modeling
Demand is estimated using measurable indicators: kilograms per vehicle, kilograms per square meter of construction, dosage per cubic meter of water treated, kilograms per hectare of agricultural land, and kilograms per ton of manufactured products. Consumption factors are validated through industry publications and primary interviews.
Application Analysis
The market is segmented by application area to understand product performance requirements, formulation trends, technology adoption, customer preferences, and regulatory requirements improving demand accuracy and segmentation granularity.
Demand-Side Assessment — End-Use Industry Demand Distribution
Illustrative distribution of chemical & materials demand across key end-use industries

Phase 4 - Trade Flow Analysis: Balancing Regional Supply and Demand
Trade flow analysis reconciles regional supply and demand estimates through import and export data, identifying net supply positions, regional dependencies, and market imbalances. It serves as an independent validation layer that tests the consistency of supply-side and demand-side estimates.
Import Analysis
Import data is evaluated to determine volumes, source countries, product dependency, regional supply gaps, and pricing trends — identifying markets that rely heavily on external supply and where domestic production is insufficient to meet demand.
Export Analysis
Export assessments reveal production surplus, export competitiveness, regional manufacturing strength, and global market participation. Export patterns also help validate domestic production estimates and identify net exporting regions.
Apparent Consumption Model
Regional consumption is assessed using the standard apparent consumption formula:
Results identify net importing regions, net exporting regions, regional deficits, and surpluses — serving as an independent validation of supply and demand estimates.
Trade Flow Analysis — Net Supply Position by Region
Illustrative apparent consumption vs. domestic production across major regions — positive gap indicates net import dependency

Phase 5 — Primary Research: The Critical Validation Layer
Primary research tests and refines findings from secondary research through direct engagement with industry participants across the supply chain, demand side, and expert community. It captures intelligence that no database or published report can provide — the real-world experience of manufacturers, buyers, and specialists operating in the market.

Supply-Side Interviews
Conversations with chemical manufacturers, raw material suppliers, contract manufacturers, technology providers, and plant operators cover production trends, capacity utilization, pricing developments, technology shifts, and competitive dynamics.

Demand-Side Interviews
Engagement with OEMs, industrial consumers, procurement managers, distributors, formulators, and end-use manufacturers focuses on consumption trends, purchasing behavior, product substitution, demand outlook, and emerging applications.

Industry Expert Consultations
Additional interviews with industry consultants, independent experts, regulatory specialists, technical professionals, and research institutions provide deeper market context and validate key analytical assumptions.
Focus Areas of Primary Research:
Market Size & Forecast Validation
Revenue estimates, volume consumption, growth rates, forecast assumptions, regional demand.Supply Chain & Value Chain Assessment
Raw material sourcing, supply chain challenges, distribution networks, procurement practices.Production & Capacity Analysis
Manufacturing capacity, utilization rates, expansion projects, plant investments.Pricing & Cost Structure Analysis
Product pricing trends, feedstock costs, energy costs, margin pressures, pricing outlook.Competitive Landscape Assessment
Volume and value estimates confirmed to be fully consistent with one another before publicationInterview Volume by Market Scope
| Study Scope | Number of Interviews |
|---|---|
| Niche Market | 20 – 30 |
| Mid-Sized Market | 30 – 50 |
| Global Market | 50 – 80 |
| Highly Fragmented Market | 80 – 120 |
Interview Details:
Category : Manufacturers, Suppliers, Distributors, End Users, Experts/Associations
Average Duration : 30–60 Minutes
Interview Mode : Video calls, telephonic interviews, expert consultations
Interview Format : Structured / Semi-Structured questionnaire
Focus Areas of Primary Research:
Market Size & Forecast Validation :
Revenue estimates, volume consumption, growth rates, forecast assumptions, regional demand.
Supply Chain & Value Chain Assessment :
Raw material sourcing, supply chain challenges, distribution networks, procurement practices.
Production & Capacity Analysis :
Manufacturing capacity, utilization rates, expansion projects, plant investments.
Pricing & Cost Structure Analysis :
Product pricing trends, feedstock costs, energy costs, margin pressures, pricing outlook.
Competitive Landscape Assessment :
Market share, competitor positioning, strategic initiatives, partnerships, acquisitions.
Primary Research — Stakeholder Coverage by Category
Distribution of interview respondents across stakeholder categories (% share from PPT data)

Primary Research — Respondent Designation Profile
Seniority breakdown of interview respondents (% share from PPT data)

Primary Research — Geographic Coverage of Interviews
Regional distribution of primary research engagement (% share from PPT data)

Phase 6 — Data Triangulation and Market Validation
No single methodology is relied upon in isolation. Multiple independent estimation approaches are combined and reconciled to ensure consistency, accuracy, and analytical defensibility. Any material deviations between approaches are investigated and adjusted through additional validation cycles.
The final market size is derived through weighted triangulation of all validated methodologies. Any material deviations between approaches are investigated and adjusted through additional validation cycles. The outcome represents the most realistic assessment of the market based on available evidence and expert confirmation ensuring that volume and value estimates are fully consistent with one another.
Triangulation Framework — Input Contribution Weight
Relative weight each sizing input contributes to the final reconciled market estimate

Phase 7 — Forecast Modeling: Projecting Future Market Evolution
Forecasting evaluates the future trajectory of the market using a combination of quantitative indicators and qualitative assessments across economic, industry, and regulatory dimensions. Rather than simple extrapolation, each driver is independently modeled and integrated into a composite forecast.
Macroeconomic Indicators
GDP growth, industrial production, manufacturing output, construction activity, consumer spending, and capital investment form the quantitative foundation of long-term demand projections. These are applied at country, regional, and global levels.
Industry Growth Drivers
Urbanization, infrastructure development, industrialization, technological innovation, sustainability initiatives, and evolving product performance requirements are assessed at regional and industry levels — capturing both structural and cyclical demand drivers.
Capacity Expansion Analysis
Announced plant expansions, new manufacturing facilities, technology upgrades, and strategic investments are evaluated to determine future supply-demand dynamics and potential market tightness or oversupply situations.
Regulatory & Sustainability
Environmental regulations, chemical safety standards, emission reduction targets, circular economy initiatives, and sustainability requirements are incorporated as they often influence product adoption rates and market growth trajectories.
Scenario Forecast Range — Indexed Market Growth (Year 1–10)
Illustrative indexed growth trajectories across Base, Optimistic, and Pessimistic scenarios over a 10-year forecast horizon

Forecast Drivers — Relative Impact Score by Category
Impact score (0–100) of each driver type on chemicals & materials market forecast




Comments
Share your thoughts, ask a question, or provide feedback about this report.