
Aluminum Composite Materials Market Size Analysis Report 2034
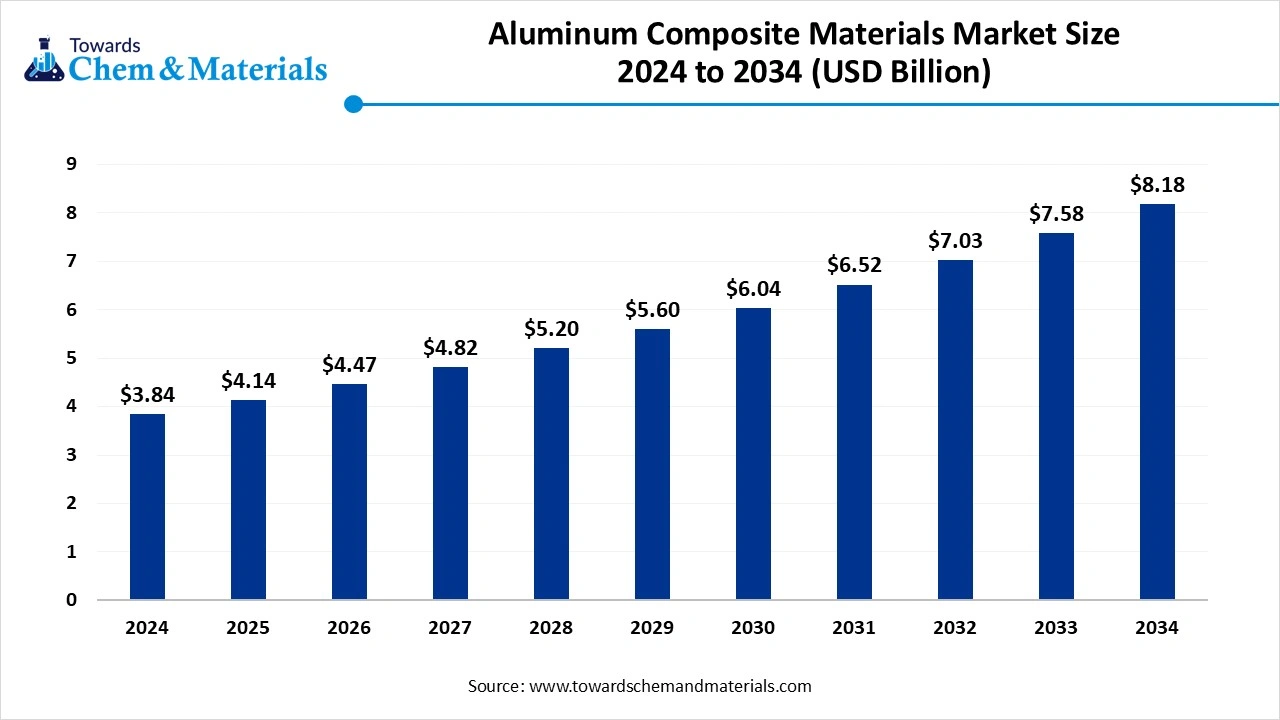
The aluminum composite materials market was USD 3.84 billion in 2024 and is forecasted to reach around USD 8.18 billion by 2034, accelerating at a CAGR of 7.85% from 2025 to 2034. The growing construction activities and increasing demand for transportation drive the market growth.
Key Takeaways
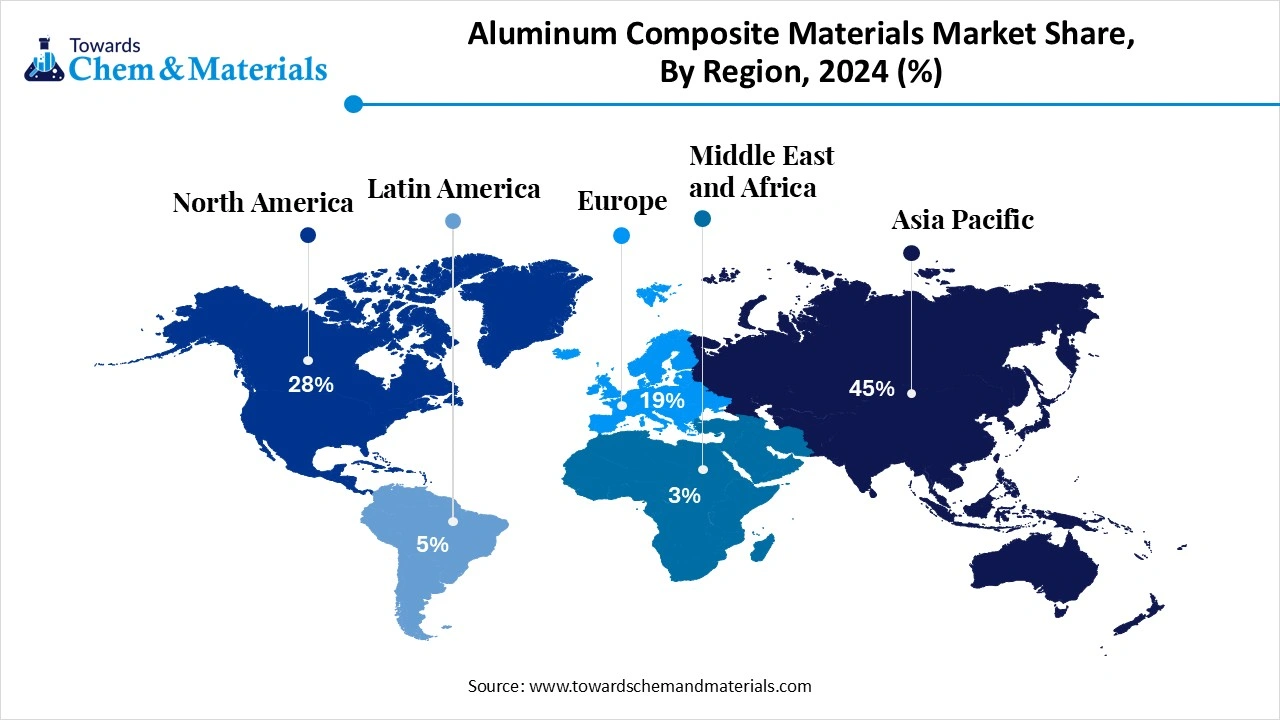
- By region, Asia Pacific held approximately a 45% share in the aluminum composite materials market in 2024 due to the increasing construction activities.
- By region, Middle East & Africa is growing at the fastest CAGR in the market during the forecast period due to the growing infrastructure development.
- By core material, the polyethylene core segment held approximately a 45% share in the market in 2024 due to the growing urban development.
- By core material, the fire-resistant core segment is expected to grow at the fastest CAGR in the market during the forecast period due to the increasing advertising application.
- By panel type, the PVDF-coated panel segment held approximately a 40% share in the market in 2024 due to the strong focus on customizing architectural design.
- By panel type, the anti-bacterial & anti-static panels segment is expected to grow at the fastest CAGR in the market during the forecast period due to the increasing awareness about hygiene.
- By end-user industry, the construction & infrastructure segment held approximately a 50% share in the market in 2024 due to the growing residential construction.
- By end-user industry, the transportation segment is expected to grow at the fastest CAGR in the market during the forecast period due to the growing expansion of the transportation sector.
- By distribution channel, the distributors & dealers segment held approximately a 45% share in the market in 2024 due to the increasing demand for technical support.
- By distribution channel, the direct sales to the OEMs segment are expected to grow at the fastest CAGR in the market during the forecast period due to the growing availability of customized ACM solutions.
Aluminum Composite Materials: Power Behind Modern & Sustainable Design
Aluminum composite materials (ACM) a rigid sheets that consist of two thin aluminum sheets bonded with a non-aluminum core. ACM is lightweight in nature and easy to install. ACM offers excellent resistance to impact, weather, and corrosion. ACM is very flexible and available in various textures, colors, & finishes. It offers good dimensional stability and is easy to fabricate. The different types of ACM are aluminum honeycomb panels, polyethylene core, fire-resistant core, and many more. ACM is widely used in applications like POP displays, framing, digital & screen printing, kiosks, outdoor & indoor signs, and vehicle interiors.
The growing development of interior design, like decorative elements, wall panels, and partitions, increases demand for ACM. The strong focus on sustainability and increasing demand for fire-resistant materials increases demand for ACM. Factors like growing infrastructure development, rising construction activities, growth in the automotive & transportation sector, increasing digital printing, and focus on energy efficiency in buildings contribute to the growth of the aluminum composite materials market.
- The United Kingdom exported 1524 shipments of aluminum composite panel.
(Source: www.volza.com) - From August 2023 to July 2024, Japan exported 44 shipments of aluminum composite materials with a growth rate of 29% compared to the previous 12 months.(Source: www.volza.com)
Who are the Leading Suppliers of Aluminum Composite Panels? 4x 3
| Company Name | Shipments | Share |
| Shandong Fame International Trade Co., Ltd. | 682 Shipments | 25% |
| Qingdao Zhouhaitong Trade Co., Ltd. | 329 Shipments | 12% |
| Shandong Mudas International Trade Co., Ltd | 310 Shipments | 11% |
Expanding Automotive Industry Drives Aluminum Composite Materials Market Growth
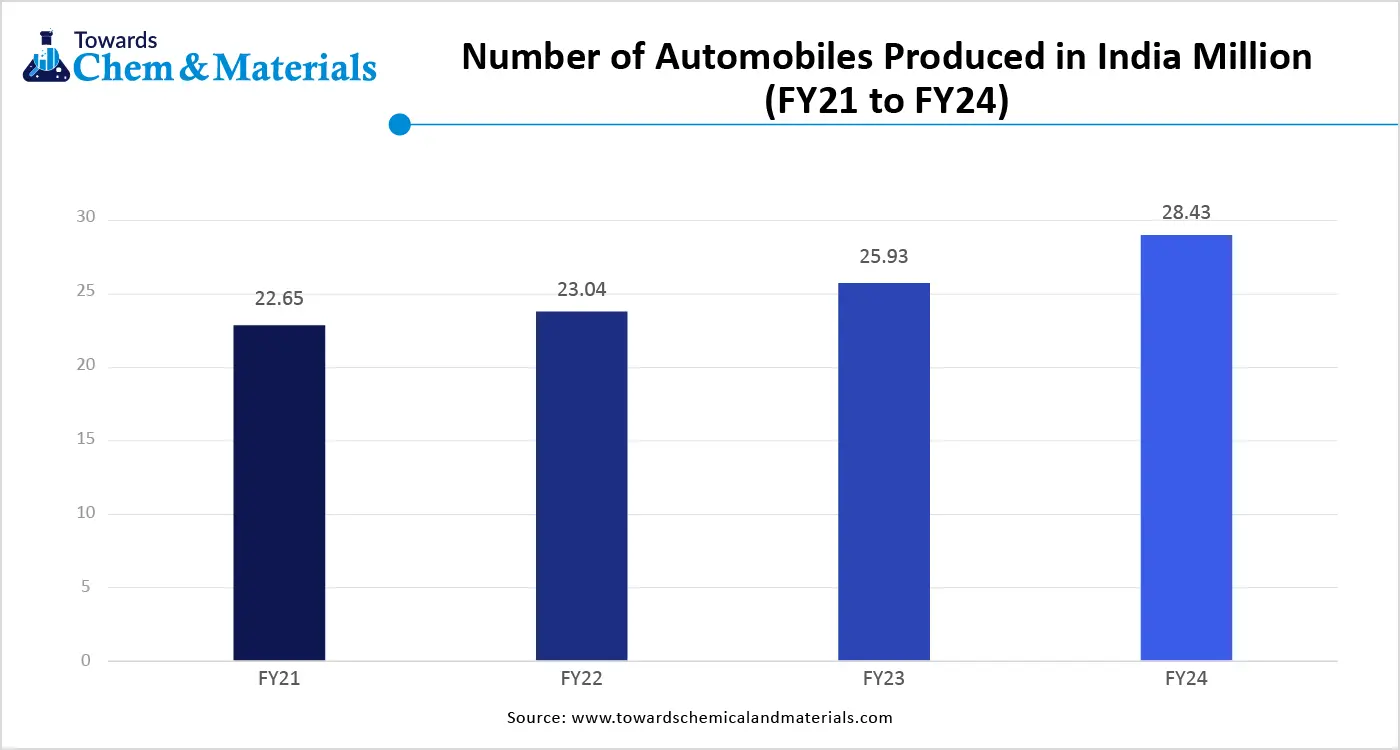
The growing expansion of the automotive industry in developing regions increases the demand for ACM for the development of various automotive components. The focus on improving fuel efficiency and reducing the weight of the vehicles increases demand for ACM. The strong focus on extending the lifespan of vehicles increases the adoption of ACMs. The stricter vehicle emission regulations increase demand for ACM to lower carbon emissions.
The growth in the adoption of electric vehicles increases demand for ACM for maintaining performance and maximizing the range of the battery. The development of interior, exterior, and structural parts of vehicles requires ACM. The development of engine components, brake systems, EV components, chassis & body parts, and interior components requires ACM. The growing development of advanced vehicle technologies and increasing complexity in vehicle design increase demand for ACM. The expanding automotive industry is a key driver for the growth of the aluminum composite materials market.
Market Trends
- Focus on Green Building: The strong focus on the development of green buildings and sustainable building development increases demand for ACM to reduce the consumption of energy and enhance insulation.
- Stringent Fire Safety Regulations: The stricter fire safety regulations in the high-rise buildings and public buildings increase the adoption of fire-resistant ACM.
- Growing Demand for Lightweight Materials: The growing demand for lightweight materials in the construction and automotive sectors increases the adoption of ACM. The lightweight nature of ACM helps in reducing weight, easy installation, and improves fuel efficiency.
Report Scope
| Report Attributes | Details |
| Market Size in 2025 | USD 4.14 Billion |
| Expected Size by 2034 | USD 8.18 Billion |
| Growth Rate from 2025 to 2034 | CAGR 7.85% |
| Base Year of Estimation | 2024 |
| Forecast Period | 2025 - 2034 |
| Dominant Region | Asia Pacific |
| Segment Covered | By Core Material, By Panel Type, By End-User Industry, By Distribution Channel, By Region |
| Key Companies Profiled | 3A Composites GmbH, Arconic Corporation, Alstrong Enterprises India Pvt. Ltd., Mitsubishi Chemical Corporation, Alubond U.S.A. (a brand of Mulk Holdings International), Yaret Industrial Group Co., Ltd., Shanghai Huayuan New Composite Materials Co., Ltd., Jyi Shyang Industrial Co., Ltd., Interplast Co. Ltd. |
Market Opportunity
Growing Advertising & Media Sector Surges Demand for ACM
The growing advertising & media industry increases demand for ACM to create attractive visuals. The increasing development of billboards and outdoor signage increases demand for ACM to withstand harsh outdoor conditions. The growing need for printing graphics and vibrant colors increases the adoption of ACMs. The development of large-scale advertising increases the adoption of ACMs due to their lightweight nature and easy installation.
The focus on creating various eye-catching and creative designs leads to higher adoption of ACMs. The increasing spending on digital and static advertising increases the adoption of ACM. The growing development of digital displays and billboards increases demand for ACM. The increasing development of various signage, like company logos, retail displays, and wayfinding systems, increases the adoption of ACM. The growing advertising & media sector creates an opportunity for the growth of the aluminum composite materials market.
Market Challenge
High Manufacturing Cost Limits Expansion of the Aluminum Composite Materials Market
Despite several benefits of the aluminum composite materials in various sectors, the high manufacturing cost restricts the market growth. Factors like need for specialized equipment, high cost of raw materials, and complex manufacturing processes are responsible for high production costs. The raw materials like aluminum, metallic coatings, wooden finishes, and core material like polyethylene are expensive.
The complex manufacturing processes, like bonding, liquid infiltration, finishing, and friction stir processing, require high cost. The development of infrastructure like metal recovery, smelting, and refining is expensive. The development of thicker ACP sheets and specialized core types is expensive. The high manufacturing cost hampers the growth of the aluminum composite materials market.
Regional Insights
Asia Pacific Aluminum Composite Materials Market Trends
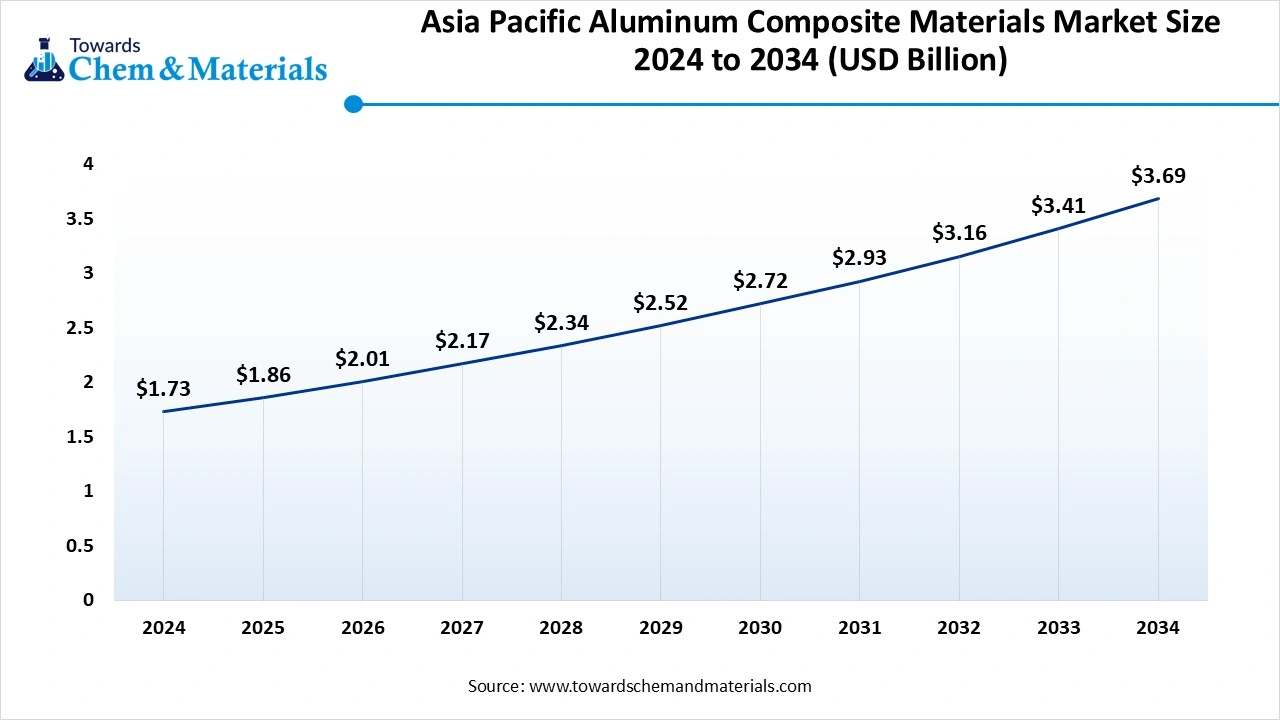
The Asia Pacific aluminum composite materials market size was estimated at USD 1.73 billion in 2024 and is anticipated to reach USD 3.69 billion by 2034, growing at a CAGR of 7.87% from 2025 to 2034. Asia Pacific dominated the Aluminum Composite Materials Market in 2024.
The rapid urbanization and growing construction activities increase demand for ACM. The development of projects like transportation systems, airports, and stadiums increases demand for ACM. The strong government investment in infrastructure development and focus on sustainable building practices increase the adoption of ACMs. The focus on the development of smart cities and the presence of an abundance of raw materials increase the production of ACM. The growing expansion of the automotive industry fuels the adoption of ACM, driving the overall growth of the market.
China Aluminum Composite Materials Market Trends
China is a major contributor to the market. The growing development of infrastructure projects like urban complexes, speed rail, and airports increases the demand for ACM. The strong government support for urban construction and focus on green building practices increases the adoption of ACM. The growing investment in advanced production technologies and a well-developed ACM production base support the overall growth of the market.
- China exported 813 shipments of aluminum composite material.(Source: www.volza.com)
- China exported 9222 shipments of aluminum composite panel.(Source: www.volza.com)
Middle East & Africa Aluminum Composite Materials Market Trends
The Middle East & Africa are experiencing the fastest growth in the market during the forecast period. The growing infrastructure, residential, and commercial construction activities increase demand for ACM. The growth in tourism-driven real estate in countries like Saudi Arabia and the UAE increases the adoption of ACM.
The focus on fire safety and government support for the development of smart cities increases the adoption of ACM. The growing development of infrastructure projects like office complexes, airports, and malls increases the demand for ACM. The growing automotive & aerospace sector increases the adoption of ACM, driving the overall growth of the market.
Global Aluminum Composite Materials Market Revenue, By Regional, 2024-2034 (USD Billion)
| By Regional | 2024 | 2025 | 2026 | 2027 | 2028 | 2029 | 2030 | 2031 | 2032 | 2033 | 2034 |
| North America | 0.77 | 0.82 | 0.88 | 0.95 | 1.02 | 1.09 | 1.17 | 1.26 | 1.35 | 1.45 | 1.55 |
| Europe | 1.08 | 1.16 | 1.24 | 1.33 | 1.43 | 1.54 | 1.66 | 1.78 | 1.91 | 2.05 | 2.21 |
| Asia-Pacific | 1.46 | 1.59 | 1.73 | 1.89 | 2.06 | 2.24 | 2.44 | 2.66 | 2.9 | 3.15 | 3.43 |
| Latin America | 0.27 | 0.29 | 0.31 | 0.33 | 0.35 | 0.38 | 0.4 | 0.43 | 0.46 | 0.5 | 0.53 |
| Middle East & Africa | 0.27 | 0.28 | 0.3 | 0.32 | 0.33 | 0.35 | 0.37 | 0.39 | 0.41 | 0.43 | 0.45 |
Saudi Arabia Aluminum Composite Materials Market Trends
Saudi Arabia is growing in the aluminum composite materials market. The growing development of infrastructure projects like Qiddiya, NEOM, and the Red Sea Project increases demand for ACM. The growing residential & commercial construction and strong government support for sustainable building materials increase demand for ACM. The presence of key manufacturers like AI-Dahayan, Masa, and Delta Panels supports the overall growth of the market.
Segmental Insights
Core Material Insights
Why did the Polyethylene Core Segment Dominate the Aluminum Composite Materials Market?
The polyethylene (PE) core segment dominated the market in 2024. The strong focus on easy cutting, bending, and shaping increases the adoption of the polyethylene core. The growth in urban development and increasing demand for lightweight materials in construction increases the adoption of the PE core. The affordability of PE and ease of installation help the market growth. The stricter building regulations and increasing need for thermal insulation in buildings increase demand for PE core. The growing PE core applications in interior decoration, cladding, building facades, signage, and wall panels drive the market growth.
Global Aluminum Composite Materials Market Revenue, By Core Material, 2024-2034 (USD Billion)
| By Core Material | 2024 | 2025 | 2026 | 2027 | 2028 | 2029 | 2030 | 2031 | 2032 | 2033 | 2034 |
| Polyethylene (PE) Core | 1.54 | 1.64 | 1.74 | 1.85 | 1.97 | 2.1 | 2.24 | 2.38 | 2.53 | 2.69 | 2.86 |
| Fire-Resistant (FR) Core | 1.34 | 1.47 | 1.61 | 1.76 | 1.92 | 2.1 | 2.3 | 2.51 | 2.74 | 2.99 | 3.27 |
| Aluminum Honeycomb Core | 0.58 | 0.63 | 0.69 | 0.75 | 0.82 | 0.9 | 0.98 | 1.07 | 1.17 | 1.27 | 1.39 |
| Other Specialized Cores | 0.38 | 0.41 | 0.43 | 0.45 | 0.48 | 0.5 | 0.53 | 0.56 | 0.59 | 0.62 | 0.65 |
The fire-resistant core segment is the fastest-growing in the market during the forecast period. The stricter fire safety regulations and increasing awareness about fire safety increase demand for fire-resistant core. The growing development of public structures and high-rise buildings increases demand for fire-resistant core. The focus on green building and increasing applications like interior, cladding, & facades increases the adoption of fire-resistant core. The growing expansion of the transportation sector and increasing advertising & signage applications increase the adoption of fire-resistant core, supporting the overall growth of the market.
Panel Type Insights
How PVDF-Coated Segment Held the Largest Share in the Aluminum Composite Materials Market?
The PVDF-coated panels segment held the largest revenue share in the market in 2024. The strong focus on gloss & color retention for longer periods in the buildings and constructions increases the demand for PVDF-coated. The rapid urbanization and growing development of high-rise construction increase demand for PVDF-coated panels. The increasing development of customized architectural design and focus on fire safety increases demand for PVDF-coated panels. They offer excellent resistance against chalking, UV degradation, weathering, and fading. The growing demand for PVDF-coated panels in applications like interior decoration, signage, building facades, and advertisement boards drives the overall growth of the market.
The anti-bacterial & anti-static panels segment is experiencing the fastest growth in the market during the forecast period. The focus on infection control and growing awareness about hygiene increases demand for anti-bacterial panels. The strong focus on reducing microbial growth and stricter regulations about hygiene increases demand for anti-bacterial panels. The growing demand for anti-bacterial panels in schools, hospitals, and clinics helps the market growth. The growing electronics manufacturing and increasing use of static-sensitive equipment increase demand for anti-static panels. The growing utilization of precision electronics and focus on reducing static discharge increases the adoption of anti-static panels, supporting the overall growth of the market.
End-User Industry Insights
Which End-User Industry Dominated the Aluminum Composite Materials Market?
The construction & infrastructure segment dominated the market in 2024. The rapid urbanization and growing development of infrastructure projects like the metro stations and airports increase demand for ACM. The growing construction applications, like interior design, cladding, and roofing, increase the adoption of ACM. The development of high-rise buildings and stringent building codes increases demand for ACM. The growing commercial and residential construction increases the adoption of ACM. The strong focus on sustainable construction practices and increasing demand for lightweight construction materials increases the demand for ACM, driving the overall growth of the market.
Global Aluminum Composite Materials Market Revenue, By End-User Industry, 2024-2034 (USD Billion)
| By End-User Industry | 2024 | 2025 | 2026 | 2027 | 2028 | 2029 | 2030 | 2031 | 2032 | 2033 | 2034 |
| Construction & Infrastructure | 2.11 | 2.27 | 2.43 | 2.61 | 2.8 | 3 | 3.21 | 3.45 | 3.7 | 3.96 | 4.25 |
| Advertising & Media | 0.77 | 0.82 | 0.88 | 0.93 | 1 | 1.06 | 1.14 | 1.21 | 1.29 | 1.38 | 1.47 |
| Transportation (Automotive, Railways, Aerospace) | 0.58 | 0.64 | 0.71 | 0.79 | 0.88 | 0.98 | 1.09 | 1.21 | 1.34 | 1.48 | 1.64 |
| Industrial & Manufacturing | 0.38 | 0.41 | 0.45 | 0.48 | 0.52 | 0.56 | 0.6 | 0.65 | 0.7 | 0.76 | 0.82 |
The transportation segment is the fastest-growing in the market during the forecast period. The growing demand for lightweight vehicles in the aerospace & automotive sectors increases demand for ACM. The focus on reducing greenhouse gas emissions and improving fuel efficiency fuels demand for ACM. The rise in adoption of electric vehicles and increasing demand for heavy-duty vehicles increases the adoption of ACMs. The growing transportation sectors like aerospace, commercial vehicles, and railways increase demand for ACM, supporting the overall growth of the market.
Distribution Channel Insights
How Distributors & Dealers Segment Held the Largest Share in the Aluminum Composite Materials Market?
The distributors & dealers segment held the largest revenue share in the market in 2024. The presence of technical support like ACM maintenance requirements, properties, and installation methods increases the adoption of distributors & dealers. The well-established relationships with developers, architects, and contractors increase purchasing from distributors & dealers. The well-established distribution channels & networks, and a strong focus on handling supply chain complexities, increase demand for distributors & dealers, driving the overall growth of the market.
Global Aluminum Composite Materials Market Revenue, By Distribution Channel, 2024-2034 (USD Billion)
| By Distribution Channel | 2024 | 2025 | 2026 | 2027 | 2028 | 2029 | 2030 | 2031 | 2032 | 2033 | 2034 |
| Direct Sales | 1.92 | 2.06 | 2.22 | 2.38 | 2.56 | 2.75 | 2.95 | 3.17 | 3.4 | 3.65 | 3.92 |
| Distributors & Dealers | 1.54 | 1.65 | 1.77 | 1.9 | 2.04 | 2.19 | 2.34 | 2.52 | 2.7 | 2.9 | 3.11 |
| Online Sales Channels | 0.38 | 0.43 | 0.48 | 0.54 | 0.6 | 0.67 | 0.75 | 0.83 | 0.93 | 1.03 | 1.14 |
The direct sales to OEMs segment is experiencing the fastest growth in the market during the forecast period. The focus on developing a strong relationship with OEMs increases the adoption of direct sales. The increasing development of large-scale construction projects increases the demand for direct sales to OEMs. The growing development of a customized ACM solution and faster problem-solving increases the adoption of direct sales to OEMs, supporting the overall growth of the market.
Aluminum Composite Materials Market Value Chain Analysis
- Feedstock Procurement : The feedstock procurement for the aluminum composite materials includes aluminum sheets and core materials like polyethylene, expanded PVC, and thermoplastic sheets.
- Chemical Synthesis and Processing : The chemical synthesis of ACM involves processes like pre-treatment ( degreasing & chromatization), coating ( fluorocarbon resin, paints, & primer), bonding (core material, adhesive), and cutting & shaping.
- Quality Testing and Certification: The certification required for aluminum composite materials is BIS, which ensures the suitability & safety of materials for diverse applications.
Recent Developments
- In January 2025, Viva launched pre-coated, ready-to-install solid aluminum panels. The panel consists of features like antimicrobial silver-ion coating, weather-resistant PVDF coating, self-cleaning property, and scratch resistance. The panel is useful in aesthetic and functional applications.(Source: constructiontimes.co.in)
- In November 2024, ALUBOND launched Made in India engineered Solid Sheets, ALUCODUAL. The sheet consists of layers of laminated aluminum skins and offers perfect flatness. The sheet is useful in architectural applications like cladding, interior walls, soffits, facades, ceilings, column decoration, and curtain walls.(Source: www.rprealtyplus.com)
- In July 2023, Alumaze opened a new ACP manufacturing unit in Visakhapatnam. The raw material for manufacturing is imported from China, and the monthly current capacity of manufacturing panels is 15 lakh sq. ft.(Source: ww.alcircle.com)
Aluminum Composite Materials Market Top Companies
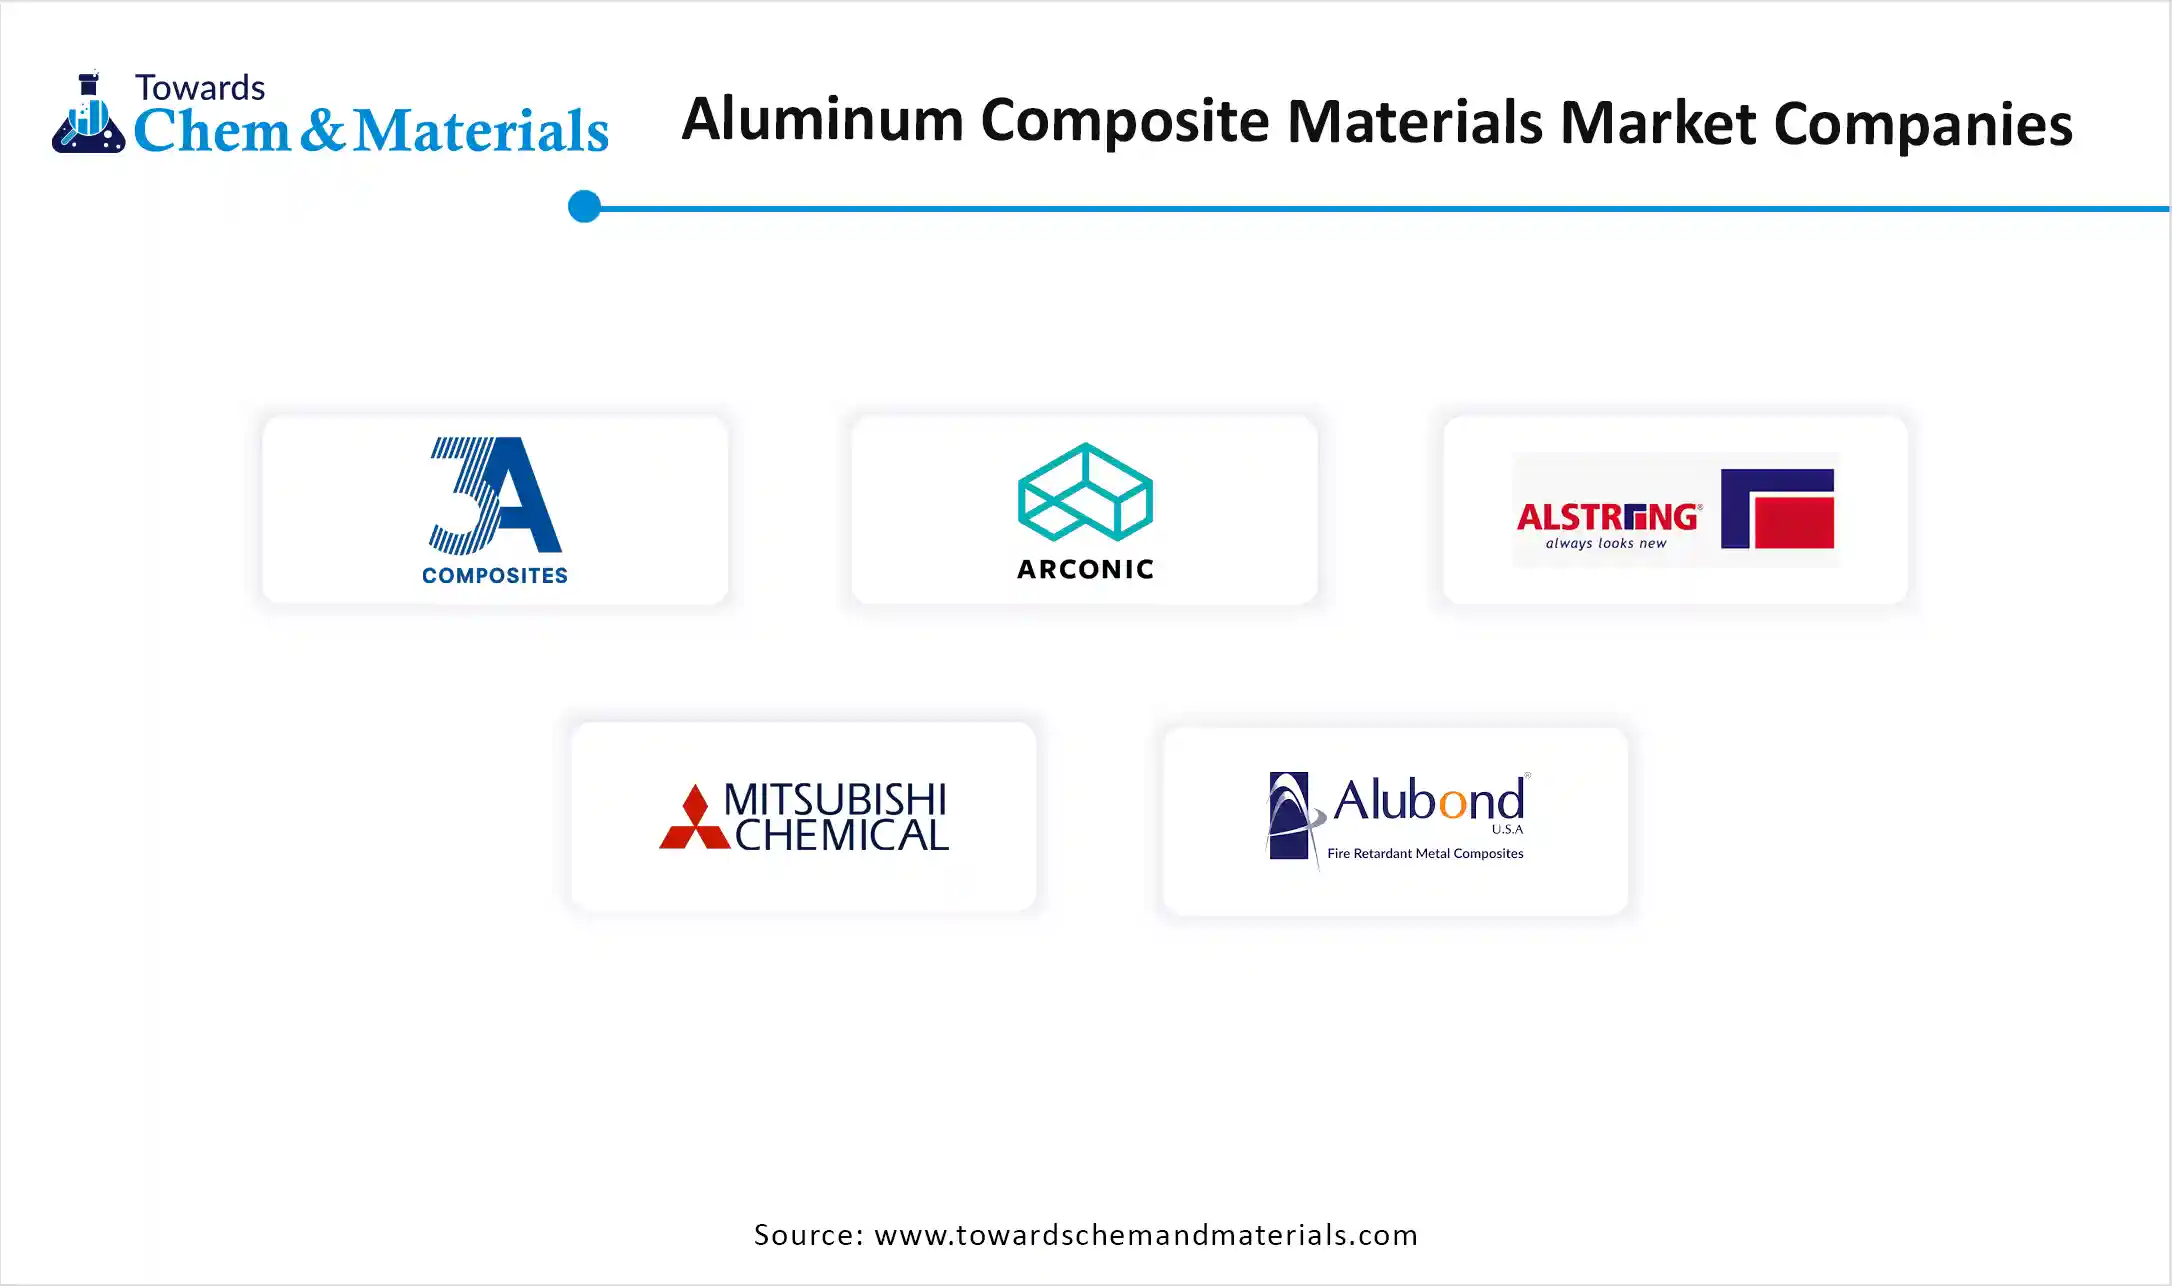
- 3A Composites GmbH
- Arconic Corporation
- Alstrong Enterprises India Pvt. Ltd.
- Mitsubishi Chemical Corporation
- Alubond U.S.A. (a brand of Mulk Holdings International)
- Yaret Industrial Group Co., Ltd.
- Shanghai Huayuan New Composite Materials Co., Ltd.
- Jyi Shyang Industrial Co., Ltd.
- Interplast Co. Ltd.
Segments Covered
By Core Material
- Polyethylene (PE) Core
- Fire-Resistant (FR) Core
- Aluminum Honeycomb Core
- Other Specialized Cores
By Panel Type
- Standard Panels
- Anti-Bacterial Panels
- Anti-Static Panels
- PVDF-Coated Panels
- Polyester-Coated Panels
- Other Specialty Panels
By End-User Industry
- Construction & Infrastructure
- Advertising & Media
- Transportation (Automotive, Railways, Aerospace)
- Industrial & Manufacturing
By Distribution Channel
- Direct Sales (to OEMs, construction companies)
- Distributors & Dealers
- Online Sales Channels
By Region
- North America
- U.S.
- Canada
- Europe
- Germany
- UK
- France
- Italy
- Spain
- Sweden
- Denmark
- Norway
- Asia Pacific
- China
- Japan
- India
- South Korea
- Thailand
- Latin America
- Brazil
- Mexico
- Argentina
- Middle East & Africa
- South Africa
- UAE
- Saudi Arabia
- Kuwait
A Seven-Phase Framework
Our methodology is designed to be universally applicable across commodity chemicals, specialty chemicals, petrochemicals, construction chemicals, coatings, electronic chemicals, industrial gases, agrochemicals, water treatment chemicals, and performance materials. Each phase builds upon the last, creating a layered validation structure that minimizes estimation error and maximizes analytical confidence.
The framework ensures comprehensive market coverage, robust cross-validation, and reliable long-term forecasting — producing market estimates that withstand scrutiny from investors, regulators, and corporate strategy teams.

Seven-Phase Framework — Analytical Effort Distribution
Relative analytical effort allocated across each phase of the Chemicals & Materials research framework

Phase 1 - Secondary Research: Establishing the Foundation
Secondary research collects and evaluates publicly available information from authoritative sources, establishing the foundational understanding of market structure, value chain dynamics, competitive landscape, and end-use demand patterns. Every source is evaluated for credibility, recency, geographic relevance, and methodological soundness before inclusion.
Industry Associations
Sources include ACC, CEFIC, ICCA, JCIA, CPCIF, and SOCMA providing production volumes, consumption trends, capacity developments, and sustainability initiatives.
Company Disclosures
Annual reports, investor presentations, earnings transcripts, and regulatory filings reveal product portfolios, manufacturing footprints, capacity expansions, and revenue segmentation.
Government Databases
National statistical offices, customs authorities, environmental agencies, and industrial production databases provide verified statistics on output, trade flows, and regulatory compliance.
Trade Databases
UN Comtrade, ITC, Eurostat, and national customs authorities enable assessment of global product movement, import dependency, and export competitiveness across regions.
Our Secondary Research Sources
- Ministry of Chemicals and Fertilizers
- European Chemicals Agency
- United States Department of Energy
- Ministry of Industry and Information Technology
- Ministry of Economy Trade and Industry
- Ministry of Trade Industry and Energy
- National Institute of Standards and Technology
- Council of Scientific and Industrial Research
- Fraunhofer Society
- National Institute for Materials Science
Phase 2 — Supply-Side Assessment: Mapping Production Capabilities
Production Capacity Analysis
All major manufacturers are assessed for existing installed capacity, planned additions, expansions, new plant announcements, and technology adoption — mapped at global, regional, and country levels.
Capacity Utilization Adjustment
Installed capacity is adjusted using utilization rates based on demand conditions, feedstock availability, plant operating rates, maintenance schedules, and regulatory restrictions.
Manufacturer Revenue Analysis
Product-specific revenues, segment-level performance, regional distribution, average selling prices, and margin trends are evaluated to establish market value estimates.
Supply-Side Assessment — Capacity vs. Effective Production by Region
Illustrative comparison of installed capacity vs. effective production volume (after utilization rate adjustment) across major regions

Phase 3 — Demand-Side Assessment: Quantifying Chemical Consumption
Demand-side analysis quantifies chemical consumption across industries, applications, and geographies — identifying where and how chemicals are consumed throughout the value chain with precision.
End-Use Industry Analysis
Chemical demand is evaluated across automotive, construction, packaging, electronics, agriculture, healthcare, consumer goods, industrial manufacturing, energy and utilities, and water treatment. Industry output, production trends, and consumption intensity are analyzed to determine demand patterns.
Consumption Modeling
Demand is estimated using measurable indicators: kilograms per vehicle, kilograms per square meter of construction, dosage per cubic meter of water treated, kilograms per hectare of agricultural land, and kilograms per ton of manufactured products. Consumption factors are validated through industry publications and primary interviews.
Application Analysis
The market is segmented by application area to understand product performance requirements, formulation trends, technology adoption, customer preferences, and regulatory requirements improving demand accuracy and segmentation granularity.
Demand-Side Assessment — End-Use Industry Demand Distribution
Illustrative distribution of chemical & materials demand across key end-use industries

Phase 4 - Trade Flow Analysis: Balancing Regional Supply and Demand
Trade flow analysis reconciles regional supply and demand estimates through import and export data, identifying net supply positions, regional dependencies, and market imbalances. It serves as an independent validation layer that tests the consistency of supply-side and demand-side estimates.
Import Analysis
Import data is evaluated to determine volumes, source countries, product dependency, regional supply gaps, and pricing trends — identifying markets that rely heavily on external supply and where domestic production is insufficient to meet demand.
Export Analysis
Export assessments reveal production surplus, export competitiveness, regional manufacturing strength, and global market participation. Export patterns also help validate domestic production estimates and identify net exporting regions.
Apparent Consumption Model
Regional consumption is assessed using the standard apparent consumption formula:
Results identify net importing regions, net exporting regions, regional deficits, and surpluses — serving as an independent validation of supply and demand estimates.
Trade Flow Analysis — Net Supply Position by Region
Illustrative apparent consumption vs. domestic production across major regions — positive gap indicates net import dependency

Phase 5 — Primary Research: The Critical Validation Layer
Primary research tests and refines findings from secondary research through direct engagement with industry participants across the supply chain, demand side, and expert community. It captures intelligence that no database or published report can provide — the real-world experience of manufacturers, buyers, and specialists operating in the market.

Supply-Side Interviews
Conversations with chemical manufacturers, raw material suppliers, contract manufacturers, technology providers, and plant operators cover production trends, capacity utilization, pricing developments, technology shifts, and competitive dynamics.

Demand-Side Interviews
Engagement with OEMs, industrial consumers, procurement managers, distributors, formulators, and end-use manufacturers focuses on consumption trends, purchasing behavior, product substitution, demand outlook, and emerging applications.

Industry Expert Consultations
Additional interviews with industry consultants, independent experts, regulatory specialists, technical professionals, and research institutions provide deeper market context and validate key analytical assumptions.
Focus Areas of Primary Research:
Market Size & Forecast Validation
Revenue estimates, volume consumption, growth rates, forecast assumptions, regional demand.Supply Chain & Value Chain Assessment
Raw material sourcing, supply chain challenges, distribution networks, procurement practices.Production & Capacity Analysis
Manufacturing capacity, utilization rates, expansion projects, plant investments.Pricing & Cost Structure Analysis
Product pricing trends, feedstock costs, energy costs, margin pressures, pricing outlook.Competitive Landscape Assessment
Volume and value estimates confirmed to be fully consistent with one another before publicationInterview Volume by Market Scope
| Study Scope | Number of Interviews |
|---|---|
| Niche Market | 20 – 30 |
| Mid-Sized Market | 30 – 50 |
| Global Market | 50 – 80 |
| Highly Fragmented Market | 80 – 120 |
Interview Details:
Category : Manufacturers, Suppliers, Distributors, End Users, Experts/Associations
Average Duration : 30–60 Minutes
Interview Mode : Video calls, telephonic interviews, expert consultations
Interview Format : Structured / Semi-Structured questionnaire
Focus Areas of Primary Research:
Market Size & Forecast Validation :
Revenue estimates, volume consumption, growth rates, forecast assumptions, regional demand.
Supply Chain & Value Chain Assessment :
Raw material sourcing, supply chain challenges, distribution networks, procurement practices.
Production & Capacity Analysis :
Manufacturing capacity, utilization rates, expansion projects, plant investments.
Pricing & Cost Structure Analysis :
Product pricing trends, feedstock costs, energy costs, margin pressures, pricing outlook.
Competitive Landscape Assessment :
Market share, competitor positioning, strategic initiatives, partnerships, acquisitions.
Primary Research — Stakeholder Coverage by Category
Distribution of interview respondents across stakeholder categories (% share from PPT data)

Primary Research — Respondent Designation Profile
Seniority breakdown of interview respondents (% share from PPT data)

Primary Research — Geographic Coverage of Interviews
Regional distribution of primary research engagement (% share from PPT data)

Phase 6 — Data Triangulation and Market Validation
No single methodology is relied upon in isolation. Multiple independent estimation approaches are combined and reconciled to ensure consistency, accuracy, and analytical defensibility. Any material deviations between approaches are investigated and adjusted through additional validation cycles.
The final market size is derived through weighted triangulation of all validated methodologies. Any material deviations between approaches are investigated and adjusted through additional validation cycles. The outcome represents the most realistic assessment of the market based on available evidence and expert confirmation ensuring that volume and value estimates are fully consistent with one another.
Triangulation Framework — Input Contribution Weight
Relative weight each sizing input contributes to the final reconciled market estimate

Phase 7 — Forecast Modeling: Projecting Future Market Evolution
Forecasting evaluates the future trajectory of the market using a combination of quantitative indicators and qualitative assessments across economic, industry, and regulatory dimensions. Rather than simple extrapolation, each driver is independently modeled and integrated into a composite forecast.
Macroeconomic Indicators
GDP growth, industrial production, manufacturing output, construction activity, consumer spending, and capital investment form the quantitative foundation of long-term demand projections. These are applied at country, regional, and global levels.
Industry Growth Drivers
Urbanization, infrastructure development, industrialization, technological innovation, sustainability initiatives, and evolving product performance requirements are assessed at regional and industry levels — capturing both structural and cyclical demand drivers.
Capacity Expansion Analysis
Announced plant expansions, new manufacturing facilities, technology upgrades, and strategic investments are evaluated to determine future supply-demand dynamics and potential market tightness or oversupply situations.
Regulatory & Sustainability
Environmental regulations, chemical safety standards, emission reduction targets, circular economy initiatives, and sustainability requirements are incorporated as they often influence product adoption rates and market growth trajectories.
Scenario Forecast Range — Indexed Market Growth (Year 1–10)
Illustrative indexed growth trajectories across Base, Optimistic, and Pessimistic scenarios over a 10-year forecast horizon

Forecast Drivers — Relative Impact Score by Category
Impact score (0–100) of each driver type on chemicals & materials market forecast




Comments
Share your thoughts, ask a question, or provide feedback about this report.