Content
U.S. Oil & Gas Infrastructure Market Size, Share, Growth and Forecast 2026-2035
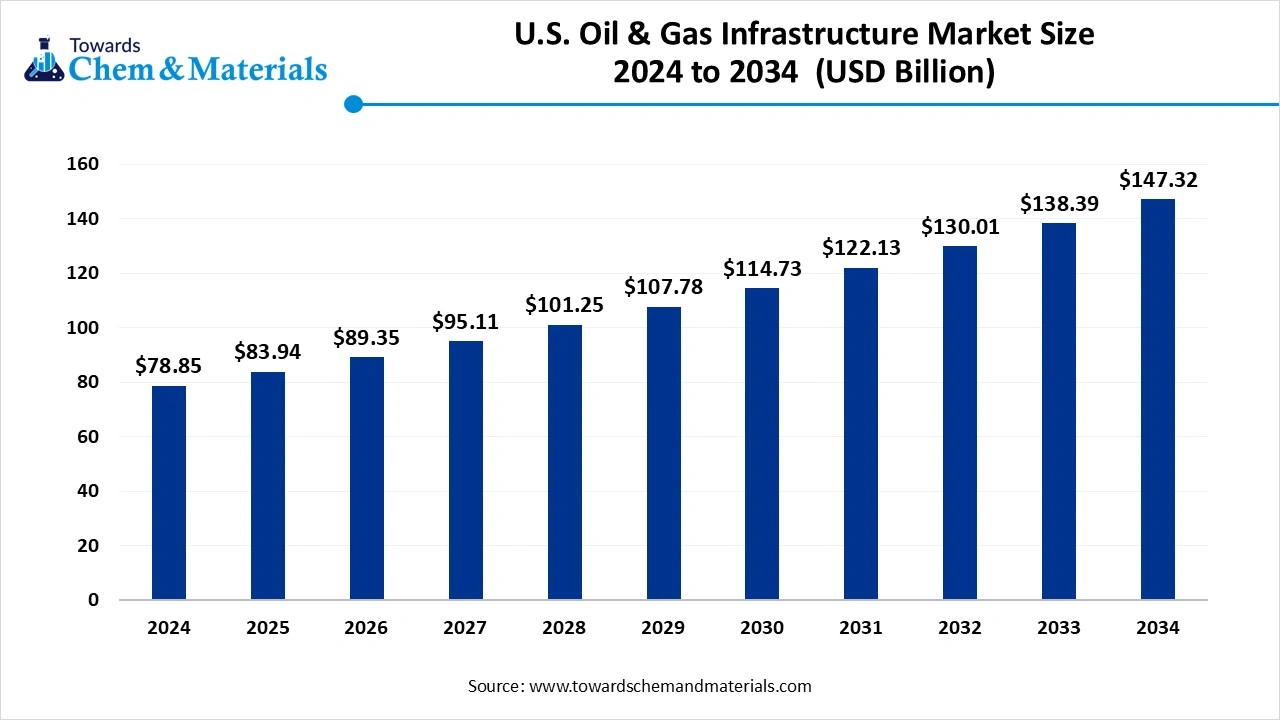
The U.S. oil & gas infrastructure market size is expected to grow from USD 83.94 billion in 2025 to USD 89.41 billion in 2026 and is forecast to reach USD 157.86 billion by 2035 at a 6.52% CAGR over 2026-2035. The booming natural gas, increasing energy demand, and focus on energy independence drive the market growth. ")
Key Takeaways
- Southwest held a 37% share in the U.S. oil & gas infrastructure market in 2024 due to the presence of abundant resources.
- Midwest is growing at the fastest CAGR in the market during the forecast period due to the well-developed refining hub.
- By sector, the midstream segment held a 43% share in the market in 2024 due to the presence of extensive pipeline networks.
- By sector, the LNG export facilities segment is expected to grow at the fastest CAGR in the market during the forecast period due to the growing demand for LNG.
- By infrastructure type, the interstate pipelines segment held a 38% share in the market in 2024 due to the strong network of interstate pipelines.
- By infrastructure type, the gas processing & liquefaction plants segment is expected to grow at the fastest CAGR in the market during the forecast period due to the heavy investment in liquefaction terminals.
- By fuel type, the natural gas segment held a 47% share in the market in 2024 due to the lower prices of natural gas.
- By fuel type, the LNG & NGLs segment is expected to grow at the fastest CAGR in the market during the forecast period due to the focus on cleaner energy sources.
- By material, the high-strength carbon steel segment held a 56% share in the U.S. oil & gas infrastructure market in 2024 due to the increasing need for drilling equipment.
- By material, the composites & corrosion-resistant alloys segment is expected to grow at the fastest CAGR in the market during the forecast period due to the growing development of offshore platforms.
- By ownership, the independent midstream operators segment held a 44% share in the market in 2024 due to the strong presence of independent midstream companies.
- By ownership, the PE-backed infrastructure developers segment is expected to grow at the fastest CAGR in the market during the forecast period due to the growing integration with digital technologies.
- By application, the industrial consumption segment held a 35% share in the market in 2024 due to the well-established industrial base.
- By application, the export-oriented infrastructure segment is expected to grow at the fastest CAGR in the market during the forecast period due to the increasing offshore exploration.
From Transport to Storage: The Power of U.S Oil & Gas Infrastructure
The U.S. oil & gas infrastructure consists of physical facilities for the production, refining, transportation, exploration, processing, distribution, and storage of natural gas and oil. The infrastructure components are upstream, midstream, and downstream processes. The infrastructure includes refineries, drilling rigs, pipelines, processing plants, and storage tanks. The U.S consists of about 3 million miles of natural gas pipelines.
The well-established oil & gas infrastructure lowers the energy cost. The extensive oil & gas infrastructure helps the United States in heating, cooling, and transportation applications. The growing demand for energy increases the demand for oil & gas infrastructure. Factors like growing refinery activities, increasing petrochemical activities, technological advancements, growing production of natural gas, and rising export of LNG contribute to the growth of the U.S. oil & gas infrastructure market.
- According to the American Petroleum Institute, the United States has transverse of more than 190000 miles of liquid petroleum pipelines.(Source: www.api.org )
- As per the U.S. Energy Information Administration, the total number of operable refineries was
- 132 in the United States in 2024.(Source: www.eia.gov )
- The United States exported $41.8B of liquified natural gas in 2023. (Source: oec.world)
- The United States exported $118B of refined petroleum in 2024.(Source: oec.world)
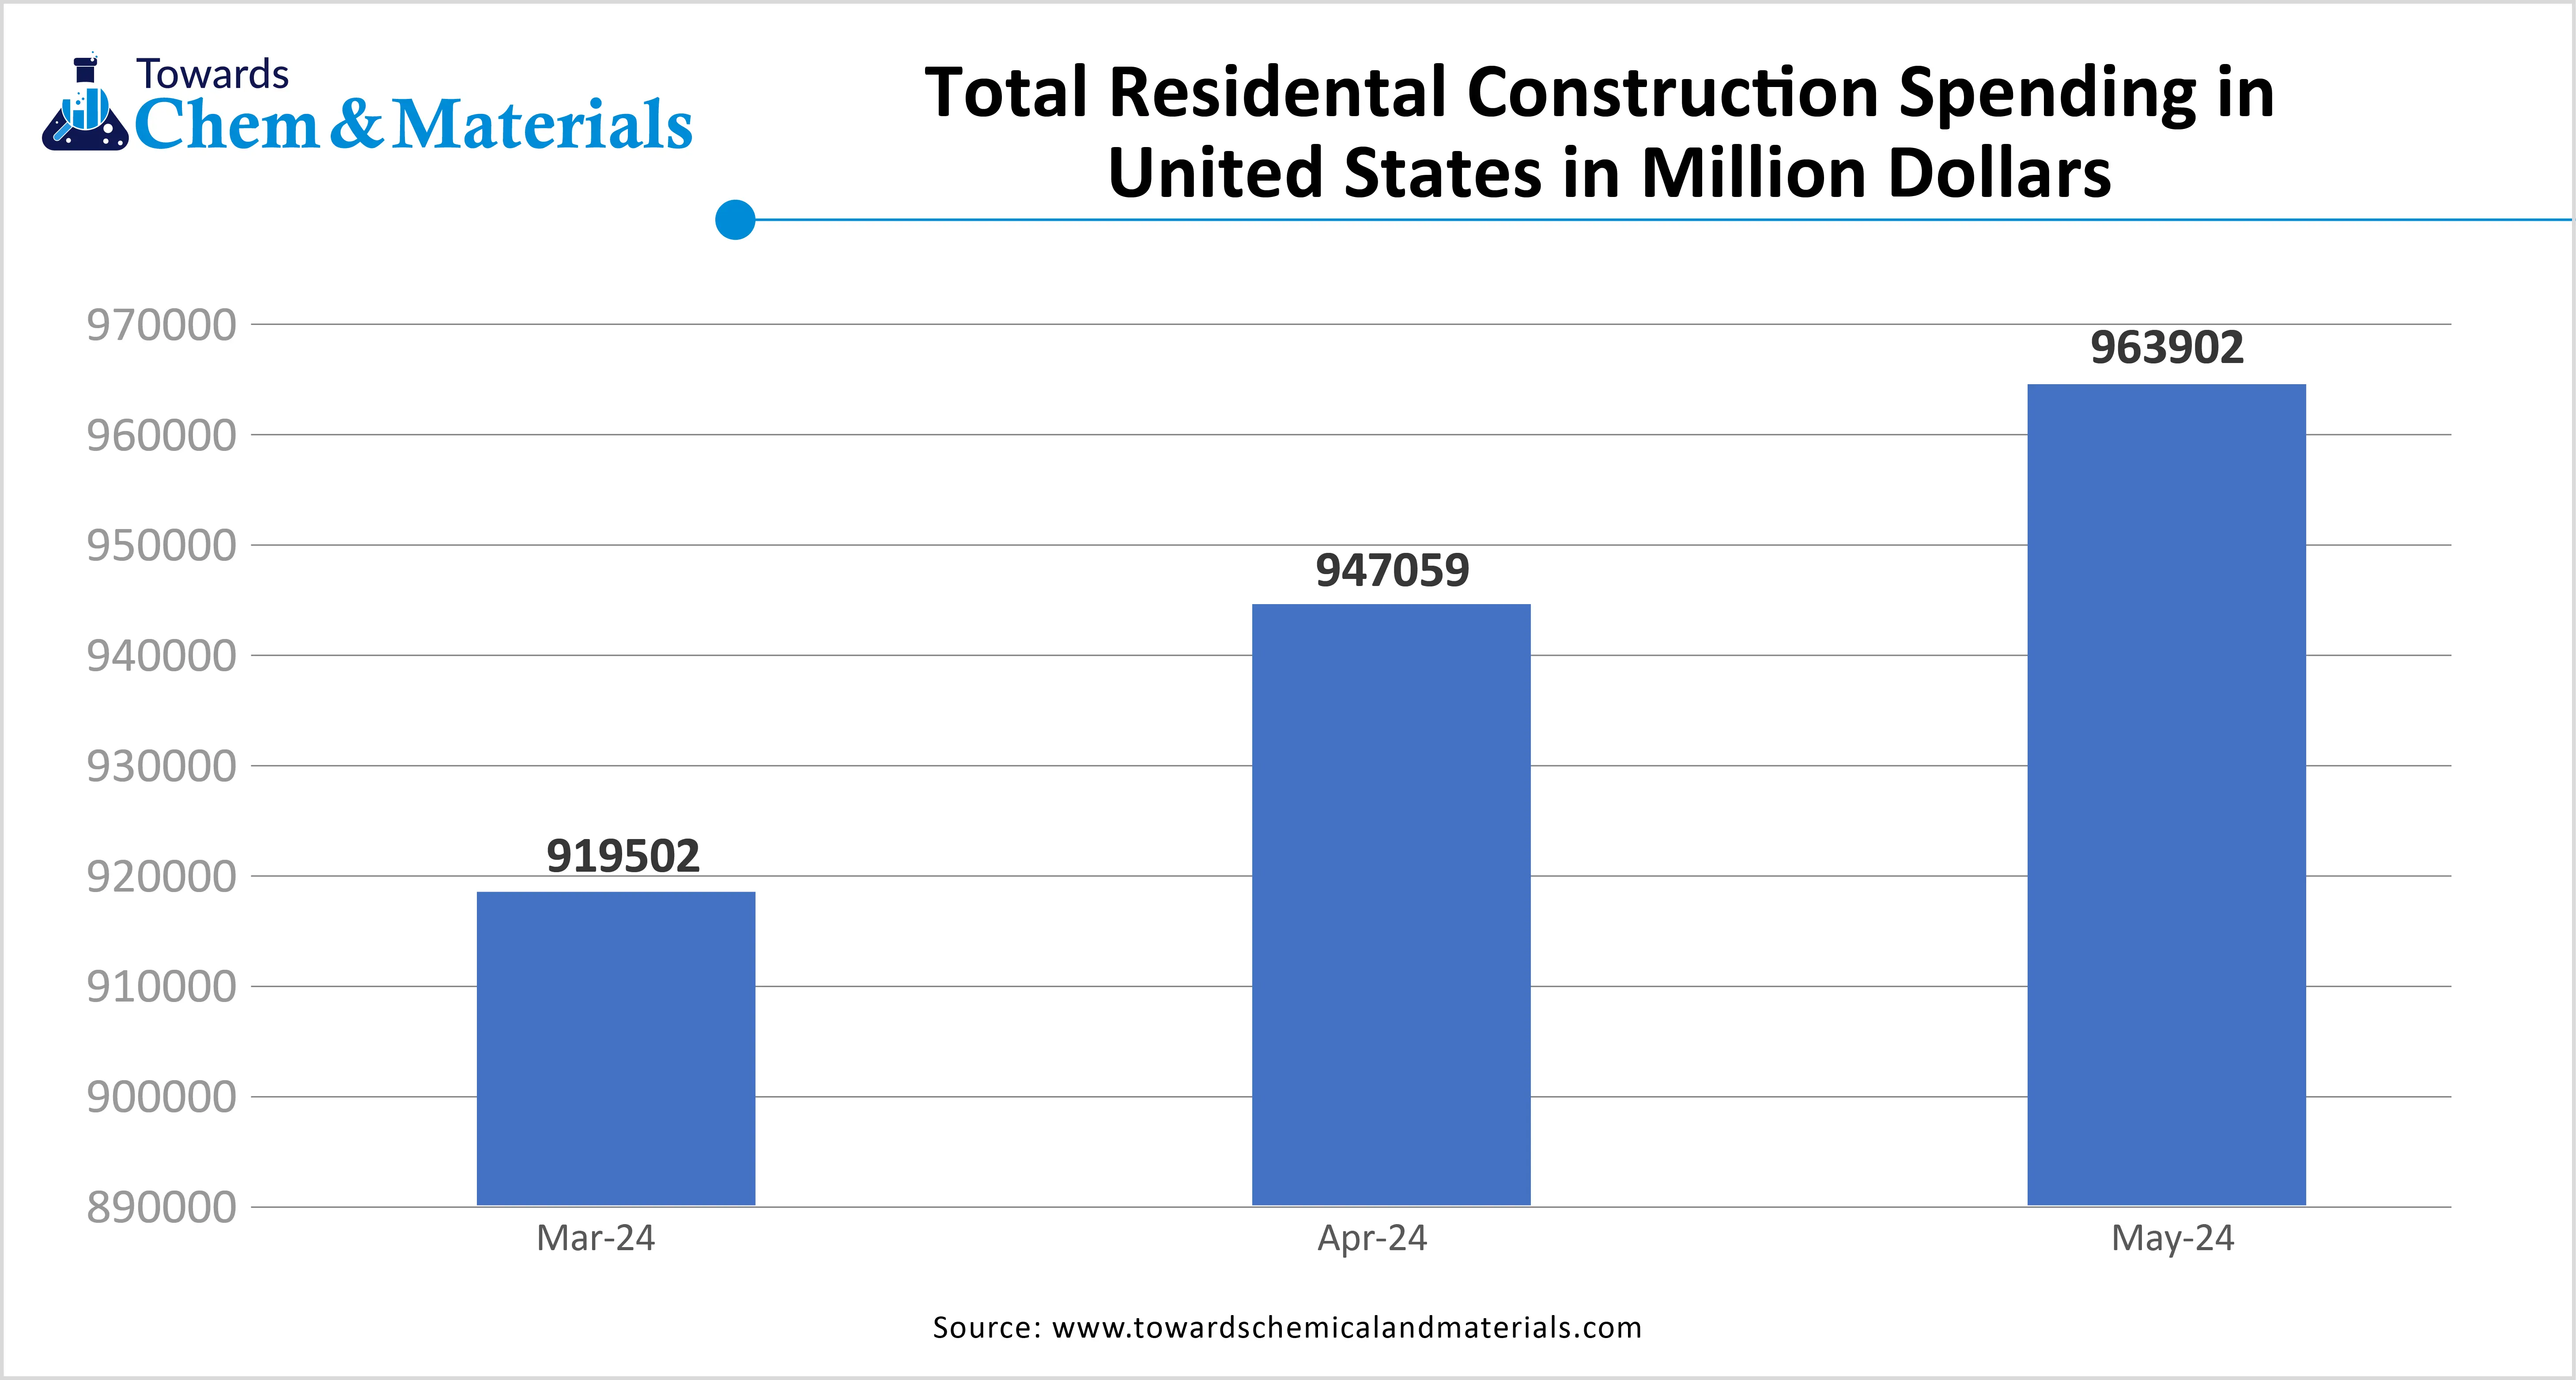
The Growing Residential Sector is Driving Market Growth
The growing residential sector in the United States increases demand for energy for various purposes, which requires oil & gas. The growing population increases the development of residential buildings requires energy. The increasing consumption of energy for cooling and heating applications in the residential sector fuels demand for oil & gas infrastructure. The increasing number of households fuels demand for energy for powering electronics and a wide range of appliances, which require heating & cooling. The growing need for heating systems in residential construction increases demand for fuel oil, which requires extensive pipelines.
The increasing demand for ovens and stovetops for cooking fuels the demand for natural gas, which requires well-established oil & gas infrastructure. The growing demand for electricity generation, water heating, and other household applications requires extensive infrastructure for natural gas. The growing residential sector is a key driver for the U.S. oil & gas infrastructure market.

Market Trends
- Growing LNG Export:- The increasing United States investment in LNG export and the growing export of LNG increases demand for the development of oil & gas export infrastructure.
- The Increasing Energy Demand:- The rapid urbanization and growing energy demand in the United States increase demand for oil & gas. The growing expansion of the energy sector increases focus on the expansion of the oil & gas infrastructure.
- Booming Natural Gas:- The booming natural gas demand increases the production of natural gas, which requires extensive infrastructure for storing, transporting, and processing natural gas.
Report Scope
| Report Attribute | Details |
| Market Size in 2026 | USD 89.41 Billion |
| Expected Size by 2035 | USD 157.86 Billion |
| Growth Rate from 2025 to 2034 | CAGR 6.52% |
| Base Year of Estimation | 2025 |
| Forecast Period | 2025 - 2035 |
| Segment Covered | By Sector, By Infrastructure Type, By Fuel Type, By Material Type, By Ownership/Operator,By Application, By Region |
| Key Companies Profiled | Kinder Morgan Inc., Enbridge Inc. (U.S. Operations), Energy Transfer LP, Williams Companies Inc., Cheniere Energy Inc., Enterprise Products Partners LP, Plains All American Pipeline LP, ONEOK Inc., MPLX LP (Marathon Petroleum), Chevron Corporation, ExxonMobil Corporation, Phillips 66, TC Energy Corp (U.S. Assets), Tellurian Inc., NextDecade Corporation |
Market Opportunity
The Growing Transportation Sector Surge Demand for Oil & Gas
The growing transportation sector in the United States increases demand for oil & gas for various applications. The growth in transportation, like maritime travel, road travel, and air travel, increases demand for diesel & gasoline derived from oil & gas. The growing industrialization fuels demand for transportation, which requires different kinds of fuels. The increasing demand for vehicles like trucks, ships, cars, and airplanes requires a higher number of primary fuels like gasoline & diesel.
The focus on infrastructure development, like roads, railways, and others, helps in the growth of the transportation sector. The aviation, road, and shipping vehicles increase demand for fuels derived from oil & gas. The higher demand for transportation services increases demand for oil & gas. The growing transportation sector creates an opportunity for the U.S. oil & gas infrastructure market.
Market Challenge
High Development Cost Limits Expansion of Market
Despite several benefits of the oil & gas infrastructure in the United States, the high development cost restricts the market growth. Factors like complex extraction & exploration process, need for specialized equipment, integration of advanced technologies, stricter environmental regulations, and complexity in supply chains are responsible for high development cost. The complex exploration processes, like drilling test wells and seismic studies, increase the cost.
The need for advanced recovery methods and specialized drilling equipment requires high cost. The need for various machinery for applications like extraction, transportation, drilling, and processing increases the development cost. The stricter environmental regulations require extensive investment. The complex supply chain operations, like specialized services, sourcing materials, and equipment, require higher costs. The high development cost hampers the growth of the U.S. oil & gas infrastructure market.
Regional Insights
How Southwest Dominated the U.S. Oil & Gas Infrastructure Market?
The Southwest dominated the U.S. oil & gas infrastructure market. The presence of abundant resources like the Gulf of Mexico and the Permian Basin in the region helps the market growth. The extensive network of pipelines for the transportation of gas and oil increases the development of oil & gas infrastructure. The increasing production of oil & gas fuels the development of oil & gas infrastructure. The well-established infrastructure for refining & storage of oil & gas drives the overall growth of the market.
Why is the Midwest experiencing the Fastest Growth in the U.S. Oil & Gas Infrastructure Market?
The Midwest is experiencing the fastest growth in the market during the forecast period. The well-established refining hub to produce imported crude and crude oil increases production of refined products, gasoline, and diesel, helping the market growth. The presence of strong pipeline infrastructure and efficient transportation of natural gas & crude oil helps the market growth. The growing technological advancements, like real-time monitoring and automation, focus on the development of new oil & gas infrastructure. The well-established midstream infrastructure, like processing plants, pipelines, and storage facilities, supports the overall growth of the market.
Segmental Insights
Sector Insights
Why the Midstream Segment Dominates the U.S. Oil & Gas Infrastructure Market?
The midstream segment dominated the U.S. oil & gas infrastructure market in 2024. The growth in the production of oil & gas in regions like the Permian Basin increases demand for midstream operations. The presence of a strong pipeline network and efficient transportation infrastructure helps the market growth. The well-established storage facilities for natural gas & crude oil help in the midstream operations. The ongoing technological advancements in pipeline monitoring, like IoT & digital twins, and growing consumption of energy drive the market growth.
The LNG export facilities segment is the fastest-growing in the market during the forecast period. The development of advanced technologies like horizontal drilling and hydraulic fracturing increases the LNG exports. The increasing demand for cleaner energy sources and the focus on the security of energy are increasing LNG exports. The stricter regulatory frameworks and supportive government policies help the LNG exports. The increasing LNG demand and focus on lowering reliance on traditional suppliers support the market growth.
Infrastructure Type Insights
How Interstate Pipelines Segment Held the Largest Revenue Share of the U.S. Oil & Gas Infrastructure Market?
The interstate pipelines segment held the largest revenue share of the market in 2024. The growing oil & gas production in states like Louisiana and Texas increases demand for interstate pipelines. The increasing demand for transporting a high amount of oil & gas over long distances increases demand for interstate pipelines. The growing industrial expansion and consumption of energy increase demand for interstate pipelines for the transportation of oil & gas. The interstate pipeline's connection with the end user, production basin, and processing plants drives the market growth.
The gas processing & liquefaction segment is the fastest-growing in the market during the forecast period. The presence of natural gas resources like Haynesville, Marcellus, and Permian Basins increases demand for gas processing and liquefaction. The focus on minimizing carbon emissions and a sustainable energy future fuels demand for gas processing & liquefaction. The expansion of the midstream sector, like distribution, transportation, and storage, increases demand for gas processing & liquification. The growing investment in liquefaction terminals and technological advancements in liquefaction technology support the market growth.
Fuel Type Insights
Why did the Natural Gas Segment Dominate the U.S. Oil & Gas Infrastructure Market?
The natural gas segment dominated the U.S. oil & gas infrastructure market in 2024. The abundant reserves of natural gas and increasing export of natural gas help the market growth. Technological advancements like fracking and horizontal drilling increase the extraction of natural gas. The extensive pipeline network for the transportation of natural gas helps the market growth. The growing industrial sector increases demand for natural gas for purposes like heating and other processes. The lower cost of natural gas and growing demand in commercial & residential buildings drive the overall growth of the market.
The LNG & NGLs Segment is the fastest-growing in the market during the forecast period. The growing investment in LNG pipelines and LNG facilities increases demand for LNG & NGLs. The growing technological advancements in storage, production, and transportation increase demand for LNG & NGLs. The growing transportation, power generation, and industrial processes increase demand for LNG and NGLs. The shift towards cleaner energy sources and increasing applications in the petrochemical industry supports the overall growth of the market.
Material Type Insights
How High-Strength Carbon Steel Segment Held the Largest Share in the U.S. Oil & Gas Infrastructure Market?
The high-strength carbon steel segment held the largest revenue share of the market in 2024. The growing development of offshore and onshore pipelines increases demand for high-strength carbon steel. The increasing development of drilling equipment, like drill pipes, drilling rigs, and others, increases demand for high-strength carbon steel. The increasing construction of large storage tanks for storing refined products and crude oil is fueling demand for high-strength carbon steel. These steels possess high strength and affordable choice for large-scale infrastructure projects. High-strength carbon steel is easily available and used in various applications. The growing demand for high-strength carbon steel in refinery equipment like pressure vessels, heat exchangers, and others drives the market growth.
The composites & corrosion-resistant alloys segment is the fastest-growing in the U.S. oil & gas infrastructure market during the forecast period. The focus on the development of flowlines and pipelines increases demand for composites. The composites and corrosion resistance consist of excellent corrosion resistance and have a superior strength-to-weight ratio. They lower maintenance requirements and provide a flexible design. The increasing development of offshore platforms like risers, deck structures, and piping fuels demand for composites and corrosion-resistant alloys. The growing development of storage tanks, onshore & offshore pipelines, and transportation systems requires composites & corrosion-resistant alloys, supporting the overall growth of the market.
Ownership/Operator Insights
Why did Independent Midstream Operators Segment Dominate the U.S. Oil & Gas Infrastructure Market?
The independent midstream operators segment dominated the market in 2024. The growing companies' investment in private pipelines and storage facilities increases the adoption of independent midstream. The focus on storage and transportation of oil & gas helps the market growth. The quicker adoption of change and growing energy demand increases demand for midstream operators. The presence of key companies like EQT Midstream Partners, Magellan Midstream Partners, and Hess Midstream drives the market growth.
The PE-backed infrastructure developers segment is the fastest-growing in the U.S. oil & gas infrastructure market during the forecast period. The increasing fundraising activities for the development of complex projects increase the adoption of PE-backed infrastructure developers. The growing investment of PE developers in the energy-related infrastructure, renewable energy, and energy storage helps the market growth. The increasing investment in downstream and midstream applications of oil & gas infrastructure helps the market growth. The focus on optimizing existing infrastructure and integration with technologies like data analytics, AI, and automation supports the overall growth of the market.
Application Insights
Which Application Held the Largest Share in the U.S. Oil & Gas Infrastructure Market?
The industrial consumption segment held the largest revenue share of the U.S. oil & gas infrastructure market in 2024. The growing demand across industries for a continuous supply of energy increases the demand for oil & gas. The growing industrial processes in sectors like manufacturing, chemicals, and plastics increase the adoption of oil & gas. The increasing demand for oil & gas feedstocks in industrial processes helps the market growth. The strong industrial base and growing expansion of industries drive the market growth.
The export-oriented infrastructure segment is the fastest-growing in the market during the forecast period. The increasing investment in LNG facilities and growing export of LNG help the market growth. The growing expansion of LNG infrastructure, like export pipelines & liquefaction terminals, increases demand for export-oriented infrastructure. The growing offshore production & exploration of oil & gas, and supportive government policies, support the market growth.
Recent Developments
- In May 2025, Amplify ETFs and Samsung Asset Management launched the Amplify Samsung U.S. natural gas infrastructure ETF (USNG). The USNG invests in upstream, midstream, and downstream applications in approximately 20 to 25 natural gas facilities.(Source: www.globenewswire.com)
- In January 2025, Shell started production at Whale in the U.S. Gulf of Mexico. Whale offers a simplified Vito platform, and the production capacity is more than 500000 barrels. It consists of energy-efficient compression systems and gas turbines.(Source: www.shell.com)
- In July 2025, BP agrees to sell its US onshore wind business to LS Power. The company focuses on minimizing carbon emissions and increasing its operating fleet to ~4.3GW. The aim is to improve existing energy assets and make energy available.(Source: www.bp.com)
U.S. Oil & Gas Infrastructure Market Top Companies

- Kinder Morgan Inc.
- Enbridge Inc. (U.S. Operations)
- Energy Transfer LP
- Williams Companies Inc.
- Cheniere Energy Inc.
- Enterprise Products Partners LP
- Plains All American Pipeline LP
- ONEOK Inc.
- MPLX LP (Marathon Petroleum)
- Chevron Corporation
- ExxonMobil Corporation
- Phillips 66
- TC Energy Corp (U.S. Assets)
- Tellurian Inc.
- NextDecade Corporation
Segments Covered
By Sector
- Upstream
- Midstream
- Downstream
By Infrastructure Type
- Interstate & Intrastate Pipelines
- Gathering & Transmission Networks
- LNG Export & Import Terminals
- Compressor & Pump Stations
- Storage Tanks & Underground Caverns
- Gas Processing Plants
- Refining Facilities
- Retail Fuel Distribution Terminals
By Fuel Type
- Crude Oil
- Natural Gas
- Liquefied Natural Gas (LNG)
- Refined Petroleum Products
- Natural Gas Liquids (NGLs)
- Liquefied Petroleum Gas (LPG)
By Material Type
- High-Strength Carbon Steel
- Polyethylene/HDPE
- Stainless & Corrosion-Resistant Alloys
- Composite & Non-Metallic Materials
By Ownership/Operator
- Integrated Oil Companies (IOCs)
- Independent Midstream Operators
- National Oil Companies (NOCs – limited in the U.S.)
- Private Equity-Backed Infrastructure Firms
- EPC Contractors & Engineering Firms
- Federal & State Regulatory Bodies (FERC, PHMSA)
By Application
- Export (LNG, Crude Oil, Refined Products)
- Domestic Power Generation
- Industrial Consumption
- Residential & Commercial Heating
- Transportation (Marine, Aviation, Road Fuels)
By Region
- Northeast (e.g., Pennsylvania, New York, New Jersey)
- Southwest (e.g., Texas, New Mexico, Oklahoma)
- West (e.g., California, Colorado, Wyoming)
- Southeast (e.g., Louisiana, Alabama, Georgia, Florida)
- Midwest (e.g., Illinois, Ohio, Indiana, Michigan)
FAQ's
Select User License to Buy
Figures (3)