Find the Right Market Report
Search thousands of industry reports, market insights, and research studies in one place.
Not sure where to start? Try one of these:
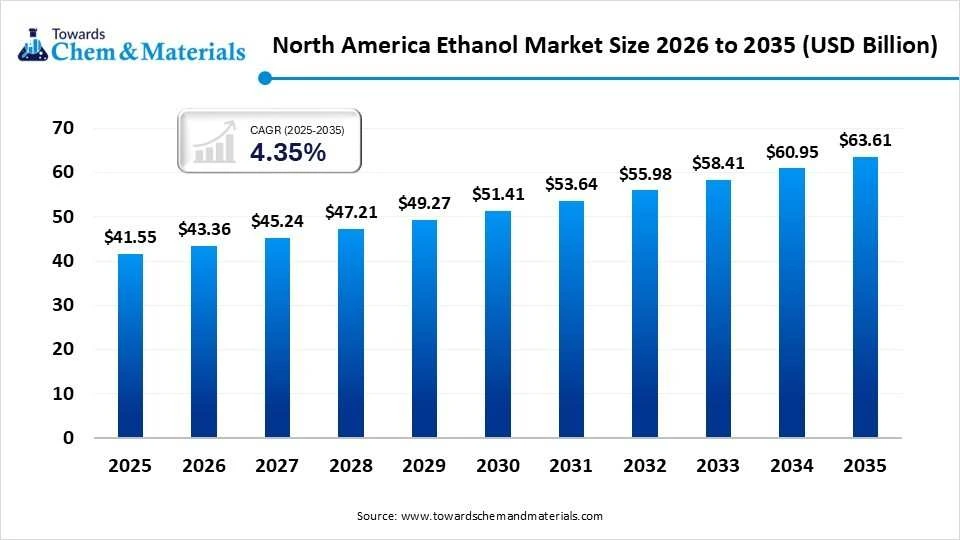
The North America ethanol market size was valued at USD 41.55 billion in 2025 and is projected to grow from USD 43.36 billion in 2026 to USD 63.61 billion by 2035, exhibiting a CAGR of 4.35% during the forecast period. With blending volumes capped by the E10 blend wall, growth is shifting toward E15 and E85 expansion, record exports, co-product monetization, and low-carbon premiums linked to carbon-intensity scoring.
Corn-based dry-mill production accounts for more than 95% of output, and the top five producers control an estimated 40-50% of capacity. The report quantifies the market by feedstock, process, blend level, application, carbon intensity, and geography. It also covers pricing, demand-supply balance, trade, technology, regulation, M&A, and profiles of 22 leading companies, with base, upside, and downside scenarios to 2035.
The U.S. accounts for approximately 90% of regional production, with Canada contributing most of the remainder and Mexico a small but strategically watched import market. Annual U.S. output has plateaued near 16 billion gallons (about 1.0-1.1 million barrels per day) against nameplate capacity of roughly 17.5-18.5 billion gallons. E10 now covers more than 95% of gasoline sold, so blending-volume growth is structurally capped by the blend wall. Growth is therefore shifting to three levers: higher-ethanol blends (E15, E85), exports, and low-carbon premiums tied to carbon-intensity (CI) scoring. Corn-based dry-mill ethanol is the dominant segment, accounting for more than 95% of volume.
The market is moderately concentrated. The top five producers control an estimated 40-50% of capacity, while a long tail of farmer-owned and regional producers operates across more than 170 active plants.The full report quantifies the market across feedstock, process technology, blend level, end-use, co-product stream, state/province, and company.
The full report quantifies each driver’s impact on volume and margin, with timelines and probability weighting.
Wholesale fuel ethanol prices have ranged from approximately USD 1.50–2.50 per gallon over the past five years, reflecting changes in gasoline prices, corn costs, and export demand. Corn represents 55–70% of cash operating costs, while natural gas accounts for 8–12%, making feedstock procurement and energy efficiency central to plant economics. Revenue from distillers dried grains with soluble (DDGS) and corn oil typically offsets 25–35% of corn costs, providing an important buffer against input-price volatility. Plant gross margins have ranged from low single digits to above 15% in strong years, demonstrating the sensitivity of profitability to the combined movement of selling prices, input costs and co-product revenues.
Our analysis indicates that fuel ethanol profitability is driven more by the interaction of input costs, co-product credits and realized selling prices than by ethanol prices alone. Regional price differentials reinforce this dynamic: Midwest prices generally remain 10–40 cents per gallon below coastal and export-linked markets, while long-haul rail and barge transportation can add 10–25 cents per gallon. These costs can erode the benefits of higher destination-market prices, while West Coast low-carbon markets may offer additional value to qualifying producers. Our assessment is that plants with efficient corn procurement, strong co-product recovery and access to advantaged logistics or low-carbon markets are better positioned to protect margins through commodity-price cycles.
In our view, the most significant strategic implication is that ethanol producers must optimize netback economics rather than pursue selling-price maximization alone. Gasoline ethanol price relationships, E15 retail discounts and carbon-credit prices influence revenue realization and market competitiveness, while price pass-through and demand elasticity determine how effectively cost changes can be absorbed by downstream buyers. We believe these factors create distinct profitability opportunities for producers that can combine operational efficiency with access to premium markets and favorable carbon-credit economics. However, the extent of these advantages depends on regional market conditions, applicable low-carbon fuel frameworks and the relative movement of corn, natural gas and gasoline prices.
The full report provides a deeper quantitative assessment of historical ethanol pricing, feedstock and energy cost contributions, co-product revenue offsets, regional price spreads, transportation costs and plant gross-margin variability. It also examines ethanol–gasoline price relationships, E15 retail discount dynamics, carbon-credit pricing, cost pass-through, and price elasticity to identify the factors most likely to influence producer profitability and regional competitiveness. Where granular data are available, these indicators can also be organized into a structured pricing and profitability dataset, tracking price benchmarks, cost components, co-product offsets, regional differentials, logistics costs, carbon-credit values and margin indicators by geography and period. This enables cross-regional benchmarking, historical trend analysis, and more systematic evaluation of the commercial drivers behind ethanol margin performance.
Domestic consumption is approximately 13.5-14.5 billion gallons, against production of about 16 billion. The structural surplus is absorbed by exports, which have reached record levels. Capacity utilization is typically 88-95%. Corn use for ethanol is approximately 5.4-5.6 billion bushels, or 35-37% of the U.S. corn crop. DDGS output is roughly 35-38 million tons. Capacity additions are modest and mostly limited to debottlenecking and efficiency upgrades.New greenfield plants are rare.
The full report provides plant-level capacity, state-by-state balances, inventory cycles, and import dependency across Canada and Mexico.
The fuel ethanol value chain connects corn growers and grain handlers with ethanol producers, marketers, storage terminals, blenders, refiners, retailers and export buyers. Although each participant contributes to product movement and market access, their ability to capture value differs considerably. Corn suppliers operate in a commodity-driven environment where prices fluctuate with crop availability and agricultural market conditions, while ethanol producers face cyclical margins influenced by feedstock costs, plant efficiency, energy consumption and revenue from co-products. Marketing and blending activities generally offer more stable but relatively modest margins, whereas low-carbon credit generation is emerging as an additional source of value for producers and market participants that qualify under applicable regulatory frameworks.
The distribution network is equally important in determining the economics of the industry. Rail-dependent supply chains can face constraints in unit-train availability, tank-car access, terminal capacity, and transportation scheduling, affecting both delivered costs and the ability to reach attractive end markets. These bottlenecks can reduce the benefits of favorable regional pricing, particularly when production is concentrated away from major consumption centers or export terminals. Producers with reliable logistics arrangements, access to storage infrastructure and diversified routes to market may therefore achieve stronger netbacks than competitors with similar production costs but fewer distribution options.
From a commercial perspective, value capture increasingly depends on how effectively participants coordinate physical operations with market access and environmental attributes. Efficient plants can improve returns through higher operating performance and co-product monetization, while marketers and blenders derive value from distribution networks, customer relationships and supply reliability. Meanwhile, low-carbon credit opportunities introduce another potential earnings stream, although returns depend on eligibility requirements, carbon-intensity performance, credit prices and the regulatory framework in each market. The strategic challenge is to distinguish recurring operational advantages from margin opportunities that fluctuate with commodity cycles or policy changes.
The full analysis quantifies cost contribution, margin pools, supplier concentration, and logistics economics.
Annual U.S. ethanol exports have risen to roughly 1.8-2.0 billion gallons, with Canada, major Asian markets, and several European and Latin American buyers among the largest destinations. Imports are small, with Brazilian sugarcane ethanol entering selectively, particularly where low-carbon credit programs create demand. Tariff changes in major destination markets can move export volumes by hundreds of millions of gallons in a single year.
Mature dry-mill technology yields roughly 2.8-3.0 gallons of ethanol per bushel of corn. Innovation is focused on:
The regulatory framework combines federal blending mandates, state low-carbon fuel standards, and tax incentives tied to lifecycle emissions. Key issues include year-round E15 authorization, land-use change modeling, and the treatment of climate-smart agriculture in CI scoring. Compliance credit values can add several cents to tens of cents per gallon for low-CI producers. The full analysis quantifies the economic impact of each policy scenario.
Demand is concentrated among refiners and fuel blenders, with retail stations and export buyers as secondary channels. Purchasing is driven by price, delivered logistics, octane value, credit compliance, and CI scores. Switching costs are low in commodity grades but rising for low-carbon contracts. The full report provides customer share, application CAGR, and unmet needs.
The fuel ethanol industry is characterized by a mix of integrated agribusiness and refiner-owned platforms, large independent producers, farmer-owned cooperatives and limited liability companies (LLCs), and Canadian producers. The top five producers account for an estimated 40–50% of industry capacity, while the top ten control approximately 60–65%, indicating a moderately concentrated market in which scale and operational capabilities influence competitive positioning. Larger producers benefit from stronger corn procurement networks, established logistics infrastructure, broader marketing access, and greater capacity to finance operational improvements. However, market concentration does not eliminate opportunities for smaller participants, particularly where local feedstock access, plant-level efficiency, or differentiated low-carbon performance can offset disadvantages in scale.
Our analysis indicates that competitive advantage in fuel ethanol is increasingly determined by the ability to combine cost efficiency with market access and product differentiation. Integrated producers can coordinate feedstock sourcing, processing and downstream distribution, potentially improve cost control and reduce exposure to logistical disruptions. Independent producers, by contrast, must rely more heavily on operational discipline, procurement strategies, and the ability to achieve attractive carbon-intensity (CI) scores. Farmer-owned cooperatives and LLC-based operations can benefit from regional agricultural relationships and established local supply networks, although their marketing reach and access to capital may be more constrained. Canadian producers add a distinct regional dimension, with their competitive position shaped by local feedstock economics, distribution access and applicable policy frameworks.
In our view, the most significant implication is that scale alone will not determine long-term competitiveness; the ability to translate structural advantages into consistently stronger plant margins will be equally important. Larger producers may be better positioned to manage commodity volatility and invest in logistics or efficiency improvements, while independent operators can defend their position through lower operating costs, reliable regional sourcing and carbon-intensity differentiation where market mechanisms reward it. Cooperatives may retain strategic relevance through dependable local supply relationships, but their ability to capture value beyond regional markets will depend on commercial partnerships and distribution access. The relative attractiveness of these business models therefore needs to be assessed against operating performance, market exposure and access to higher-value demand channels.
The full report provides a deeper competitive assessment of producer capacity, market concentration, operating models, regional positioning and the structural factors influencing profitability. Where data are available, the analysis can also be organized into a structured competitive intelligence dataset tracking producer name, ownership model, location, installed capacity, capacity share, operating footprint, integration level and relevant carbon-intensity positioning.
| Sr.no | Company | HQs | Market Position | Core Strength | Major Segments |
| 1 | POET | Sioux Falls, SD | Largest producer | Scale, operations | Fuel, co-products |
| 2 | Archer-Daniels-Midland | Chicago, IL | Global leader | Integrated, CCS | Fuel, industrial |
| 3 | Valero Energy | San Antonio, TX | Refiner-integrated leader | Blending, logistics | Fuel |
| 4 | Green Plains | Omaha, NE | Large independent | Protein, CI strategy | Fuel, feed |
| 5 | Flint Hills Resources | Wichita, KS | Large integrated | Procurement, marketing | Fuel |
| 6 | Cargill | Minneapolis, MN | Agribusiness major | Feedstock, trading | Fuel, feed |
| 7 | The Andersons | Maumee, OH | Diversified | Grain-ethanol integration | Fuel |
| 8 | Alto Ingredients | Pekin, IL | Specialty alcohol | Specialty grades | Fuel, specialty |
| 9 | REX American Resources | Dayton, OH | Mid-size | Investment, cost control | Fuel |
| 10 | Aemetis | Cupertino, CA | Low-carbon specialist | Biogas, India/California | Fuel, RNG |
| 11 | Gevo | Englewood, CO | SAF specialist | Alcohol-to-jet | SAF |
| 12 | Marquis Energy | Hennepin, IL | Large independent | Scale | Fuel |
| 13 | Big River Resources | West Burlington, IA | Regional | Farmer-linked | Fuel |
| 14 | Absolute Energy | Lime Springs, IA | Regional | Efficiency | Fuel |
| 15 | Granite Falls Energy | Granite Falls, MN | Cooperative-style | Regional supply | Fuel |
| 16 | Cardinal Ethanol | Union City, IN | Regional | Operating track record | Fuel |
| 17 | Lincolnway Energy | Nevada, IA | Regional | Cost position | Fuel |
| 18 | Southwest Iowa Renewable Energy | Council Bluffs, IA | Regional | Capacity | Fuel |
| 19 | Homeland Energy Solutions | Lawler, IA | Regional | Efficiency | Fuel |
| 20 | Tharaldson Ethanol | Fargo, ND | Regional | Northern plains | Fuel |
| 21 | Greenfield Global | Toronto, ON | Canadian leader | Industrial/fuel | Fuel, industrial |
| 22 | Suncor Energy | Calgary, AB | Canadian integrated | Refining linkage | Fuel |
Estimated shares indicate POET at roughly 15-19% of U.S. capacity, followed by ADM and Valero at roughly 8-11% each. The next tier, including Green Plains and Flint Hills Resources, holds roughly 4-6% each. The remaining market is fragmented across regional producers. Estimated share shifts are driven by plant divestitures, acquisitions, and CI-related upgrades. The full report provides ranked shares, revenue estimates, concentration ratios, and share gain/loss analysis.
Leading players are benchmarked on capacity, plant count, CI-score position, co-product mix, logistics reach, balance sheet strength, and strategic investment. Scale leaders (POET, ADM, Valero) rate Leader on capacity and logistics. Specialists such as Gevo and Aemetis rate Strong on low-carbon positioning but emerging on scale. Cooperative-style producers generally rate Moderate on marketing reach but Strong on regional cost position.
Broad-portfolio leaders such as ADM and Cargill span fuel, industrial, feed, and food-grade products. Specialty leaders such as Alto Ingredients address high-purity and beverage-grade ethanol. Sustainable-product leaders, including Aemetis and Gevo, target low-carbon and SAF markets. Portfolio gaps persist in high-protein feed and renewable fuels beyond ethanol for mid-size players.
Fuel-grade leaders are POET, ADM and Valero. Specialty and industrial leaders include Alto Ingredients and Greenfield Global. SAF is an emerging white space led by technology specialists.
Competitive intensity is highest in the Corn Belt states, where several leading plants cluster. Canadian supply is led by Greenfield Global and Suncor. West Coast low-carbon markets are served by both domestic producers and importers, creating premium pricing opportunities. Export-oriented Gulf and rail-linked producers hold logistical advantages.
Over the last two to three years, companies have prioritized carbon capture projects, non-core plant divestitures, protein co-product investments, debottlenecking, SAF partnerships, and low-carbon corn programs. Several multi-state CO₂ pipeline initiatives have faced regulatory and landowner challenges, delaying timelines. The full report tracks announcements about investment values and status.
Consolidation is driven by portfolio rationalization, access to low-carbon assets, vertical integration with refiners, and the pursuit of scale economies. Key themes include asset sales by leveraged independents, strategic acquisitions by refiners, renewable natural gas integration, and technology-driven acquisitions around SAF and carbon management. The report covers deal parties, years, values (where disclosed), geography, and strategic rationale.
Company Strategic Positioning
Opportunity and White-Space Analysis
Industry Structure (Porter’s Five Forces)
PESTLE Analysis
By 2030, the market is expected to reach roughly USD XX billion, rising to USD XX billion by 2035 in the base case. Upside scenarios depend on E15 expansion, export growth, and scaled carbon capture. Downside scenarios reflect faster EV adoption and policy rollback. Future winners are likely to be scale producers with low-CI assets, strong logistics and diversified co-product portfolios. Emerging challengers include SAF and carbon-management specialists. Key strategic priorities are decarbonization, export channel development, co-product value-add, and selective consolidation.
By Feedstock
By Process
By Blend Level
By Application
By Carbon Intensity
By Co-Product
By Country
Reliable market intelligence and data-driven insights across the global chemicals and materials industry, helping businesses understand trends, competition, pricing, and emerging opportunities.
Schedule a Demo