
What is the Cross-Linked Polyethylene (XLPE) Market Size and Share?
The Cross-linked polyethylene (XLPE) market size was valued at USD 9.05 billion in 2025 and is projected to grow from USD 9.68 billion in 2026 to USD 17.8 billion by 2035, exhibiting a CAGR of 7.00% during the forecast period and is supported by growing demand for durable electrical cable insulation, reliable water distribution systems, plumbing pipes, heating systems, and industrial applications. XLPE offers heat resistance, electrical performance, chemical resistance, and long service life, making it an important material for modern infrastructure.
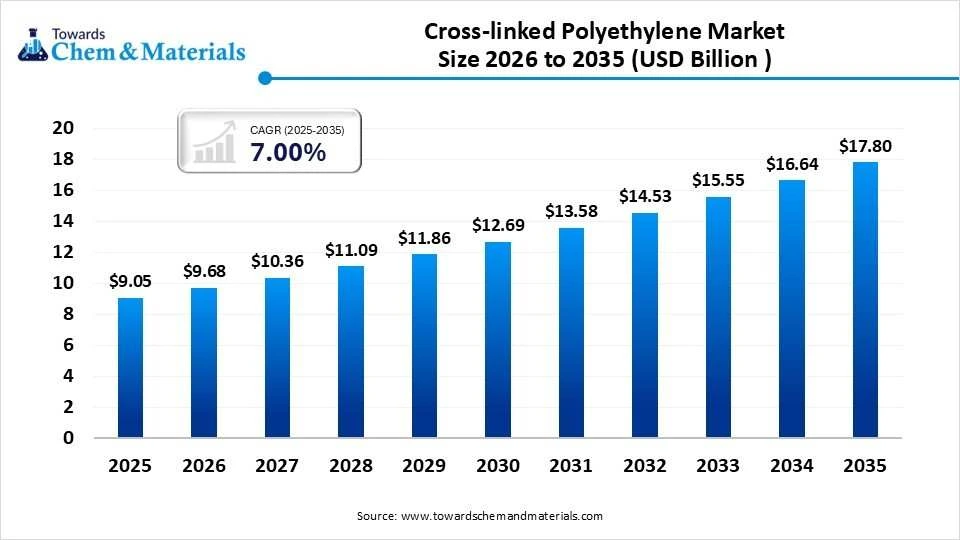
Demand is closely linked to electricity grid investment, renewable power connections, building construction, water infrastructure, and industrial development. Electrical cables represent a major application area, while investment in power transmission, distribution, and renewable energy infrastructure creates opportunities for higher-performance XLPE grades. Competition depends on material quality, production capacity, processing technology, customer approvals, technical support, and the ability to supply consistent products at competitive prices.
Electricity Infrastructure and Durable Piping Shape XLPE Demand
Cross-linked polyethylene is a modified form of polyethylene in which polymer chains are chemically or physically linked to improve performance under heat, pressure, and demanding operating conditions. It is widely used in medium- and high-voltage electrical cables, building wires, hot- and cold-water plumbing, underfloor heating, and selected industrial applications.
The market has two closely connected demand engines. The first is electrical infrastructure, where XLPE insulation supports reliable power transmission and distribution. The second is piping and building systems, where cross-linked polyethylene is valued for flexibility, corrosion resistance, and resistance to temperature changes. These applications have different buying cycles: cable demand is influenced by grid investment and power projects, while pipe demand follows construction, renovation, plumbing, and heating-system installation.
Key Takeaways
- XLPE demand is driven by growing investments in electrical infrastructure, plumbing, heating systems, and industrial applications.
- Grid modernization and renewable energy projects support demand for high-performance XLPE cable insulation.
- Electrical cables and piping systems are the major application areas for XLPE materials.
- Market demand varies by product grade, cross-linking technology, voltage class, and end-use industry.
- Polyethylene prices, processing costs, and product quality influence XLPE pricing and profitability.
- Production capacity, supply reliability, and import dependence shape regional market dynamics.
- Cross-linking technologies influence XLPE performance, processing efficiency, and application suitability.
- Material suppliers, cable manufacturers, and piping specialists compete across different stages of the XLPE value chain.
- Technical certifications, customer approvals, and consistent product quality strengthen supplier competitiveness.
- Grid upgrades, renewable energy connections, and specialty piping applications offer potential growth opportunities through 2035.
The market is also changing as electricity networks accommodate renewable energy, new generation capacity, and rising power demand. These changes create opportunities for cable materials designed to meet demanding electrical and thermal requirements. In piping, product quality, installation convenience, and long-term reliability remain central buying factors.
Key coverage
- Global revenue, production volume, and historical growth, once validated.
- XLPE demand by electrical cables, pipes, building systems, and industrial uses.
- Largest and fastest-growing product and application segments.
- Regional consumption, local production, and import dependence.
- Differences between commodity-grade and higher-performance materials.
- Key demand indicators linked to grid investment and construction activity.
Market Size and Forecast – Grid Investment Creates a Long-Term Demand Base
A defensible XLPE forecast requires a clear distinction between the value of XLPE resin and compounds, the value of finished XLPE-insulated cables, and the value of XLPE piping. These are different markets and should not be combined without adjustment. Cable sales, in particular, include conductors, insulation, screens, sheathing, and manufacturing value beyond the XLPE material itself.
The report's base-year model should quantify the 2025 market, estimate 2026 revenue, and forecast demand through 2035. The final model will calculate the compound annual growth rate (CAGR), incremental revenue, and volume growth from consistent product and geographic boundaries.
A practical forecast should use three scenarios. The base case reflects expected grid upgrades, replacement of aging cables, construction activity, and normal industrial demand. The upside case assumes faster electricity-network investment, stronger renewable-energy connections, and accelerated infrastructure development. The downside case reflects delayed projects, weaker construction, high polymer costs, or reduced industrial investment.
Key coverage
- 2021–2025 historical market estimates and 2025 base-year value.
- 2026 market estimate and annual forecasts through 2035.
- Revenue, tonnage, average selling price, and incremental opportunity.
- Forecasts by product, application, end-use industry, and region.
- Base, upside, and downside scenarios with clearly stated assumptions.
- Separate estimates for XLPE materials and finished downstream products where relevant.
Segmentation Analysis – Cable Insulation and Pipe Systems Have Different Growth Drivers
XLPE should be segmented according to how the material is manufactured, sold, and used. Application-based segmentation is particularly important because the performance requirements and customer qualification processes for power cables differ significantly from those for plumbing pipes.
The main product categories include XLPE compounds for cable insulation, pipe-grade XLPE materials, and grades used in other industrial applications. Cable materials can be further divided by voltage class and performance requirements. Pipe materials can be divided by hot- and cold-water plumbing, heating, and related fluid-handling uses.
| Segmentation dimension | Main categories |
| Product type | Cable-grade XLPE, pipe-grade XLPE, other specialty grades |
| Cross-linking technology | Peroxide, silane/moisture-cure, radiation, and other applicable processes |
| Application | Power cables, building wires, plumbing pipes, heating systems, industrial uses |
| Cable voltage | Low, medium, high, and extra-high voltage, where applicable |
| End-use industry | Power and utilities, construction, renewable energy, industrial infrastructure |
| Customer type | Cable manufacturers, pipe producers, distributors, contractors, industrial buyers |
| Sales channel | Direct supply, compound distributors, specialist distribution |
| Geography | North America, Europe, Asia Pacific, Latin America, Middle East and Africa |
The largest segment must be determined using the selected market boundary. Electrical applications may lead a cable-focused XLPE materials market, but the ranking can differ when pipe-grade materials and other uses are included. Similarly, the fastest-growing segment should be identified using forecast revenue and volume growth rather than assumed in advance.
Key coverage
- Revenue and volume share for every major segment.
- Segment-level growth rates and contributions to market expansion.
- Cable-grade performance requirements by voltage class.
- Pipe-grade demand by plumbing and heating application.
- Technology comparison by processing needs and end-use suitability.
- Emerging and underserved product categories.
Market Dynamics – Power Networks, Construction, and Reliability Drive Adoption
Growth drivers:
Grid modernization, electricity demand, renewable-power connections, and replacement of aging infrastructure support cable demand. In buildings, hot-water plumbing and heating applications benefit from flexibility, corrosion resistance, and resistance to repeated temperature changes. Industrial facilities also use XLPE in applications where durability and electrical performance are important.
Restraints:
XLPE competes with other insulation and piping materials, including PVC, conventional polyethylene, elastomers, and alternative cable insulation systems. The suitability of each material depends on voltage, temperature, installation conditions, cost, and required service life. XLPE processing also requires controlled manufacturing conditions and appropriate quality assurance.
Opportunities:
Higher-performance cable systems, infrastructure upgrades, renewable-energy projects, and specialist piping applications create room for differentiated products. Suppliers that can support customer qualification, consistent processing, and technical problem-solving may be better positioned than those competing on price alone.
Risks:
Volatile ethylene and polyethylene costs, energy prices, supply interruptions, construction slowdowns, and delayed infrastructure projects can affect demand and profitability. Poor processing control can create quality problems, making manufacturing expertise an important competitive factor.
Key coverage
- Driver and restraint assessment by application.
- Sensitivity of demand to construction and electricity investment.
- Material substitution risks and product-performance trade-offs.
- Raw-material, energy, and operating-cost exposure.
- High-growth applications and technical barriers to adoption.
Pricing Analysis – Grade, Purity, Processing, and Customer Approval Influence Selling Prices
XLPE pricing is usually assessed in USD per kilogram or per metric ton for resin and compounds, and in price per meter or kilometer for finished cable and pipe products. These measures are not interchangeable. A finished cable price also reflects conductor metal, shielding, sheathing, design, testing, installation requirements, and project specifications.
For XLPE compounds, key cost drivers include polyethylene feedstock, cross-linking agents, additives, energy, quality control, packaging, and freight. Premium grades may command higher prices when they meet demanding electrical, thermal, cleanliness, or processing requirements. Approved materials used in critical cable applications can also face higher switching barriers than general-purpose products.
A single global average selling price would therefore be misleading. The report will compare prices by grade, application, region, order size, and delivery terms, while separating raw-material movements from changes in product mix. Exact price ranges should be established from comparable commercial grades and dates rather than mixing bulk polymer prices with specialty compounds or finished products.
Key coverage
- XLPE resin and compound pricing in USD/kg and USD/ton.
- Finished cable and pipe pricing using suitable unit measures.
- Cost sensitivity to polyethylene feedstock, additives, energy, and freight.
- Regional price differences and import-related costs.
- Premium pricing for specialist grades and approved materials.
- Contract pricing, pass-through practices, and margin pressure.
Demand-Supply Analysis – Qualification and Reliable Production Matter as Much as Capacity
XLPE supply is shaped by the availability of polyethylene feedstock, compounding capacity, cross-linking technology, quality-control systems, and access to downstream manufacturers. Cable and pipe producers require materials that meet application-specific standards and can be processed consistently. As a result, nominal production capacity does not always translate into immediately usable supply for every customer.
Demand can rise unevenly across regions. A large cable project may increase demand for a particular grade, while pipe demand may follow local building cycles. A supplier with available capacity may still need to complete customer testing and approval before serving a critical application.
The report will compare production capacity, estimated utilization, lead times, new investments, inventory, and regional import dependence wherever reliable data is available. Where public information does not separate XLPE from wider polyethylene or cable operations, the analysis will identify the limitation rather than assign an unsupported capacity figure.
Key coverage
- Production and consumption estimates by region.
- Installed capacity and utilization where disclosed.
- New capacity, project delays, lead times, and inventory trends.
- Grade-specific supply constraints and customer qualification.
- Import dependence and potential local-production opportunities
Value Chain and Supply Chain – Material Quality and Application Expertise Support Value Capture
The XLPE value chain begins with hydrocarbon feedstocks and polyethylene production. Polymer producers and compounders then supply grades suited to different cross-linking processes and end uses. Cable and pipe manufacturers convert these materials into finished products, which are sold through direct contracts, distributors, project suppliers, and specialist channels.
Value is created at several stages. Upstream producers benefit from scale and feedstock access. Compounders can differentiate through formulation, consistency, and technical support. Cable and pipe manufacturers capture value through product design, processing efficiency, certification, customer relationships, and delivery reliability. Distributors add availability and local service, particularly for smaller customers.
The report separates material cost from conversion, testing, logistics, and distribution costs. It also examines where vertical integration can improve supply security and where specialist suppliers may compete effectively without owning the entire chain.
Key coverage
- Raw materials, compounding, conversion, distribution, and end-use.
- Cost contribution and value capture by value-chain stage.
- Supplier concentration and feedstock exposure.
- Logistics, storage, and technical-service requirements.
- Integration advantages and potential bottlenecks.
Trade and Import–Export: Local Supply Can Be a Competitive Advantage
Trade analysis needs to distinguish XLPE compounds from general polyethylene, finished cables, and plastic piping. These products can fall under different customs classifications, so a broad polymer trade figure cannot be treated as XLPE-specific trade.
The study will examine country-level trade values and volumes where the product classification permits a defensible estimate. It will compare import reliance, export competitiveness, freight exposure, tariffs, and the role of regional manufacturing hubs. Where customs data does not isolate XLPE reliably, the report will use clearly labelled proxies rather than claim that all polyethylene trade represents XLPE.
Key coverage
- Import and export values and volumes where identifiable.
- Leading trading countries and regional trade corridors.
- Import dependence and local-supply potential.
- Tariff, freight, and trade-policy exposure.
- Limits in product-level customs classification.
Technology and Innovation – Cross-Linking Method Determines Product Performance
XLPE performance depends on the polymer structure, cross-linking method, formulation, and processing conditions. Common routes include peroxide cross-linking, silane or moisture-curing processes, and radiation cross-linking. Their suitability varies by product design, production method, cost, and performance requirements.
For power cables, key technical priorities include dielectric performance, thermal endurance, resistance to electrical treeing, cleanliness, and dependable processing. For piping, flexibility, creep resistance, stress-crack resistance, temperature performance, and potable-water suitability are important. Manufacturers also focus on reducing defects, improving process consistency, and limiting waste.
The report compares technology maturity, process complexity, quality-control needs, adoption barriers, and the relevance of new formulations. Patent and R&D indicators will be included only where they can be reliably linked to XLPE technologies rather than broader polymer portfolios.
Key coverage
- Chemical and radiation cross-linking routes.
- Technology fit by cable and pipe application.
- Processing efficiency, defect control, and quality assurance.
- Innovation priorities and product-development opportunities.
- Patent and R&D benchmarking where relevant data is available.
Regulation and Sustainability – Long Service Life Must Be Balanced With Material Recovery
XLPE products must meet requirements relevant to their intended use, including cable performance, building and plumbing codes, drinking-water suitability, and electrical safety. Requirements vary by country, product type, voltage class, and installation environment. Certification and testing can therefore influence both market access and the time needed to qualify new suppliers.
Sustainability questions are also becoming more important. XLPE's cross-linked structure improves performance but makes conventional remelting more difficult than for many uncross-linked thermoplastics. Mechanical recycling, material recovery, and alternative processing routes must be assessed according to technical feasibility and end-product quality. Long service life can reduce replacement frequency, but it does not eliminate end-of-life challenges.
Key coverage
- Relevant cable, pipe, building, and water-contact standards.
- Certification and product-qualification requirements.
- Recycling limitations and recovery options.
- Waste reduction, product durability, and environmental considerations.
- Regional differences in compliance and market entry.
Customer and Application Analysis – Qualification Creates Stronger Relationships in Critical Uses
XLPE customers include cable manufacturers, pipe producers, utilities, construction contractors, distributors, and industrial buyers. Their priorities differ: cable manufacturers focus on electrical performance and process consistency, while pipe producers emphasize product durability, ease of processing, and compliance with relevant plumbing requirements.
Purchasing decisions typically combine price, technical performance, supply reliability, and qualification history. For critical applications, switching materials can require additional testing and production trials. This creates an advantage for suppliers that provide application engineering, fast technical support, and dependable batch quality.
Key coverage
- Customer industries and application-level demand.
- Buying criteria and price sensitivity.
- Qualification cycles, switching barriers, and supplier relationships.
- Direct sales versus distributor-led supply.
- Underserved applications and customer-service opportunities.
Competitive Intelligence
Competitive Landscape – Material Suppliers and Finished-Product Manufacturers Compete at Different Levels
XLPE competition is not a single, uniform market. Polymer and compound suppliers compete on formulation, product consistency, technical support, and supply economics. Cable and pipe manufacturers compete on finished-product performance, manufacturing scale, certifications, project delivery, and customer relationships. Comparing their total company revenues directly would produce a misleading ranking because much of that revenue may come from products outside XLPE.
The competitive assessment therefore separates upstream material suppliers, XLPE cable manufacturers, and PEX/XLPE piping-system suppliers. Public financial results are useful for understanding company scale, but XLPE-specific revenue and market share are often not disclosed separately. Company rankings should consequently be labelled as estimated or qualitative unless product-level figures can be validated.
Key coverage
- Global material suppliers, regional manufacturers, and application specialists.
- Upstream versus downstream competitive positions.
- Market concentration and barriers to entry.
- Product differentiation, customer approval, and supply reliability.
- Strategic positioning by region and application.
Tentative Leading Company Universe – 22 Relevant Market Participants
The following is a tentative leading company universe, not a verified market-share ranking. The companies span XLPE materials, power cables, and cross-linked polyethylene piping systems. Inclusion indicates relevance to part of the value chain; it does not mean that every company sells XLPE resin or competes in every segment.
| Sr. No | Company | Headquarters | Market position | Core strength | Major applications/segments |
| 1 | Borealis | Austria | Material supplier | Cable-grade polyolefins and compound expertise | Power cable insulation |
| 2 | Dow | United States | Material supplier | Polyethylene and cable-material technologies | Wire and cable |
| 3 | LyondellBasell | United States | Upstream polymer supplier | Polyethylene scale and resin portfolio | Polymer feedstock |
| 4 | Mitsui Chemicals | Japan | Polymer supplier | Specialty polymer capabilities | Industrial and cable materials |
| 5 | Hanwha Solutions | South Korea | Polymer supplier | Polyethylene and chemical production | Industrial materials |
| 6 | SABIC | Saudi Arabia | Polymer supplier | Scale and regional feedstock access | Polyethylene supply |
| 7 | SCG Chemicals | Thailand | Regional polymer supplier | Asian petrochemical reach | Polyethylene and compounds |
| 8 | LG Chem | South Korea | Polymer supplier | Polymer manufacturing and R&D | Industrial polymer applications |
| 9 | Prysmian | Italy | Cable manufacturer | Global cable portfolio and project execution | Power transmission and distribution |
| 10 | Nexans | France | Cable manufacturer | Electrification and cable engineering | Grid and energy cables |
| 11 | NKT | Denmark | Cable specialist | High-voltage cable systems | Power transmission |
| 12 | Sumitomo Electric Industries | Japan | Cable and materials group | Electrical engineering and cable production | Power and industrial cables |
| 13 | Furukawa Electric | Japan | Cable manufacturer | Cable engineering and materials | Energy infrastructure |
| 14 | LS Cable & System | South Korea | Cable manufacturer | Grid cable production | Power networks |
| 15 | Southwire | United States | Cable manufacturer | North American cable manufacturing | Utility and building wire |
| 16 | NKT Cables | Denmark | Cable business | High-voltage cable systems | Grid infrastructure |
| 17 | Elsewedy Electric | Egypt | Regional cable leader | Cables and integrated electrical solutions | Utilities and construction |
| 18 | Ducab | United Arab Emirates | Regional cable manufacturer | Regional supply and project relationships | Power and building cables |
| 19 | Polycab India | India | Cable manufacturer | Domestic distribution and product breadth | Building wire and power cable |
| 20 | KEI Industries | India | Cable manufacturer | Power cable and infrastructure exposure | Utility and industrial cables |
| 21 | GF Building Flow Solutions | Switzerland | Piping-system supplier | PEX and building-flow systems | Plumbing and heating |
| 22 | REHAU | Germany | Piping specialist | Polymer processing and building systems | Plumbing and heating |
Market Share and Competitive Ranking – Product-Level Disclosure Is the Main Limitation
A reliable top-five or top-ten ranking requires a consistent denominator. Material suppliers should be ranked using XLPE resin or compound revenue or volume, while cable and pipe manufacturers should be assessed within their respective downstream markets. Combining these categories would double-count material embedded in finished products.
The report will estimate market shares where comparable data exists and mark other positions as unverified. It will calculate concentration measures only after the relevant market boundary has been established. Company financial scale, regional presence, and product breadth will serve as supporting indicators—not substitutes for actual XLPE market share.
Key coverage
- Market share by defined value-chain layer.
- Top-five and top-ten positions where supportable.
- Estimated share ranges with confidence labels.
- Regional leaders and specialist competitors.
- Share gains, losses, and concentration trends where evidence permits.
Competitive Benchmarking – Scale Matters, but Technical Qualification Protects Positions
Competitors will be compared on product range, application expertise, manufacturing footprint, customer qualification, distribution, innovation, and geographic reach. Upstream suppliers will be assessed on grade breadth, polymer integration, technical consistency, and service. Cable manufacturers will be compared on voltage-class capability, project delivery, quality systems, and regional manufacturing. Piping specialists will be assessed on system breadth, installation support, certification, and contractor relationships.
| Benchmark area | Key measures |
| Scale | Relevant segment revenue, production capacity, geographic coverage |
| Product portfolio | Cable-grade, pipe-grade, and specialty products |
| Technology | Cross-linking expertise, process control, product development |
| Customers | Qualification status, technical service, customer industries |
| Manufacturing | Site footprint, expansion plans, supply reliability |
| Sustainability | Waste reduction, durability, and material-recovery initiatives |
The full study will classify each company as Leader, Strong, Moderate, or Emerging for each relevant dimension, with evidence and limitations noted.
Product, Technology, and Application Benchmarking – Strength Depends on the End Use
No single supplier is likely to lead every XLPE application. Cable-grade expertise does not automatically establish leadership in plumbing, and a strong finished-cable business does not necessarily imply that a company sells XLPE compounds externally.
The report compares relevant portfolios across medium- and high-voltage cables, building wire, plumbing and heating systems, and specialist industrial uses. It will also examine processing technologies, application certifications, product range, and technical support. Gaps may include limited regional availability, insufficient local technical service, or a narrow portfolio of application-approved grades.
Key coverage
- Product breadth and specialty-grade capabilities.
- Application fit by cable voltage and piping use.
- Technology maturity and process expertise.
- Customer support and certification capabilities.
- Competitive gaps by product, region, and application.
Geographic and Manufacturing Benchmarking – Regional Production Shapes Access and Cost
Competitive strength depends on where material is produced, where customers manufacture, and how efficiently products can be delivered. A strong local footprint can reduce freight exposure and lead times, while global production and technical networks can support multinational customers and complex projects.
The study compares manufacturing presence, regional sales reach, announced capacity additions, and localization strategies. Capacity will be reported only where disclosed or reliably estimated for the relevant product category; broader polymer or cable capacity will not be treated as XLPE capacity.
Key coverage
- Regional manufacturing and customer-service footprints.
- Local versus imported supply.
- Capacity expansion and localization plans.
- Freight and lead-time implications.
- Regional leaders and local specialists.
Customer and Channel Benchmarking – Technical Service Helps Build Customer Loyalty
XLPE material sales often depend on long-term relationships between suppliers and cable or pipe manufacturers. Technical approval, stable production performance, and rapid resolution of manufacturing issues can make switching difficult. In finished products, distributors, contractors, utilities, and project developers influence specification and supplier selection.
The report compares direct sales, distributor networks, application engineering, customer concentration where disclosed, and service capabilities. It also examines the differences between large project-based purchases and recurring industrial orders.
Key coverage
- Direct and indirect sales models.
- Customer qualification and switching barriers.
- Technical support and application engineering.
- Contractor, distributor, and utility relationships.
- Customer concentration and channel development opportunities.
Strategic Developments and M&A – Expansion and Technical Capability Are Key Priorities
Recent and upcoming strategic activity should be assessed across capacity investment, product development, geographic expansion, partnerships, and acquisitions. In the XLPE market, the most important moves are those that improve access to qualified materials, strengthen cable-manufacturing capabilities, expand high-voltage production, or extend piping-system distribution.
The study will track announcements from 2023 through September 2026, distinguishing completed transactions from announced plans. Each development will be assessed for investment value, target capacity, intended applications, geographic reach, and expected competitive impact. Undisclosed financial terms will not be estimated without a clear basis.
Key coverage
- Capacity additions, new facilities, and expansion plans.
- New product platforms and technical partnerships.
- Acquisitions and joint ventures, including disclosed transaction values.
- Regional expansion and vertical integration.
- Strategic implications for market access and competition.
Company Profiles – Company-Level Intelligence Across the Value Chain
Detailed profiles will be prepared for the validated company universe, separating material suppliers from cable and piping manufacturers. The depth of each profile will reflect the relevance and availability of public information.
Each profile will cover:
- Company overview: Headquarters, ownership, history, employee base, and global footprint.
- Market position: Relevant XLPE products, applications, geographic reach, and competitive role.
- Financial profile: Total revenue, growth, operating performance, R&D, and capital spending where disclosed.
- Product portfolio: Cable compounds, polymer grades, cable systems, or PEX piping products, as applicable.
- Manufacturing: Relevant facilities, capacity, expansion plans, and supply footprint.
- Technology: Processing capabilities, product development, technical support, and partnerships.
- Strategy and risks: Competitive strengths, vulnerabilities, growth opportunities, and recent strategic activity.
Total company revenue will not be presented as XLPE revenue. Where product-specific sales or market shares are unavailable, the report will identify the gap and use qualitative positioning instead of unsupported estimates.
Company Strategic Positioning – Different Business Models Offer Different Advantages
The study will group participants by their principal strengths rather than force them into a single ranking.
Material and technology leaders: Suppliers with relevant polymer expertise, product development, and customer qualification capabilities.
- Cable-system leaders: Manufacturers with broad cable portfolios, strong project execution, and high-voltage capabilities.
- Regional leaders: Companies with established local manufacturing, distribution, and customer relationships.
- Piping specialists: Suppliers focused on PEX plumbing, heating, and building systems.
- Emerging challengers: Businesses seeking to grow through local supply, targeted applications, pricing, or technical differentiation.
The final assessment will compare growth prospects, product breadth, customer access, manufacturing scale, innovation, and regional exposure. It will be a practical strategic assessment, not a proprietary numerical index.
Opportunity and White-Space Analysis – Targeted Applications Can Offer Better Returns Than Scale Alone
The most promising opportunities may sit in specific grades, customer groups, and regions rather than in the entire XLPE market. Examples include high-performance cable insulation, grid-modernization projects, renewable-power connections, local supply to cable manufacturers, and plumbing or heating systems in markets where installation practices are changing.
The report will test each opportunity against market size, expected growth, qualification barriers, competition, investment needs, and achievable margins. Opportunities will be quantified only where the market model supports a defensible estimate.
Key coverage
- Product and application gaps.
- Regional growth and local-production opportunities.
- Specialty-grade and technical-service opportunities.
- Import substitution and distribution expansion.
- Investment requirements and commercial feasibility.
Industry Structure – Porter’s Five Forces
| Force | Initial assessment | Market-specific reason |
| Supplier power | Medium to high | Polymer feedstock, specialist additives, and qualified material availability affect costs and production continuity. |
| Buyer power | Medium to high | Large cable and pipe manufacturers can negotiate volume contracts, but qualification requirements limit easy switching. |
| Threat of new entrants | Medium | Basic compounding may be accessible, while critical applications require technical capability, testing, and customer approval. |
| Threat of substitutes | Medium to high | Alternative insulation and piping materials compete according to performance, installation, and total cost. |
| Competitive rivalry | High | Suppliers compete on cost, consistency, technical support, capacity, and customer relationships. |
These are initial qualitative assessments. The full analysis will test them by product segment and region rather than assume that all XLPE applications have the same competitive structure.
PESTLE Analysis – Infrastructure Spending, Standards, and Polymer Economics Shape the Market
- Political: Public infrastructure plans and energy-security priorities influence grid investment and local manufacturing.
- Economic: Interest rates, construction activity, energy costs, and polymer prices affect demand and margins.
- Social: Urbanization and expectations for reliable electricity and water systems support durable infrastructure.
- Technological: Cable performance, cross-linking processes, and manufacturing quality influence adoption.
- Legal: Electrical, plumbing, drinking-water, and product-safety requirements shape market access.
- Environmental: Product durability, production waste, and end-of-life recovery influence material selection and investment.
The report will identify which factors have the greatest effect in each region and application.
Market Attractiveness – Higher-Performance Applications Require More Than Low Pricing
Market attractiveness will be assessed across growth, addressable revenue, margin potential, competition, customer access, technology requirements, and capital needs. Grid-related cable applications may offer long-term demand visibility but require substantial qualification and technical capability. Plumbing and heating products can offer repeat demand but remain sensitive to construction cycles, distribution access, and competition from alternative materials.
The final study will classify individual segments as Highly Attractive, Attractive, Moderate, or Challenging, supported by the market model and competitive evidence.
Future Outlook – Infrastructure Investment and Material Performance Will Shape Growth Through 2035
XLPE demand is likely to remain linked to electricity-network investment, renewable-power integration, building systems, and industrial infrastructure. The strongest opportunities will depend on local project pipelines, product requirements, and the ability of suppliers to provide reliable, application-approved materials.
The final forecast will include base, upside, and downside cases through 2030 and 2035. It will test how changes in infrastructure investment, construction activity, polymer prices, production capacity, and competing materials could affect revenue, volume, and profitability. Future winners are likely to include companies that combine suitable product portfolios with reliable supply, technical support, strong customer relationships, and access to attractive applications.
Key coverage
- 2030 and 2035 revenue and volume forecasts.
- Regional and application-level growth prospects.
- Pricing, raw-material costs, and margin risks.
- Technology and regulatory developments.
- Capacity investment, competitive shifts, and potential M&A themes.
Key Strategic Questions
- What is the global XLPE market size in 2025, and how will it develop through 2035?
- Which applications account for the largest revenue and volume shares?
- Which product grades and cross-linking technologies offer the strongest growth prospects?
- How much demand comes from power cables compared with piping and heating systems?
- Which regions offer the best combination of demand growth and local supply potential?
- How do polyethylene prices and processing costs influence XLPE profitability?
- Where are capacity constraints, import dependence, or supply risks most significant?
- Which technical standards and customer approvals create barriers to entry?
- Which material suppliers, cable manufacturers, and piping specialists are best positioned?
- What can be reliably established about company market shares and competitive rankings?
List of Segments
By Product Type
- Cable-grade XLPE
- Pipe-grade XLPE
- Other specialty grades
By Cross-linking Technology
- Peroxide cross-linking
- Silane/moisture-cure cross-linking
- Radiation cross-linking
- Other applicable processes
By Application
- Power cables
- Building wires
- Plumbing pipes
- Heating systems
- Industrial uses
By Cable Voltage
- Low voltage
- Medium voltage
- High voltage
- Extra-high voltage
By End-use Industry
- Power and utilities
- Construction
- Renewable energy
- Industrial infrastructure
By Customer Type
- Cable manufacturers
- Pipe producers
- Distributors
- Contractors
- Industrial buyers
By Sales Channel
- Direct supply
- Compound distributors
- Specialist distribution
By Region
- North America
- Europe
- Asia Pacific
- Latin America
- Middle East and Africa
A Seven-Phase Framework
Our methodology is designed to be universally applicable across commodity chemicals, specialty chemicals, petrochemicals, construction chemicals, coatings, electronic chemicals, industrial gases, agrochemicals, water treatment chemicals, and performance materials. Each phase builds upon the last, creating a layered validation structure that minimizes estimation error and maximizes analytical confidence.
The framework ensures comprehensive market coverage, robust cross-validation, and reliable long-term forecasting — producing market estimates that withstand scrutiny from investors, regulators, and corporate strategy teams.

Seven-Phase Framework — Analytical Effort Distribution
Relative analytical effort allocated across each phase of the Chemicals & Materials research framework

Phase 1 - Secondary Research: Establishing the Foundation
Secondary research collects and evaluates publicly available information from authoritative sources, establishing the foundational understanding of market structure, value chain dynamics, competitive landscape, and end-use demand patterns. Every source is evaluated for credibility, recency, geographic relevance, and methodological soundness before inclusion.
Industry Associations
Sources include ACC, CEFIC, ICCA, JCIA, CPCIF, and SOCMA providing production volumes, consumption trends, capacity developments, and sustainability initiatives.
Company Disclosures
Annual reports, investor presentations, earnings transcripts, and regulatory filings reveal product portfolios, manufacturing footprints, capacity expansions, and revenue segmentation.
Government Databases
National statistical offices, customs authorities, environmental agencies, and industrial production databases provide verified statistics on output, trade flows, and regulatory compliance.
Trade Databases
UN Comtrade, ITC, Eurostat, and national customs authorities enable assessment of global product movement, import dependency, and export competitiveness across regions.
Our Secondary Research Sources
- Ministry of Chemicals and Fertilizers
- European Chemicals Agency
- United States Department of Energy
- Ministry of Industry and Information Technology
- Ministry of Economy Trade and Industry
- Ministry of Trade Industry and Energy
- National Institute of Standards and Technology
- Council of Scientific and Industrial Research
- Fraunhofer Society
- National Institute for Materials Science
Phase 2 — Supply-Side Assessment: Mapping Production Capabilities
Production Capacity Analysis
All major manufacturers are assessed for existing installed capacity, planned additions, expansions, new plant announcements, and technology adoption — mapped at global, regional, and country levels.
Capacity Utilization Adjustment
Installed capacity is adjusted using utilization rates based on demand conditions, feedstock availability, plant operating rates, maintenance schedules, and regulatory restrictions.
Manufacturer Revenue Analysis
Product-specific revenues, segment-level performance, regional distribution, average selling prices, and margin trends are evaluated to establish market value estimates.
Supply-Side Assessment — Capacity vs. Effective Production by Region
Illustrative comparison of installed capacity vs. effective production volume (after utilization rate adjustment) across major regions

Phase 3 — Demand-Side Assessment: Quantifying Chemical Consumption
Demand-side analysis quantifies chemical consumption across industries, applications, and geographies — identifying where and how chemicals are consumed throughout the value chain with precision.
End-Use Industry Analysis
Chemical demand is evaluated across automotive, construction, packaging, electronics, agriculture, healthcare, consumer goods, industrial manufacturing, energy and utilities, and water treatment. Industry output, production trends, and consumption intensity are analyzed to determine demand patterns.
Consumption Modeling
Demand is estimated using measurable indicators: kilograms per vehicle, kilograms per square meter of construction, dosage per cubic meter of water treated, kilograms per hectare of agricultural land, and kilograms per ton of manufactured products. Consumption factors are validated through industry publications and primary interviews.
Application Analysis
The market is segmented by application area to understand product performance requirements, formulation trends, technology adoption, customer preferences, and regulatory requirements improving demand accuracy and segmentation granularity.
Demand-Side Assessment — End-Use Industry Demand Distribution
Illustrative distribution of chemical & materials demand across key end-use industries

Phase 4 - Trade Flow Analysis: Balancing Regional Supply and Demand
Trade flow analysis reconciles regional supply and demand estimates through import and export data, identifying net supply positions, regional dependencies, and market imbalances. It serves as an independent validation layer that tests the consistency of supply-side and demand-side estimates.
Import Analysis
Import data is evaluated to determine volumes, source countries, product dependency, regional supply gaps, and pricing trends — identifying markets that rely heavily on external supply and where domestic production is insufficient to meet demand.
Export Analysis
Export assessments reveal production surplus, export competitiveness, regional manufacturing strength, and global market participation. Export patterns also help validate domestic production estimates and identify net exporting regions.
Apparent Consumption Model
Regional consumption is assessed using the standard apparent consumption formula:
Results identify net importing regions, net exporting regions, regional deficits, and surpluses — serving as an independent validation of supply and demand estimates.
Trade Flow Analysis — Net Supply Position by Region
Illustrative apparent consumption vs. domestic production across major regions — positive gap indicates net import dependency

Phase 5 — Primary Research: The Critical Validation Layer
Primary research tests and refines findings from secondary research through direct engagement with industry participants across the supply chain, demand side, and expert community. It captures intelligence that no database or published report can provide — the real-world experience of manufacturers, buyers, and specialists operating in the market.

Supply-Side Interviews
Conversations with chemical manufacturers, raw material suppliers, contract manufacturers, technology providers, and plant operators cover production trends, capacity utilization, pricing developments, technology shifts, and competitive dynamics.

Demand-Side Interviews
Engagement with OEMs, industrial consumers, procurement managers, distributors, formulators, and end-use manufacturers focuses on consumption trends, purchasing behavior, product substitution, demand outlook, and emerging applications.

Industry Expert Consultations
Additional interviews with industry consultants, independent experts, regulatory specialists, technical professionals, and research institutions provide deeper market context and validate key analytical assumptions.
Focus Areas of Primary Research:
Market Size & Forecast Validation
Revenue estimates, volume consumption, growth rates, forecast assumptions, regional demand.Supply Chain & Value Chain Assessment
Raw material sourcing, supply chain challenges, distribution networks, procurement practices.Production & Capacity Analysis
Manufacturing capacity, utilization rates, expansion projects, plant investments.Pricing & Cost Structure Analysis
Product pricing trends, feedstock costs, energy costs, margin pressures, pricing outlook.Competitive Landscape Assessment
Volume and value estimates confirmed to be fully consistent with one another before publicationInterview Volume by Market Scope
| Study Scope | Number of Interviews |
|---|---|
| Niche Market | 20 – 30 |
| Mid-Sized Market | 30 – 50 |
| Global Market | 50 – 80 |
| Highly Fragmented Market | 80 – 120 |
Interview Details:
Category : Manufacturers, Suppliers, Distributors, End Users, Experts/Associations
Average Duration : 30–60 Minutes
Interview Mode : Video calls, telephonic interviews, expert consultations
Interview Format : Structured / Semi-Structured questionnaire
Focus Areas of Primary Research:
Market Size & Forecast Validation :
Revenue estimates, volume consumption, growth rates, forecast assumptions, regional demand.
Supply Chain & Value Chain Assessment :
Raw material sourcing, supply chain challenges, distribution networks, procurement practices.
Production & Capacity Analysis :
Manufacturing capacity, utilization rates, expansion projects, plant investments.
Pricing & Cost Structure Analysis :
Product pricing trends, feedstock costs, energy costs, margin pressures, pricing outlook.
Competitive Landscape Assessment :
Market share, competitor positioning, strategic initiatives, partnerships, acquisitions.
Primary Research — Stakeholder Coverage by Category
Distribution of interview respondents across stakeholder categories (% share from PPT data)

Primary Research — Respondent Designation Profile
Seniority breakdown of interview respondents (% share from PPT data)

Primary Research — Geographic Coverage of Interviews
Regional distribution of primary research engagement (% share from PPT data)

Phase 6 — Data Triangulation and Market Validation
No single methodology is relied upon in isolation. Multiple independent estimation approaches are combined and reconciled to ensure consistency, accuracy, and analytical defensibility. Any material deviations between approaches are investigated and adjusted through additional validation cycles.
The final market size is derived through weighted triangulation of all validated methodologies. Any material deviations between approaches are investigated and adjusted through additional validation cycles. The outcome represents the most realistic assessment of the market based on available evidence and expert confirmation ensuring that volume and value estimates are fully consistent with one another.
Triangulation Framework — Input Contribution Weight
Relative weight each sizing input contributes to the final reconciled market estimate

Phase 7 — Forecast Modeling: Projecting Future Market Evolution
Forecasting evaluates the future trajectory of the market using a combination of quantitative indicators and qualitative assessments across economic, industry, and regulatory dimensions. Rather than simple extrapolation, each driver is independently modeled and integrated into a composite forecast.
Macroeconomic Indicators
GDP growth, industrial production, manufacturing output, construction activity, consumer spending, and capital investment form the quantitative foundation of long-term demand projections. These are applied at country, regional, and global levels.
Industry Growth Drivers
Urbanization, infrastructure development, industrialization, technological innovation, sustainability initiatives, and evolving product performance requirements are assessed at regional and industry levels — capturing both structural and cyclical demand drivers.
Capacity Expansion Analysis
Announced plant expansions, new manufacturing facilities, technology upgrades, and strategic investments are evaluated to determine future supply-demand dynamics and potential market tightness or oversupply situations.
Regulatory & Sustainability
Environmental regulations, chemical safety standards, emission reduction targets, circular economy initiatives, and sustainability requirements are incorporated as they often influence product adoption rates and market growth trajectories.
Scenario Forecast Range — Indexed Market Growth (Year 1–10)
Illustrative indexed growth trajectories across Base, Optimistic, and Pessimistic scenarios over a 10-year forecast horizon

Forecast Drivers — Relative Impact Score by Category
Impact score (0–100) of each driver type on chemicals & materials market forecast




Comments
Share your thoughts, ask a question, or provide feedback about this report.