Content
What is the Non-ferrous Scrap Recycling Market Size and Share?
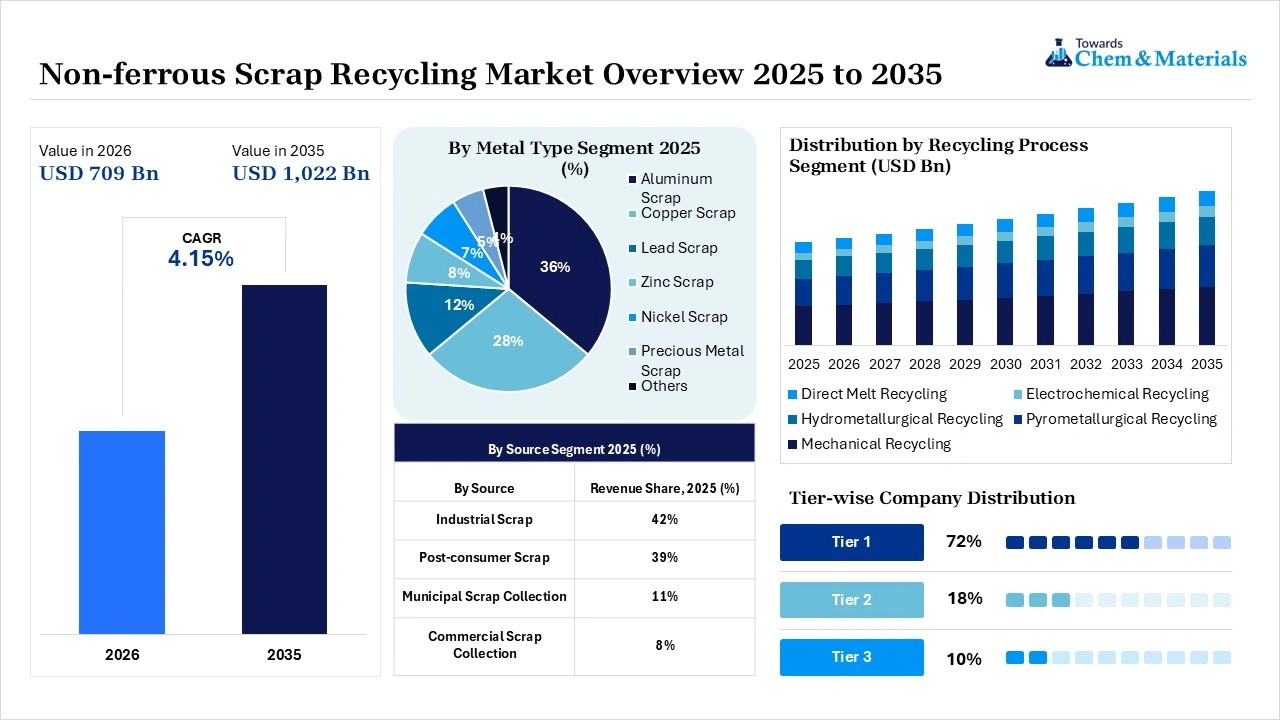
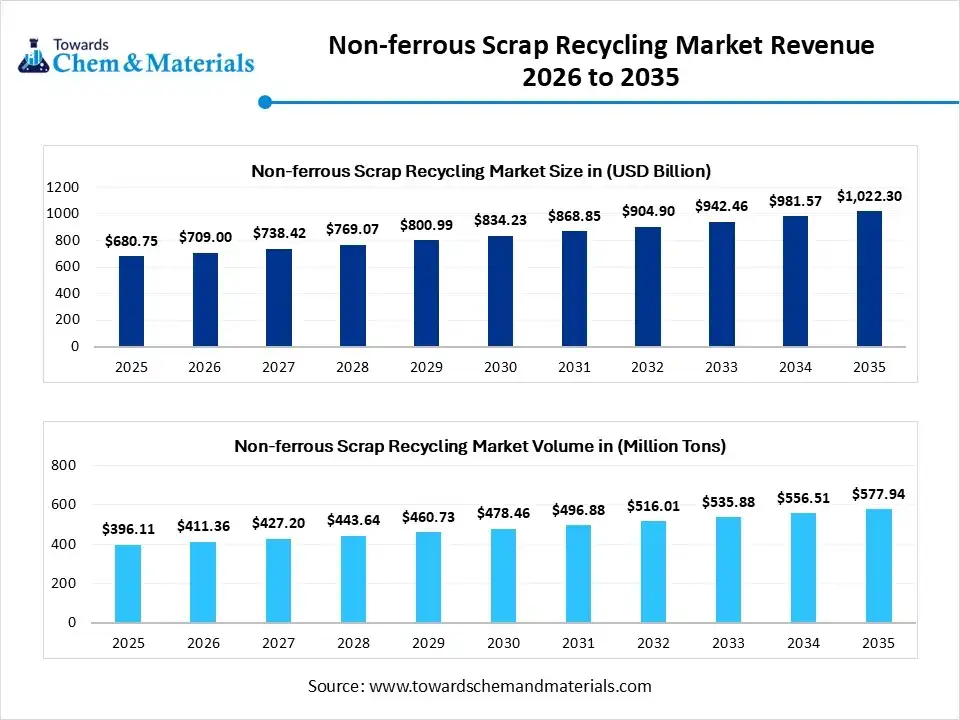
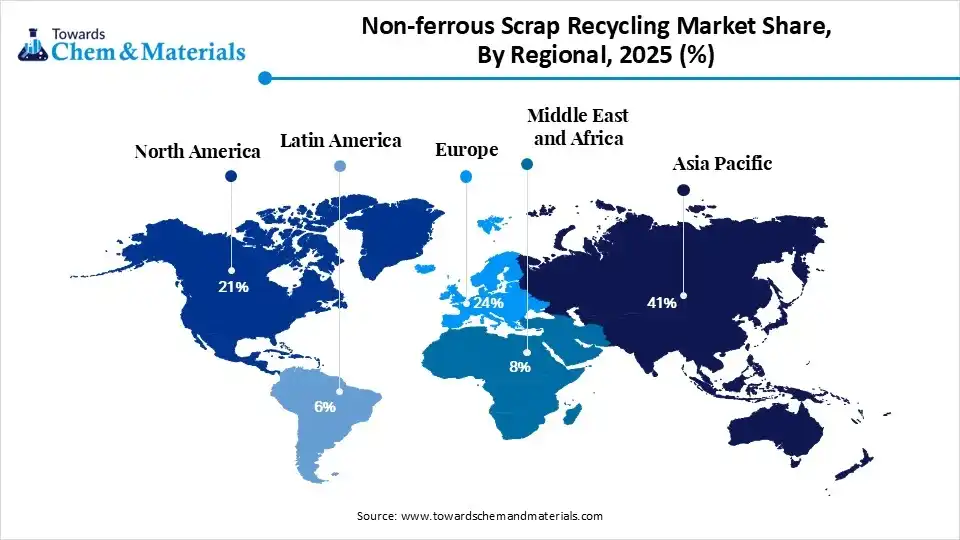
The non-ferrous scrap recycling market size was valued at USD 680.75 billion in 2025, is estimated to reach USD 709.00 billion in 2026, and is projected to reach USD 1,022.30 billion by 2035, exhibiting a compound annual growth rate (CAGR) of 4.15% over the forecast period from 2026 to 2035. Asia Pacific dominated the non-ferrous scrap recycling market with the largest revenue share of 41% in 2025 and is expected to grow at the fastest CAGR of 4.28% during the forecast period. In terms of volume, the non-ferrous scrap recycling industry is projected to grow from 396.11 million tons in 2025 to 577.94 million tons by 2035. growing at a CAGR of 3.85% from 2026 to 2035.

The increasing regulatory mandates for a circular economy are the key factor driving the growth of the market. Increasing demand for conductive and lightweight metals, coupled with the rapid transition towards electric vehicles (EVs), can fuel market growth further. It encompasses the collection, processing, and trading of discarded metals that do not have iron, like copper, aluminium, lead, zinc, and nickel. Fueled by sustainability goals and cost advantages, it recovers corrosion resistance and high-value secondary metals for industries such as construction, automotive, and electronics.

The non-ferrous scrap recycling market is shaped by a dynamic interplay of regulatory frameworks, technological advancements, and commodity price volatility. These factors collectively dictate the strategic operations of recycling facilities and define the broader industry landscape. Furthermore, the sector is poised for a significant surge in innovation as enterprises increase their investments in advanced recycling technologies. Integrating digital solutions into logistics and supply chain management optimizes operations, hence enhancing the accessibility and efficiency of recycling initiatives.
Market Highlights
- By region, Asia Pacific dominated the market with the largest share of 41% in 2025 and is expected to grow at the fastest CAGR of 8.2% over the forecast period. The dominance and growth of the region can be attributed to the rapid urbanisation across emerging nations.
- By region, Europe held the market share of 24% in 2025. The growth of the region can be credited to the increasing recycling rates due to stringent environmental regulations.
- By metal type, the aluminum scrap segment dominated the market with the largest share of 36% in 2025. The dominance of the segment can be attributed to the increasing aluminum scrap recovery rates.
- By metal type, the copper scrap segment is expected to grow at the fastest CAGR of 7.8% over the forecast period. The growth of the segment can be credited to the increasing copper scrap demand from EV wiring.
- By source, the industrial scrap segment dominated the market with the largest share of 42% in 2025. The dominance of the segment can be driven by metal producers increasingly integrating circular economy strategies.
- By source, the post-consumer scrap segment is expected to grow at the fastest CAGR of 7.9% over the forecast period. The growth of the segment is owing to the increasing number of end-of-life vehicles.
- By recycling process, the mechanical recycling segment dominated the market with the largest share of 38% in 2025. The dominance of the segment can be attributed to its cost-effective recycling technology.
- By recycling process, the hydrometallurgical recycling segment is expected to grow at the fastest CAGR of 8.4% over the forecast period. The growth of the segment can be credited to the increasing reliance on the hydrometallurgical process.
- By application, the construction segment dominated the market with the largest share of 23% in 2025. The dominance of the segment is owing to the rapid urbanization.
- By application, the electrical & electronics segment is expected to grow at the fastest CAGR of 8.1% during the projected period. The growth of the segment is due to the expanding electronics manufacturing sector.
- By scrap grade, the clean scrap segment dominated the market with the largest share of 46% in 2025. The dominance of the segment can be credited to its lower processing costs and higher recovery efficiency.
- By scrap grade, the alloyed scrap segment is expected to grow at the fastest CAGR of 7.6% during the study period. The growth of the segment can be driven by advanced separation technologies.
- By distribution channel, the direct sales segment dominated the market with the largest share of 44% in 2025. The growth of the segment can be attributed to the strategic partnership supporting long-term procurement stability.
- By distribution channel, the online B2B trading platforms segment is expected to grow at the fastest CAGR of 8.1% during the study period. The growth of the segment can be credited to the technology integration, boosting digital scrap trading.
Next-Gen Non-Ferrous Scrap Recycling: Trends & Technology
- Increasing demand for recycled materials is the latest trend in the market, shaping positive market growth.
- Driven by the increasing focus on sustainability and resource conservation. Industries like construction, automotive, and electronics are rapidly sourcing to fulfil their production demands.
- The increasing awareness regarding the environmental impact of resource and waste depletion is substantially impacting the market. Consumers are rapidly becoming aware of their sustainable footprint, which leads to increased demand for sustainable practices.
- The increasing product demand from the automotive sector is another major factor driving market growth. The surge in manufacturing of electric vehicles (EVs) and the use of electronic devices propels the demand for recycled metals.
- Recycled aluminum is generally valuable in vehicle production due to its high strength and lightweight properties.
Report Scope
| Report Attributes | Details |
| Market Size and Volume in 2026 | USD 709.00 Billion / 411.36 Million Tons |
| Revenue Forecast in 2035 | USD 1,022.30 Billion / 577.94 Million Tons |
| Growth Rate | CAGR 4.15% |
| Base Year of Estimation | 2025 |
| Forecast Period | 2025 - 2035 |
| High Impact Region | Asia Pacific |
| Segment Covered | By Metal Type, By Source, By Recycling Process, By Application, By Scrap Grade, By Distribution Channel, By Region |
| Key Companies Profiled | Aurubis AG, Chiho Environmental Group Limited, Hindalco Industries Ltd., Kuusakoski, Matalco Inc., OmniSource Corp., Recyclex, SA Recycling LLC, Sims Metal Management Inc., TSR Recycling GmbH & Co. KG |
How Cutting-Edge Technologies Are Revolutionizing the Non-ferrous Scrap Recycling Market?
Advanced technologies such as robotics, advanced sensors, Artificial Intelligence (AI), and next-generation smelting are revolutionizing the market by fuelling processing speed, automating sorting, and increasing the purity of valuable metals. Furthermore, innovative systems can analyse materials' color, shape, and chemical composition, picking out crucial metals while excluding contaminants.
Supply Chain Analysis of the Non-ferrous Scrap Recycling Market
- Feedstock Procurement:It refers to the sourcing, purchasing, and supply chain management of recycled metals that do not contain iron. The industry emphasises securing secondary raw materials from scrap yards.
- Major Players: Sims Limited, Aurubis AG
- Chemical Synthesis and Processing :It emphasises recovering and refining non-magnetic, iron-free metals from complex waste through advanced technologies such as pyrometallurgical and hydrometallurgical.
- Major Players: BASF SE, Hindalco Industries Ltd.
- Packaging and Labeling :It refers to the recovery and processing of non-ferrous metals such as copper, aluminium, and zinc used in industrial and consumer packaging.
- Major Players: Novelis Inc, European Metal Recycling Ltd.
- Regulatory Compliance and Safety Monitoring :It includes the legally mandated frameworks, safety standards, and environmental protocols governing the processing of metals like aluminum, copper, and zinc.
- Major Players: SA Recycling LLC, MTC Group
Non-ferrous Scrap Recycling Market's Regulatory Landscape: Global Regulations
| Country/Region | Key Regulations |
| European Union (EU) | Non-OECD Export Ban: Beginning May 21, 2027, exports of non-hazardous waste (including recycled copper and aluminium) to non-OECD nations are banned unless the importing country specifically applied and was approved on an official EU list. The first official list of authorized non-OECD destinations will be published by November 21, 2026. |
| China | 2025-2026 Industrial Action Plan: Jointly rolled out by eight government bodies, this policy mandates increasing national secondary non-ferrous metal output to over 20 million tonnes. |
| India | Extended Producer Responsibility (EPR) Mandate: Under the Hazardous and Other Wastes Amendment Rules, non-ferrous metals (aluminium, copper, zinc, brass, lead, tin, nickel, and magnesium) officially enter a strict EPR compliance regime. |
Market Dynamics
Drivers
Technological Advancements
Ongoing innovations in mobile scrap processing, smart collection bins, blockchain for transparent supply chain tracking, and AI-driven market analysis for creating new products are the major factors driving market growth. These technologies can enhance recovery rates and reduce contamination to ensure high-quality recycled materials. In addition, the integration of artificial intelligence-driven sorting technologies has demonstrated a quantifiable increase in the purity of recycled metals, hence enhancing their commercial viability for manufacturers.
Restraint
Supply Quality Issues
Post-consumer scrap generally contains complex mixtures of solid or liquid residues, which is the major factor hindering the market growth, along with the purification difficulties. Separating non-ferrous metals from harmful elements, metals, or plastics needs specialized processing to fulfill high-purity industrial standards. Moreover, the limited availability of high-purity, ready-to-process scrap material impedes the steady manufacturing of premium recycled alloys.
Opportunity
Advanced Optical Sorting
Investing in X-ray transmission, automated sensor-based sorting, and AI-driven scrap vision systems cuts manual grading errors and upgrades mixed scrap piles into premium-grade purities. Using high-throughput industrial mechanical stripping machinery enables operators to convert inexpensive insulated copper wire into high-margin bare bright copper rapidly. Furthermore, upgrading smelting operations to run on cleaner alternative fuels or sustainable chemical leaching significantly reduces carbon tax liabilities and satisfies corporate green steel and metal purchasing mandates. This transition directly minimizes greenhouse gas (GHG) emissions, giving long-term environmental and operational sustainability benefits.
Segmental Insights
Metal Type Insights
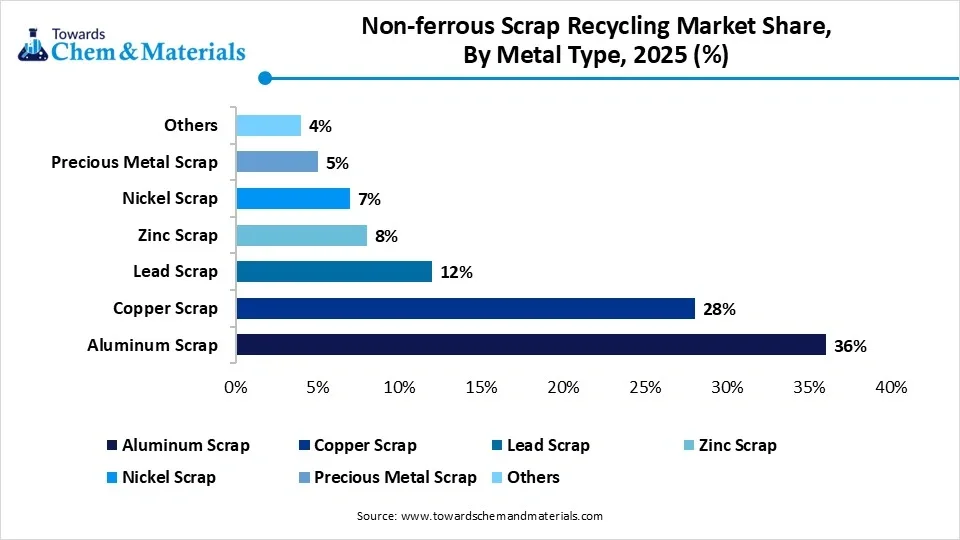
The aluminum scrap segment dominated the market with the largest share of 36% in 2025. The dominance of the segment can be attributed to the increasing aluminium scrap recovery rates and the growth of EV manufacturing facilities across the globe. Secondary aluminium production minimizes energy consumption.
")
The copper scrap segment held the market share of 28% in 2025 and is expected to grow at the fastest CAGR of 7.8% over the forecast period. The growth of the segment can be credited to the increasing copper scrap demand from EV wiring and renewable energy systems. Electronics recycling growth supports continuous copper recovery growth.
The lead scrap segment held the market share of 12% in 2025. The growth of the segment can be linked to the increasing need for automotive battery replacement and regulatory collection systems, enhancing lead recovery efficiency. Used lead acid battery recycling continues to drive a stable lead scrap processing.
Non-ferrous Scrap Recycling Market Share, By Metal Type, 2025 (%)
| By Metal Type | Revenue Share, 2025 (%) |
| Aluminum Scrap | 36% |
| Copper Scrap | 28% |
| Lead Scrap | 12% |
| Zinc Scrap | 8% |
| Nickel Scrap | 7% |
| Precious Metal Scrap | 5% |
| Others | 4% |
Source Insights
The industrial scrap segment dominated the market with the largest share of 42% in 2025. The dominance of the segment can be driven by metal producers increasingly integrating circular economy strategies and industrial recycling, improving raw materials efficiency and cost optimisation. Shredding and sorting technologies are widely adopted for efficient processing.
The post-consumer scrap segment held the market share of 39% in 2025 and is expected to grow at the fastest CAGR of 7.9% over the forecast period. The growth of the segment is owing to the increasing end-of-life vehicles, electronic waste, and packaging materials, driving post-consumer recovery volumes. Governments are strengthening recycling regulations across the globe.
The municipal scrap collection segment held the market share of 11% in 2025. The growth of the segment is due to ongoing infrastructure investments improving efficiency and public sustainability initiatives supporting household recycling participation across the globe.
Non-ferrous Scrap Recycling Market Share, By Source, 2025 (%)
| By Source | Revenue Share, 2025 (%) |
| Industrial Scrap | 42% |
| Post-consumer Scrap | 39% |
| Municipal Scrap Collection | 11% |
| Commercial Scrap Collection | 8% |
Recycling Process Insights
The mechanical recycling segment dominated the market with the largest share of 38% in 2025. The dominance of the segment can be attributed to its cost-effective recycling technology and automation, improving overall operational efficiency. Shredding and sorting technology is widely adopted for efficient processing.
The hydrometallurgical recycling segment held the market share of 18% in 2025 and is expected to grow at the fastest CAGR of 8.4% over the forecast period. The growth of the segment can be credited to the increasing reliance on hydrometallurgical processes for high-purity metal extraction and environmental regulations encouraging cleaner recycling technologies.
The pyrometallurgical recycling segment held the market share of 27% in 2025. The growth of the segment can be linked to the increasing secondary metal manufacturing technologies and high metal recovery, supporting widespread adoption. Smelting and refining facilities are continuously processing metals on a large scale.
Non-ferrous Scrap Recycling Market Share, By Recycling Process, 2025 (%)
| By Recycling Process | Revenue Share, 2025 (%) |
| Mechanical Recycling | 38% |
| Pyrometallurgical Recycling | 27% |
| Hydrometallurgical Recycling | 18% |
| Electrochemical Recycling | 7% |
| Direct Melt Recycling | 10% |
Application Insights
The construction segment dominated the market with the largest share of 23% in 2025. The dominance of the segment is owed to the rapid urbanization driving long-term construction demand and the ongoing development of green building projects. Sustainable construction boosts recycled metal adoption further.
The electrical & electronics segment held the market share of 21% in 2025 and is expected to grow at the fastest CAGR of 8.1% during the projected period. The growth of the segment is due to the expanding electronics manufacturing sector and consumer preference for recyclable packaging. Circular economy initiatives boost recovery activities.
The automotive segment held the market share of 19% in 2025. The growth of the segment can be attributed to the increasing demand for non-ferrous scrap metals and the surge in EV production with the manufacturing of vehicles. Battery recycling supports secondary metal supply growth.
Non-ferrous Scrap Recycling Market Share, By Application, 2025 (%)
| By Scrap Grade | Revenue Share, 2025 (%) |
| Clean Scrap | 46% |
| Mixed Scrap | 27% |
| Alloyed Scrap | 18% |
| Contaminated Scrap | 9% |
Scrap Grade Insights
The clean scrap segment dominated the market with the largest share of 46% in 2025. The dominance of the segment can be credited to its lower processing costs and higher recovery efficiency. Industrial buyers are focusing on quality feedstock availability. High-purity recyclable metals are preferred by secondary smelters due to lower processing costs.
The alloyed scrap segment held the market share of 18% in 2025 and is expected to grow at the fastest CAGR of 7.6% during the study period. The growth of the segment can be driven by advanced separation technologies enhancing alloy recovery rates, and sustainable sourcing strategies boosting market demand.
The mixed scrap segment held the market share of 27% in 2025. The growth of the segment is owing to the innovations in sorting technologies and demolition activities supporting recycling operations globally. Urban mining initiatives are boosting mixed scrap collection volumes.
Non-ferrous Scrap Recycling Market Share, By Scrap Grade, 2025 (%)
| By Scrap Grade | Revenue Share, 2025 (%) |
| Clean Scrap | 46% |
| Mixed Scrap | 27% |
| Alloyed Scrap | 18% |
| Contaminated Scrap | 9% |
Distribution Channel Insights
The direct sales segment dominated the market with the largest share of 44% in 2025. The growth of the segment can be attributed to the strategic partnership supporting long-term procurement stability and bulk transactions, improving supply chain efficiency. Large recyclers are keeping direct supply contracts with smelters and manufacturers.
The online B2B trading platforms segment held the market share of 8% in 2025 and is expected to grow at the fastest CAGR of 8.1% during the study period. The growth of the segment can be credited to the technology integration, boosting digital scrap trading, and industrial buyers adopting online sourcing systems for transparency.
The scrap dealers & aggregators segment held the market share of 34% in 2025. The growth of the segment can be driven by expanding urban collection systems and informal recycling channels supporting regional scrap supply. Local collection networks and aggregators are improving access to fragmentary sources.
Non-ferrous Scrap Recycling Market Share, By Distribution Channel, 2025 (%)
| By Distribution Channel | Revenue Share, 2025 (%) |
| Direct Sales | 44% |
| Scrap Dealers & Aggregators | 34% |
| Metal Exchanges | 14% |
| Online B2B Trading Platforms | 8% |
Regional Insights
How did Asia Pacific Dominate the Non-ferrous Scrap Recycling Market in 2025?
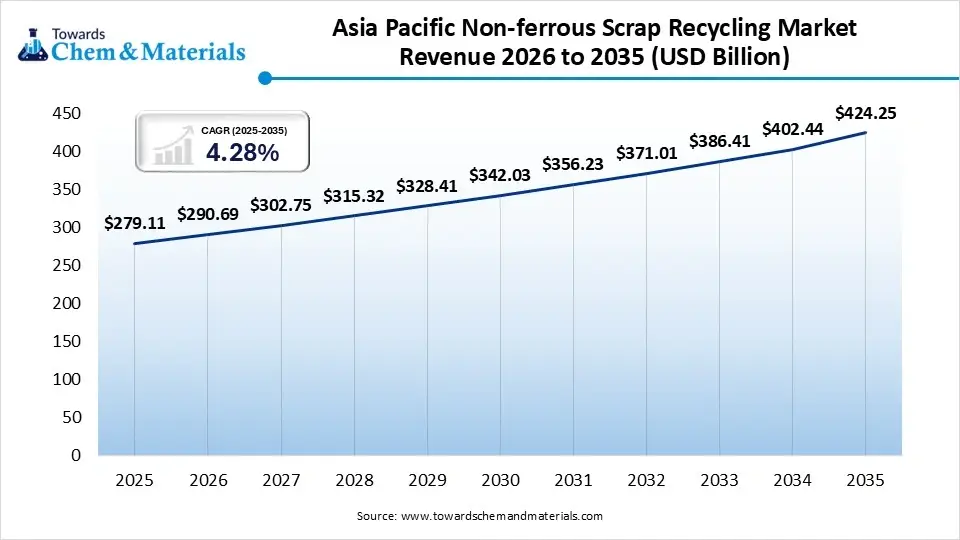
The Asia Pacific non-ferrous scrap recycling market size was estimated at USD 279.11 billion in 2025 and is projected to reach USD 424.25 billion by 2035, growing at a CAGR of 4.28% from 2026 to 2035.Asia Pacific dominated the market with the largest share of 41% in 2025 and is expected to grow at the fastest CAGR of 8.2% over the forecast period. The dominance and growth of the region can be attributed to the rapid urbanisation across emerging nations such as China and India, along with the EV and renewable energy sector growth. In addition, recycling non-ferrous metal needs substantially less energy and releases fewer greenhouse gases compared to the first extraction.

China Non-ferrous Scrap Recycling Market Trends
The growth of the market is attributed due to the ongoing growth of downstream industries such as electronics, electric vehicles, and construction. Also, extensive urbanisation and the proliferation of consumer electronics create extensive volumes of non-ferrous scrap, offering a steady stream of valuable metals.
Europe held the market share of 24% in 2025. The growth of the region can be credited to the increasing recycling rates due to stringent environmental regulations, along with the expansion of the automotive and construction sectors. Furthermore, recycling non-ferrous metals needs substantially less energy as compared to primary manufacturing, aligning directly with regional climate neutrality targets.
Non-ferrous Scrap Recycling Market Share, By Regional, 2025 (%)
| Regional | Revenue Share, 2025 (%) |
| North America | 21% |
| Europe | 24% |
| Asia-Pacific | 41% |
| Latin America | 6% |
| Middle East & Africa | 8% |
Germany Non-ferrous Scrap Recycling Market Trends
In Europe, Germany dominated the market owing to the increasing demand for secondary and lightweight metals, coupled with the ongoing shift towards electric vehicles. Moreover, the country's rigorous implementation of EPR frameworks impels consumer electronics and industrial equipment market players to design products for smooth material recovery.
")
Recent Development
- In May 2025, the Indian Ministry of Mines inaugurated a specialized national portal to strengthen the recycling ecosystem for non-ferrous metals, including aluminum, copper, lead, and zinc. The initiative aims to improve sustainability, foster a circular economy, and reduce dependence on imported raw materials across key industrial sectors.(Source: recyclinginternational.com)
Non-ferrous Scrap Recycling Market Companies
- Aurubis AG: Aurubis AG is a global leader in non-ferrous metals production and one of the largest copper recyclers worldwide. Headquartered in Hamburg, Germany, the company specializes in processing complex secondary raw materials, including e-waste and industrial residues, into high-purity metals and sustainable value-added products.
- Chiho Environmental Group Limited: Chiho Environmental Group Limited (CEG) is one of the world's largest public mixed metal recyclers. Operating a vast global supply chain across Asia, Europe, and North America, CEG specializes in sorting, processing, and trading ferrous and non-ferrous scrap.
Other Companies in the Market

- Hindalco Industries Ltd.
- Kuusakoski
- Matalco Inc.
- OmniSource Corp.
- Recyclex
- SA Recycling LLC
- Sims Metal Management Inc.
- TSR Recycling GmbH & Co. KG
Segments Covered in the Report
By Metal Type
- Aluminum Scrap
- Extrusion Scrap
- Cast Aluminum Scrap
- Used Beverage Cans (UBC)
- Sheet Aluminum Scrap
- Copper Scrap
- Bare Bright Copper
- No.1 Copper Scrap
- No.2 Copper Scrap
- Copper Alloy Scrap
- Lead Scrap
- Battery Scrap
- Industrial Lead Scrap
- Zinc Scrap
- Zinc Die-cast Scrap
- Zinc Sheet Scrap
- Nickel Scrap
- Stainless Steel Nickel Scrap
- Nickel Alloy Scrap
- Precious Metal Scrap
- Gold Scrap
- Silver Scrap
- Platinum Group Metal Scrap
- Others
- Tin Scrap
- Magnesium Scrap
- Titanium Scrap
By Source
-
- Industrial Scrap
- Manufacturing Scrap
- Fabrication Scrap
- Process Waste
- Post-consumer Scrap
- Automotive Scrap
- Electronic Waste
- Packaging Waste
- Construction Waste
- Municipal Scrap Collection
- Commercial Scrap Collection
- Industrial Scrap
By Recycling Process
- Mechanical Recycling
- Shredding
- Sorting
- Briquetting
- Pyrometallurgical Recycling
- Smelting
- Refining
- Hydrometallurgical Recycling
- Leaching
- Solvent Extraction
- Electrochemical Recycling
- Direct Melt Recycling
By Application
- Construction
- Structural Components
- Roofing & Cladding
- Automotive
- Vehicle Components
- EV Battery Components
- Electrical & Electronics
- Wiring & Cables
- Circuit Components
- Consumer Electronics
- Packaging
- Beverage Cans
- Food Packaging
- Industrial Machinery
- Equipment Components
- Industrial Tools
- Aerospace & Defense
- Aircraft Components
- Defense Equipment
- Energy
- Renewable Energy Systems
- Power Transmission
- Others
- Marine
- Consumer Goods
By Scrap Grade
- Clean Scrap
- Mixed Scrap
- Alloyed Scrap
- Contaminated Scrap
By Distribution Channel
- Direct Sales
- Scrap Dealers & Aggregators
- Metal Exchanges
- Online B2B Trading Platforms
By Region
- North America
- U.S.
- Canada
- Europe
- Germany
- UK
- France
- Italy
- Spain
- Sweden
- Denmark
- Norway
- Asia Pacific
- China
- Japan
- India
- South Korea
- Thailand
- Latin America
- Brazil
- Mexico
- Argentina
- Middle East and Africa (MEA)
- South Africa
- UAE
- Saudi Arabia
- Kuwait
Report Dashboard
Our Chemicals & Materials Research Solutions
- Comprehensive chemicals & materials market analysis
- Competitive landscape intelligence dashboard
- Material innovation & sustainability development tracker
- Market sizing & demand forecasting tools
- Chemicals & materials trend intelligence reports
- Customer application behavior insights
- Customized chemicals & materials research solutions
Chemical Supplier Solutions
- Supplier identification & capability mapping
- Production capacity & geographic footprint analysis
- Quality & performance monitoring
- Compliance & regulatory insights
- Commercial readiness assessment
- Supplier network relationship mapping
Category Intelligence Solutions
- Chemical category overview & segmentation
- End-use demand patterns & application insights
- Raw material pricing & cost structure analysis
- Industry dynamics & competitive structure
- Supply chain & distribution mapping
- Manufacturing benchmarks & industry standards
- Key reports & strategic deliverables
Customer Insights Analytics
- Buyer profile & overview
- Spend analysis & scope
- Procurement strategy & model
- Vendor criteria & expectations
- Contract terms & policies
- Market entry & engagement strategy
- Pain points & buying triggers
- Research outputs & insights
Pricing Intelligence Solutions
- Chemical price benchmarking & comparisons
- Raw material trends & cost insights
- Indexation models & price adjustment analysis
- Total material cost evaluation
- Commercial agreements & contract terms
Brand Intelligence Solutions
- Brand positioning within markets
- Market share & competitive presence
- Customer perception & brand performance
- Go-to-market effectiveness strategy
- Digital presence & industry reputation
- Performance indicators & growth gaps
FAQ's
Select User License to Buy
Figures (6)