Content
What is Non-Ferrous Metals Market Size and Share?
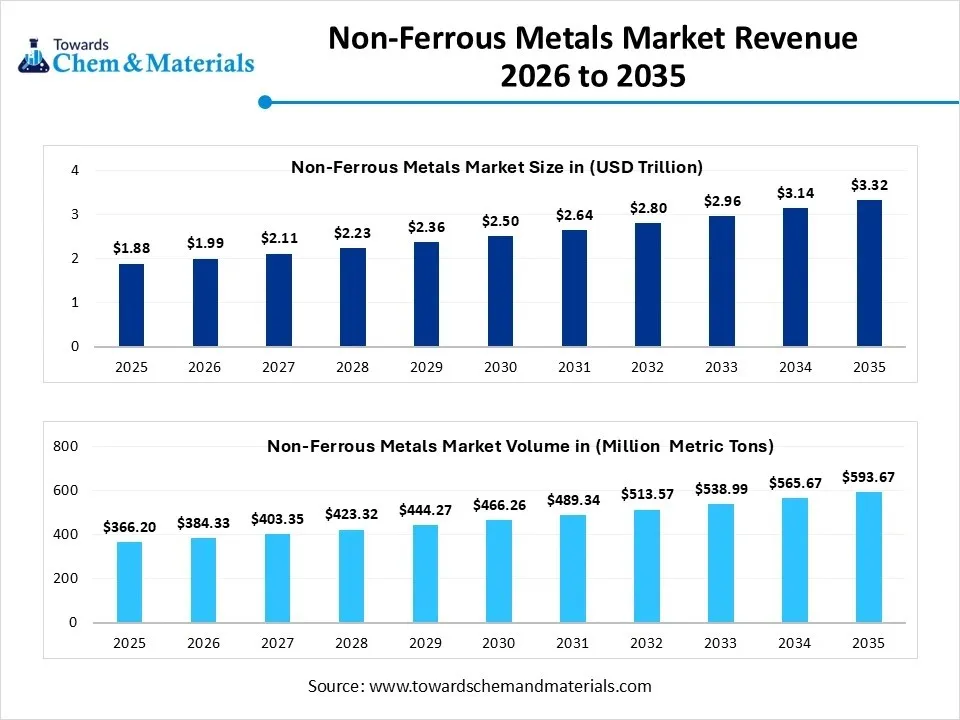
The global non-ferrous metals market size was valued at USD 1.88 trillion in 2025, is estimated to reach USD 1.99 trillion in 2026, and is projected to reach USD 3.32 trillion by 2035, exhibiting a compound annual growth rate (CAGR) of 5.85% over the forecast period from 2026 to 2035.Asia Pacific dominated the non-ferrous metals market with the largest revenue share of 55% in 2025 and is expected to grow at the fastest CAGR of 5.92% during the forecast period. In terms of volume, the non-ferrous metals market is projected to grow from 366.2 million metric tons in 2025 to 593.7 million metric tons by 2035. growing at a CAGR of 4.95% from 2026 to 2035.The EV industry demands metals as it is a lightweight material that increases fuel efficiency and supports a sustainable shift to renewable energy, demanding copper, nickel, and Aluminum, boosting the market. The partnership of key manufacturers like ANMA India and SMS group to increase the supply chain due to a surge in demand for the promotion of environmental and economic benefits is a key factor in the expansion of the product in the coming years.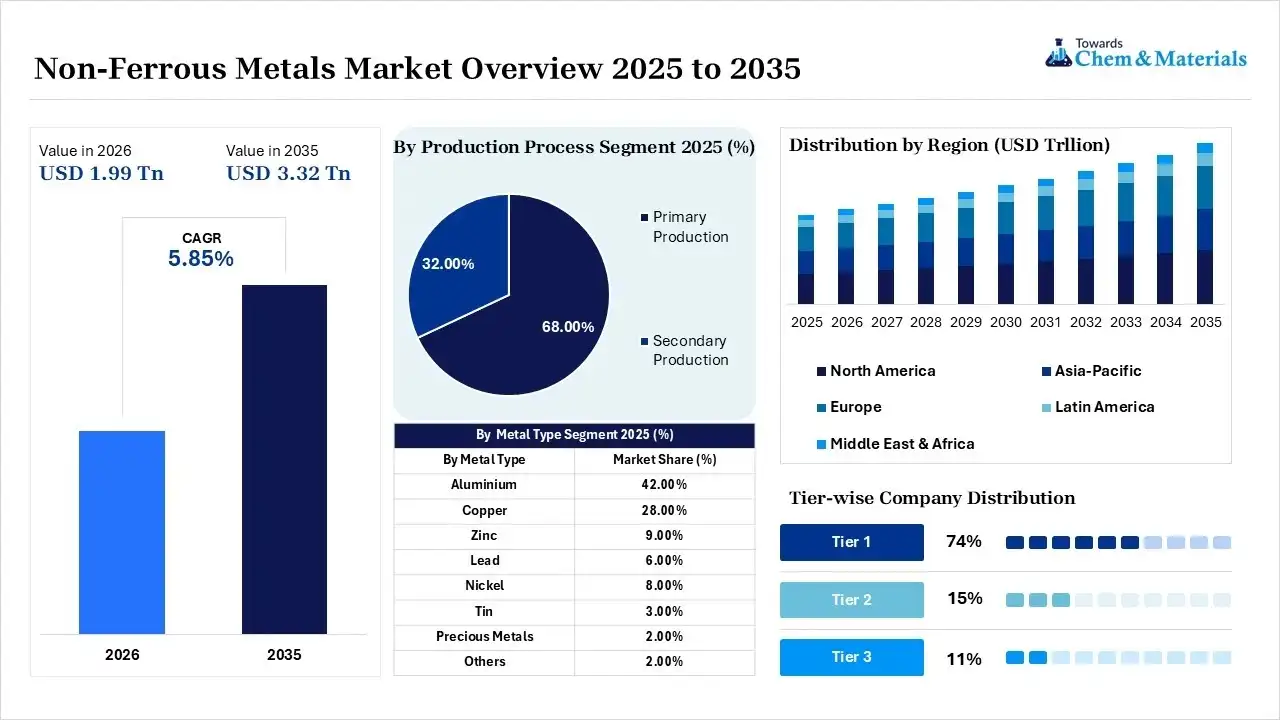
Market Highlights
- By region, Asia Pacific dominated the non-ferrous metals market with a share of 55% in 2025 and is expected to grow at a CAGR of 6.40% in the forecast period.
- By region, the Middle East and Africa held 5% market share in 2025 and are expected to experience the fastest growth with a CAGR of 6.6% in the forecast period.
- By metal type, the aluminium segment dominated the market with a 42% share in 2025 and is expected to grow at a CAGR of 6.20 % in the forecast period.
- By metal type, the copper segment held 28% market share in 2025 and is expected to have the fastest growth with a CAGR of 6.8% in the forecast period.
- By product form, the ingots segment dominated the market with a 30% share in 2025 and is expected to grow at a CAGR of 5% in the forecast period.
- By product form, the sheets and plates segment held 18% market share in 2025 and is expected to have the fastest growth with a CAGR of 6.3% in the forecast period.
- By production process, the primary production segment dominated the market with a 68% share in 2025 and is expected to grow at a CAGR of 5.20% in the forecast period.
- By production process, the secondary production segment held 32% market share in 2025 and is expected to have the fastest growth with a CAGR of 7.10% in the forecast period.
- By end-use industry, the construction segment dominated the market with a 26% share in 2025 and is expected to grow at a CAGR of 5.20% in the forecast period.
- By end-use industry, the automotive and transportation segment held 18% market share in 2025 and is expected to have the fastest growth with a CAGR of 6.9% in the forecast period.
- By distribution channel, the direct sales segment dominated the market with a 56% share in 2025 and is expected to grow at a CAGR of 5.50% in the forecast period.
- By distribution channel, the online industrial procurement segment held 4% market share in 2025 and is expected to have the fastest growth with a CAGR of 8.5% in the forecast period.
Nonferrous metals are the are metals that do not contain any iron, like Aluminum, zinc, lead, and copper, which makes them non-magnetic, making them more resistant to corrosion when it is exposed to moisture, which is a key property for rising applications and demand from consumers. The most commonly used non-ferrous metals are copper, precious metals, Aluminum, magnesium, zinc, titanium, lead, nickel, cobalt, and chromium. Precious metals include gold, platinum, and silver, which are extensively used for making jewellery and luxury items. Non-ferrous metals are used for their wide range of applications and are also recyclable. According to the report, almost 40% of the copper demand is fulfilled by recycled materials, and 30% of zinc is also sourced from secondary zinc.
The non-ferrous metals are extracted from raw ores by a process called electrolytic reduction. Industries also rely heavily on recycled materials, requiring 99% less energy than primary production. The metals are shaped by the manufacturers by extrusion, die-casting, and rolling. The key demand and applications like transportation, electrical and electronics, green energy and EVs, and construction and packaging increase the manufacturers need to produce more, expanding and boosting the global market.
- For instance, in October 2025, JTL Industries Limited expanded its non-ferrous portfolio by launching Continuous Cast (CC) Copper, strategically targeting high-growth sectors like electric vehicles and renewable energy following its acquisition of RCI Industries.
The non-ferrous metals are important because of their properties like corrosion resistance, as they are non-iron-based and do not rust, which makes them highly durable for various uses like outdoor, marine, and plumbing. High conductivity, due to the use of copper and aluminum, which are the primary conductors of electricity. Lightweight strength, which is a crucial factor for reducing fuel consumption in transportation. Recyclability, as they are repeatedly recycled, maintaining the original mechanical properties.
Global Investment Flow for Non-Ferrous Metals Market 2026
The major companies like Hindalco Industries, Hindustan Zinc, and Bright Metals are intensively investing due to renewable energy infrastructure development, and governments worldwide have introduced trade agreements to supply chains for major sectors like medical devices, defense, and aerospace.
- India is projected to invest a total of ₹65–70 trillion by 2035 to meet its growing electricity demand of over 4,000 TWh. This massive capital infusion will span across generation, transmission, distribution, and digital infrastructure to elevate Indias total power generation capacity to 1,300–1,400 GW.
(Source:energy.economictimes.indiatimes.com) - Korea Zinc is investing over $6.6 billion to build its first U.S. production facilities in Middle Tennessee. This represents the single largest private corporate capital investment in Tennessees history.
(Source:tnecd.com) - The Non-Ferrous Metals (NFM) Recycling Portal hosts the incentive scheme for promotion of critical mineral recycling, a ₹1,500 crore initiative launched by Indias Ministry of Mines under the National Critical Mineral Mission (NCMM). The Jawaharlal Nehru Aluminium Research Development and Design Centre (JNARDDC) serves as the designated Project Management Agency (PMA) to execute and monitor the scheme.
(Source:nfmrecycling.jnarddc.gov.in)
Market Growth Trends:
- The growing shift towards the use of EVs and hybrid cars, which require copper batteries and wires, also its lightweight property makes them a preferred choice, and meeting strict emission regulations in automotive and aerospace electrification is a growing trend.
- Copper is a foundation for renewable energy infrastructure like offshore wind projects and solar wind projects, maintaining structural integrity, which increases the demand from many key players in development.
- The shift in global liquidity has historically benefited the sector, particularly inflating the value of precious and base metals as inflation hedges and industrial catalysts.
Report Scope
| Report Attributes | Details |
| Market Size in 2026 | USD 1.99 Triilion/ 384.3 Million Metric Tons |
| Market Size by 2035 | USD 3.32 Trillion/ 593.7 Million Metric Tons |
| Growth Rate from 2026 to 2035 | CAGR 5.85% |
| Base Year of Estimation | 2025 |
| Forecast Period | 2026 - 2035 |
| Dominant Region | Asia Pacific |
| Segment Covered | By Metal Type, By Product Form, By Production Process, By End-Use Industry, By Distribution Channel, By Region |
| Key Profiled Companies | Aluminum Corporation of China, BHP Group, Freeport-McMoran Inc., Vale S.A., Sumitomo Metal Mining Co., Ltd., Anglo American plc, Mitsubishi Materials Corporation, Novelis Inc., Antofagasta plc, Zhongjin Lingnan Nonfemet |
Key Technological Shifts in the Non-Ferrous Metals Market:
The integration of AI in non-ferrous metals is shifting towards smart and AI-driven manufacturing from traditional manufacturing by major companies like KoBold Metals and Earth AI, which involves AI-driven exploration and sourcing to accelerate the discovery of critical energy transition metals. The advanced metal recycling and machine learning are making it easy to sort scrap, which helps in identifying and classifying scrap mixed with ferrous metals, which helps in metal recovery. The predictive maintenance and quality control like prediction of defects on production lines in real time and it helps in also helps in monitoring the health of heavy machinery, which also prevents costs, which is a major driver. The supply chain and demand forecasting help in optimizing logistics.
Supply Chain Analysis of Non-Ferrous Metals Market:
Mining, Smelting & Processing
- Non-ferrous metals such as aluminum, copper, zinc, nickel, lead, and tin are produced through mining, ore concentration, smelting, electrorefining, alloying, casting, and rolling or extrusion processes to achieve the required purity and performance properties for industrial applications.
- Rio Tinto is a global leader in non-ferrous metals; the companys focus heavily depends upon supplying base metals, which are a critical factor for the global energy transition. Along with primary base materials, the company also produces nitrates, lithium, and titanium dioxide.
- Key players: Rio Tinto, Glencore, Alcoa Corporation, Hindalco Industries.
Quality Testing and Certification
- Non-ferrous metals require certifications ensuring chemical composition accuracy, mechanical performance, traceability, and regulatory compliance. Key certifications include ISO quality standards, ASTM material specifications, RoHS compliance for electronics applications, and industry-specific alloy certifications.
- Glencore is one of the world’s largest producers and marketers of non-ferrous metals. Their portfolio is heavily focused on energy-transition minerals, with primary global production spanning Copper, Zinc, Nickel, Cobalt, and Aluminium.
- Key players: ISO (International Organization for Standardization), ASTM International, SAE International, TÜV SÜD.
Distribution to Industrial Users
- Non-ferrous metals are supplied to automotive manufacturers, aerospace companies, construction material producers, electrical and electronics manufacturers, packaging industries, and renewable energy equipment producers.
- Hindalco Industries is a global non-ferrous metals powerhouse and the metals flagship company of the Aditya Birla Group. They are Indias largest fully integrated aluminium producer and the worlds largest aluminium rolling and recycling company via their subsidiary, Novelis.
- Key players: Alcoa Corporation, Hindalco Industries, Glencore.
Non-Ferrous Metals Regulatory Landscape
| Country / Region | Regulatory Body | Key Regulations / Policies | Focus Areas |
| United States | EPA (Environmental Protection Agency) OSHA (Occupational Safety & Health Administration) MSHA (Mine Safety and Health Administration) Trade & Commerce Authorities (DOC/BIS) |
Clean Air & Water Acts (emissions/effluent limits), TSCA / chemical reporting for metal compounds. OSHA/MSHA safety standards. Export/import controls on critical minerals |
Environmental compliance in mining & smelting Worker health and safety in mining/refining Materials reporting & trade controls |
| European Union | European Chemicals Agency (ECHA) European Commission EU Member State Authorities |
REACH (Registration, Evaluation, Authorization & Restriction of Chemicals) Industrial Emissions Directive (IED) Carbon Border Adjustment Mechanism (CBAM) Circular economy & resource efficiency policies |
Chemical substance disclosure & safety Emission & waste controls Carbon regulation on imports Recycling & end-of-life metal management |
| China | Ministry of Ecology and Environment (MEE) Ministry of Industry and Information Technology (MIIT) State Council / Trade Authorities |
National air/water pollution control standards Dual carbon/carbon peak targets for the metals industries Capacity caps and industrial planning |
Emissions & pollutant limits Peak carbon and decarbonization goals Production capacity management |
| India | Ministry of Environment, Forest & Climate Change (MoEFCC) Central Pollution Control Board (CPCB) |
Air/Water Acts and pollution control Hazardous & Other Wastes (Management & Transboundary Movement) Rules Non-Ferrous Metal Waste Management Rules 2025 (effective 2026) |
Emissions & effluent control Waste handling & recycling Mandatory registration & reporting |
What are the Key Product Types of Non-Ferrous Metals?
Non-ferrous metals are the metals that do not contain iron, which offer lightweight properties, corrosion resistance, and high conductivity. They are usually recycled from scrap. They are rigorously used in commercial, residential, and industrial applications. They are selected according to their mechanical or structural application. Depending on the end use, the product or the material is formed or cast accordingly into the finished part. The luxury metals like gold and silver are treated and handled with care due to their high value in the market.
The Key Copper Types are Characterized Into:
Base metals such as Aluminum, zinc, copper, nickel, and lead
Base metals are common, inexpensive, and abundant; these metals can oxidize and corrode easily, and they have lower intrinsic value. They are an essential part of infrastructure development, the global economy, and manufacturing because of their durability, conductivity, and malleability.
Precious metals such as gold, silver, and platinum
Precious metals are rare, naturally occurring, with high economic value, prized for their rarity, having a luxurious and lustrous appearance, and are highly resistant to corrosion and oxidation. They are traded as investments and are used across high tech ad manufacturing units and sectors, which makes it a highly demanded metal.
Specialty/refractory metals such as titanium, tungsten, and magnesium
Specialty and refractory metals are a unique class of metals that have an exceptionally high melting point, with exceptional hardness and resistance to wear and corrosion. Due to their extreme heat tolerance, they are fabricated via powder metallurgy.
Non-Ferrous Metals Market Dynamics
What are the Key Growth Drivers in the Non-Ferrous Metals Market?
The key growth drivers of the non-ferrous metals market are the rapid expansion of EVs due to extensive use and growing awareness among consumers of the environment, which also boosts the growth of the market. The shift towards lightweight transportation, sustainable circular economy practices, and AI computing centers is driving the sustainable demand for the market. Other key growth drivers include the green energy transition, digitalization, advanced technology, sustainable and circular economy, aerospace and automotive lightweighting, which propel the growth of the market.
What are the Key Growth Challenges in the Non-Ferrous Metals Market?
The non-ferrous metals experience challenges that hinder growth, such as price volatility, supply disruption, energy-intensive production, strict environmental regulations, automotive sector transition, and import and export pressure. The regional economies heavily rely on imports and exports, which leave heavy tariffs and trade conflicts. The industry faces pressure to shift to a circular economy, and limits the emission decline due to declining primary ore grade, which force operates the to invest heavily in efficient production methods and cleaner technology, hindering the growth of the market.
What are the Key Growth Opportunities in the Non-Ferrous Metals Market?
The key growth opportunities that are responsible for the growth of the non-ferrous market are the global shift towards vehicle electrification, circular economy practices, and renewable energy, which boost the growth of the market. The major growth opportunity is driven by environmental goals, low-carbon smelting, and organized e-waste and scrap metal recovery. The recycling sector presents substantial revenue opportunities. Recycling copper, for instance, saves up to 85% of the energy used in primary production.
Segmental Insights
Metal Type
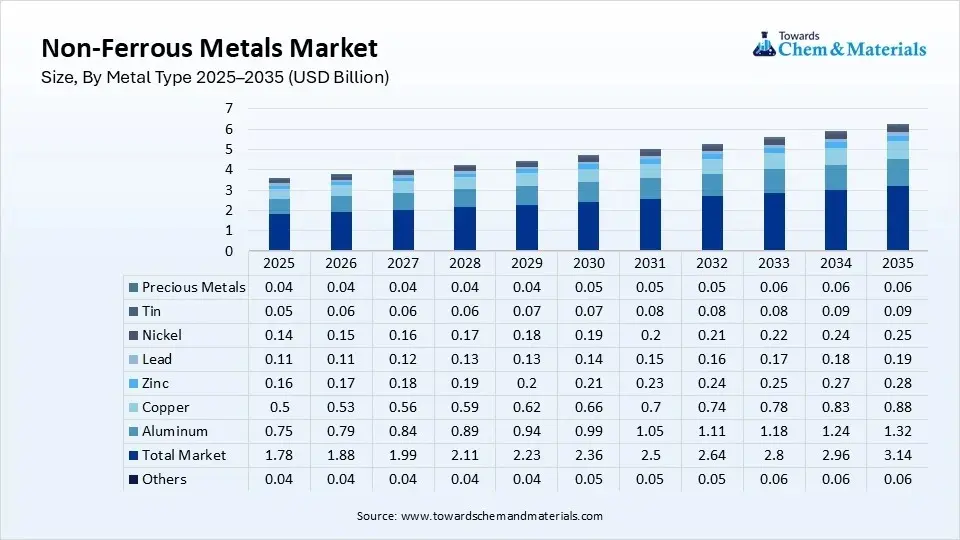
The aluminum segment dominated the market with a 42% share in 2025 and is expected to grow at a CAGR of 6.20 % in the forecast period, due to its high strength-to-weight ratio, which increases the demand from consumers for automotive which increases the fuel efficiency. Other key factors are high recyclability, aerospace durability, and regional construction and infrastructure development fuels the growth of the market.
- For instance, India’s top aluminium producers Adani Group, Vedanta, and the Aditya Birla Group are executing a combined ₹2.43 lakh crore capital expenditure cycle to nearly double the countrys production capacity. Spurred by surging domestic demand for electric vehicles, solar infrastructure, and grid expansions, along with tightening supply caps in China, three major conglomerates are leading India’s next big industrial growth cycle.
(Source: www.fortuneindia.com)
The copper segment held 28% market share in 2025 and is expected to have the fastest growth with a CAGR of 6.8% in the forecast period, due to its unparalleled electrical conductivity, exceptional thermal properties, and high recyclability. Its ubiquitous use in global electrification, renewable energy infrastructure, and the rapidly growing electric vehicle (EV) sector drives massive consumption worldwide.
Non-Ferrous Metals Market Share,By Metal Type , 2025(%)
| By Metal Type | Market Share (%) |
| Aluminum | 42.00% |
| Copper | 28.00% |
| Zinc | 9.00% |
| Lead | 6.00% |
| Nickel | 8.00% |
| Tin | 3.00% |
| Precious Metals | 2.00% |
| Others | 2.00% |
Product Form
The ingots segment dominated the market with a 30% share in 2025 and is expected to grow at a CAGR of 5% in the forecast period, due to its properties like purity and malleability, which are highly demanded by sectors such as automotive, aerospace, and electrical sectors. Companies like Glencore Plc, Rio Tinto Group, and RUSAL heavily invest and ensure a stable supply chain management, supporting growth.
The sheets and plates segment held 18% market share in 2025 and is expected to have the fastest growth with a CAGR of 6.3% in the forecast period, due to its unparalleled versatility, lightweight nature, and crucial role in mass-production industries. Sheets are essential for body panels and enclosures, while thicker plates provide structural integrity, which supports the growth and expansion of the market.
Non-Ferrous Metals Market Share,By Product Form , 2025(%)
| By Product Form | Market Share (%) |
| Ingots | 30.00% |
| Billets | 16.00% |
| Rods & Bars | 14.00% |
| Sheets & Plates | 18.00% |
| Foils | 5.00% |
| Wires | 10.00% |
| Pipes & Tubes | 4.00% |
| Powders | 2.00% |
| Others | 1.00% |
The Production Process
The primary production segment dominated the market with a 68% share in 2025 and is expected to grow at a CAGR of 5.20% in the forecast period through direct extraction. The global demand is rapidly growing. The other key factors that fuel the growth are purity and quality requirements, industrial and infrastructure scaling, and supply chain control by the major global players, which boosts the growth and expansion of the market.
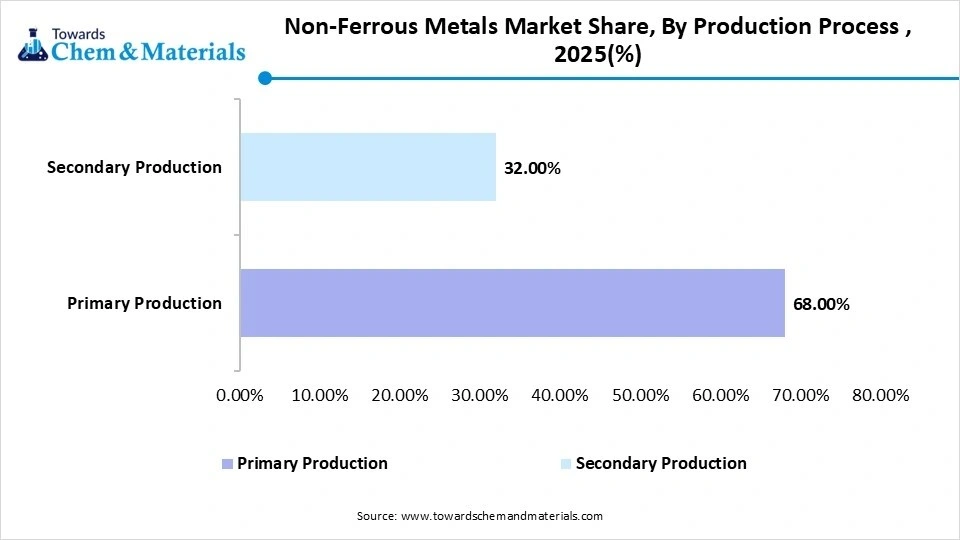
The secondary production segment held 32% market share in 2025 and is expected to have the fastest growth with a CAGR of 7.10% in the forecast period because recycling non-ferrous metals requires up to 95% less energy than primary extraction. Driven by stricter decarbonization goals and the ability of metals like aluminum and copper to retain their properties indefinitely, secondary processing quickly emerged as a cost-effective, sustainable solution.
Non-Ferrous Metals Market Share, By Production Process, 2025(%)
| By Production Process | Market Share (%) |
| Primary Production | 68.00% |
| Secondary Production | 32.00% |
End-Use Industry,
The construction Segment Dominated the Non-Ferrous Metals Market with 26% Market Share in 2025
The construction segment dominated the market with a 26% share in 2025 and is expected to grow at a CAGR of 5.20% in the forecast period due to high end infrastructure development projects and investment by major giants which demand for the durable, lightweight, and corrosion resistance material which boosts growth. as the non ferrous metals are expensively used in plumbing and piping which is used for heating and ventilation due to their resistance to corrosion expanding market growth.
- For instance, Kazakhstan plans to launch eight non-ferrous metallurgy projects in 2026, investing approximately $173.8 million and creating over 1,500 permanent jobs. According to the Ministry of Industry and Construction, this initiative expands the nations robust resource base, which includes major deposits of copper, zinc, nickel, lead, aluminum, and precious metals.
(Source: timesca.com)
The automotive and transportation segment held 18% market share in 2025 and is expected to have the fastest growth with a CAGR of 6.9% in the forecast period, due to the industry-wide push for lightweighting to meet strict global emissions regulations. By substituting heavier ferrous metals with non-ferrous materials like aluminum, copper, and magnesium, automakers improved engine power-to-weight ratios and overall vehicle efficiency.
Non-Ferrous Metals Market Share,By End-Use Industry , 2025(%)
| By End-Use Industry | Market Share (%) |
| Construction | 26.00% |
| Automotive & Transportation | 18.00% |
| Electrical & Electronics | 17.00% |
| Industrial Machinery | 12.00% |
| Aerospace & Defense | 7.00% |
| Packaging | 8.00% |
| Energy | 8.00% |
| Consumer Goods | 3.00% |
| Others | 1.00% |
Distribution Channel
The direct sales segment dominated the market with a 56% share in 2025 and is expected to grow at a CAGR of 5.50% in the forecast period. It accommodates the highly specialized, high-volume, and cyclical demands of major manufacturing industries. Direct transactions reduce costs by bypassing intermediaries, allowing buyers and sellers to establish long-term, stable relationships. Direct sales remain the backbone of the industry due to the strategic relationships required for bulk metal sourcing.
The online industrial procurement segment held 4% market share in 2025 and is expected to have the fastest growth with a CAGR of 8.5% in the forecast period by streamlining supply chains, increasing transparency, and reducing lead times. It allowed buyers to seamlessly source primary metals like aluminum, copper, and zinc and secondary recycled scrap from verified suppliers in real-time. Industrial buyers previously had to juggle dozens of different vendors for different base metals. Platforms like Metalbook consolidated ordering, tracking, and documentation into a single dashboard.
Non-Ferrous Metals Market Share, By Distribution Channel, 2025(%)
| By Distribution Channel | Market Share (%) |
| Direct Sales | 56.00% |
| Metal Service Centers | 23.00% |
| Distributors & Traders | 17.00% |
| Online Industrial Procurement | 4.00% |
Regional Analysis
How did Asia Pacific Dominate the Non-Ferrous Metals Market in 2025?
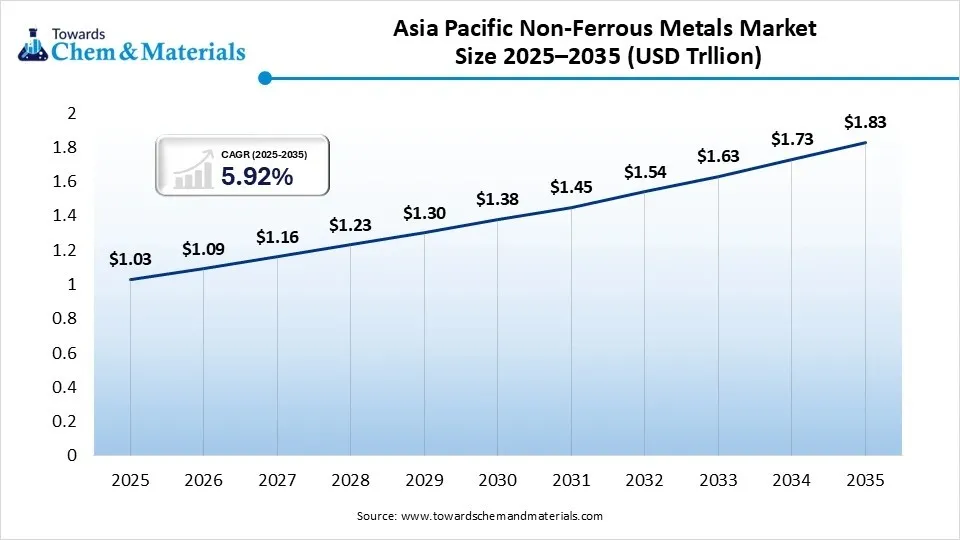
The Asia Pacific non-ferrous metals market size was estimated at USD 1.03 trillion in 2025 and is projected to reach USD 1.83 trillion by 2035, growing at a CAGR of 5.92% from 2026 to 2035. Asia Pacific dominated the market with a 55% share in 2025 and is expected to grow at a CAGR of 6.40% in the forecast period due to the presence of a robust manufacturing base, high adoption of EVs, and high-end, large-scale infrastructure investments in production by the government and other key companies, boosts the growth of the market. The presence of very large giants in the region, like Aluminum Corporation of China Limited (Chalco) and Aditya Birla Group, has increased the production capacity to meet the growing demand from the market. The regions robust scrap and recycling operations, to compact tariffs, boost supply chain sustainability and adherence to the circular economy, fuel growth.
India
Indias non-ferrous metals market is influenced by domestic demand, and the government of Indias massive infrastructure spending directly influences the growth. Indias Make in India initiative boosts domestic demand and production, and boosts the growth of the market. Domestic demand growth is exceptionally resilient, with ratings agency ICRA estimating that Indias domestic consumption growth will outpace global rates.
China
Chinas non-ferrous metals market growth is primarily driven by surging demand for lightweight, high-value materials in electric vehicles, renewable energy infrastructure, and strategic industries like aerospace and AI. Concurrently, Beijings mandate for efficiency, sustainability, and expanded secondary metal recycling is shaping market expansion.
Middle East and Africa Non-Ferrous Metals Market Growth Factor
The Middle East and Africa non-ferrous metals market size was estimated at USD 0.09 trillion in 2025 and is projected to reach USD 0.17 trillion by 2035, growing at a CAGR of 6.57% from 2026 to 2035. Middle East and Africa held a market share of 5% in 2025 and are expected to experience the fastest growth, with a CAGR of 6.6% over the forecast period, driven largely by the economic diversification initiatives and infrastructure development projects by the government, which propel the growth of the market. The massive projects such as Saudi Arabia’s Vision 2030, which heavily rely on the development of commercial real estate and industrial expansion. The regions are shifting towards green energy requirements and shifting towards renewable energy infrastructure like solar, increasing local material consumption, and influencing domestic growth.
Saudi Arabia
The countrys giga-projects, developments like NEOM and the Red Sea Project demanding aluminum and copper for smart city infrastructure, surging local mining and refining capabilities for domestic raw materials, and a rapidly expanding push for a circular economy via local scrap recycling to reduce import reliance. The governments priority of metal recycling and localized refining influences the growth and expansion of the market in the country.
UAE
The UAE growth is driven by strategic infrastructure investments, a booming national circular economy agenda, and massive electrical grid upgrades. Ongoing urban expansion in Dubai and Abu Dhabi directly drives robust demand for aluminum and copper across building and civil engineering projects. A massive billion-dollar investment in smart grids and power transmission networks is projected to demand tens of thousands of tons of additional copper.
Europe Non-Ferrous Metals Market Growth Factor
The Europe non-ferrous metals market size was estimated at USD 0.34 trillion in 2025 and is projected to reach USD 0.60 trillion by 2035, growing at a CAGR of 5.84% from 2026 to 2035. Europe held the market share of 18% in 2025 and is expected to grow at a CAGR of 5% in the forecast period, driven by the shift toward electric vehicles (EVs) and renewable energy infrastructure. Key growth factors include the European Green Deal, strict automotive emission regulations, and a major push for closed-loop recycling to meet circular economy targets. The European carbon border adjustment mechanism creates massive incentives for domestic production and adoption, which boosts the growth of the market.
United Kingdom
The United Kingdom non-ferrous metals market is primarily driven by the aerospace and defense manufacturing sectors, increasing demand for lightweight electric vehicle (EV) components, and a strong regulatory push toward a circular economy. Post-Brexit policies and millions in government investments into green metallurgy programs are helping process non-ferrous metals more efficiently while mitigating import reliance.
Italy
Italys non-ferrous metals market is propelled by the European pivot toward lightweight electric vehicles, renewable energy infrastructure, and advanced recycling. Strong process engineering capabilities, skilled labor, and the need to meet Carbon Border Adjustment Mechanism (CBAM) regulations drive steady local and regional growth.
North America Non-Ferrous Metals Market Growth Factor
The North America non-ferrous metals market size was estimated at USD 0.30 trillion in 2025 and is projected to reach USD 0.53 trillion by 2035, growing at a CAGR of 5.86% from 2026 to 2035. North America held the market share of 16% in 2025 and is expected to grow at a CAGR of 5.40% in the forecast period, driven by the adoption of EVs due to demand for automotive lightweighting, renewable energy infrastructure, and green energy and grid modernization, which boosts the growth of the market in the region. The growing and high-end projects for aerospace and defence increase the demand for metals, advancing the production adoption and manufacturing in the region, boosting further expansion. North America actually prioritized secondary metal recovery.
United States
United States non-ferrous metals market growth is primarily driven by the transition to electric vehicles (EVs), renewable energy infrastructure, and advanced aerospace manufacturing. Government policies like the Infrastructure Investment and Jobs Act and the CHIPS and Science Act further accelerate demand for copper, aluminum, and specialty metals, while strict emissions regulations boost the need for lightweight materials.
Canada
Canadas non-ferrous metals market is primarily driven by surging demand for electric vehicles and renewable energy infrastructure. The transition to green technology, alongside expanding aerospace manufacturing and localized scrap metal recycling efforts, continues to spur robust growth across the sector.
Latin America Non-Ferrous Metals Market Growth Factor
The Latin America non-ferrous metals market size was estimated at USD 0.11 trillion in 2025 and is projected to reach USD 0.20 trillion by 2035, growing at a CAGR of 6.16% from 2026 to 2035. Latin America held a market share of 6% in 2025 and is expected to grow at a CAGR of 5.70% in the forecast period, due to rising demand for EVs and renewable energy, which drives growth. Latin America, particularly countries like Chile, Peru, and Brazil, holds dominant global reserves of critical non-ferrous metals like copper and aluminum. The strong export from the region due to localized manufacturing boost the growth of the market.
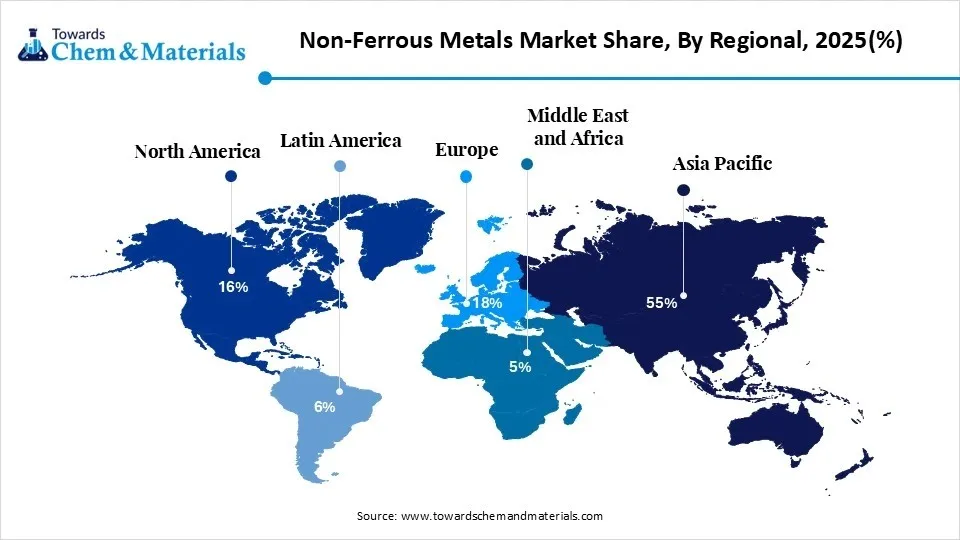
Non-Ferrous Metals Market Share, By Regional, 2025(%)
| Regional | Revenue Share, 2025 (%) |
| Asia-Pacific | 55.00% |
| Europe | 18.00% |
| North America | 16.00% |
| Latin America | 6.00% |
| Middle East & Africa | 5.00% |
Brazil
Brazil’s non-ferrous metals market is driven by expanding industrial sectors, growing domestic metal recycling infrastructure, and a transition toward lightweight manufacturing in automotive and aerospace industries. Rising consumer income and continued urbanization in cities like São Paulo and Rio de Janeiro spur sustained demand for copper in electrical equipment and aluminum in construction and consumer goods.
Argentina
Argentina’s non-ferrous metals market, primarily driven by critical minerals like copper and lithium, is experiencing explosive growth. This surge is propelled by the global green energy transition, surging electric vehicle (EV) adoption, and massive regulatory incentives like the Large Investment Incentive Regime. The Argentine government’s updated Large Investment Incentive Regime (RIGI) and updated Mining Investments Law provide tax and financial stability, successfully attracting foreign capital from major mining firms.
Competitive Analysis
The growth, as well as the major giants in the market, are heavily investing and collaborating so as to increase production through innovation to meet the growing demand, and also infrastructure development projects by the government increase the demand for domestic production.
- Adani Enterprises Limited (AEL) and International Resources Holding (IRH) have signed a Memorandum of Understanding (MoU) with the Government of Odisha to establish a $11.5 billion (₹1.08 lakh crore) integrated greenfield aluminium project. Formed as a 50:50 joint venture, this initiative marks Odisha’s largest-ever Foreign Direct Investment (FDI) proposal and Indias biggest foreign investment in the metallurgy sector.(Source: www.adanienterprises.com )
- Shyam Steel Group has opened its first overseas manufacturing facility through its subsidiary, Shyam Middle East FZC. Located in the Hamriyah Free Zone in Sharjah, United Arab Emirates (UAE), the plant marks a major international expansion into non-ferrous metals recycling and alloy manufacturing.(Source: www.steelradar.com )
Midwest Ltd has signed a Memorandum of Understanding (MoU) with Indonesias state-owned enterprise PT Perusahaan Mineral Nasional (Persero) (PERMINAS) to jointly explore and develop critical minerals and rare earth resources in Indonesia. This milestone marks Midwests first structured partnership with a Southeast Asian state-owned strategic minerals entity.(Source: scanx.trade )
Recent Developments
- In July 2026, China will launch a specialized AI engineering platform in Yunnan Province designed to accelerate the discovery, testing, and manufacturing of rare, precious, and nonferrous metal materials. Developed by the Kunming University of Science and Technology, the platform represents a major milestone in Chinas shift toward AI-driven computational metallurgy. (Source: rareearthexchanges.com)
- In July 2026, Steel Authority of India Limited (SAIL) signed a Memorandum of Understanding (MoU) with Indonesia-based PT Krakatau Steel to explore a joint venture (JV) for manufacturing stainless steel slabs. The strategic agreement was announced as finalized during Prime Minister Narendra Modi’s state visit to Indonesia.
(Source: www.newsonprojects.com) - In May 2025, Union Minister G. Kishan Reddy launched a dedicated Non-Ferrous Metal Recycling Website & Stakeholders Portal in New Delhi to formalize and boost Indias recycling ecosystem. The portal is designed as a one-stop digital hub for recycling, aiming to provide real-time data visibility, connect stakeholders, and enhance resource efficiency to support national initiatives. (Source: energy.economictimes.indiatimes.com)
Top players in the Non-Ferrous Metals Market & Their Offerings:
| Company | Company Type/Position | Major Headquarters | Geographic Presence | Martensitic stainless steels: Offerings | Key Offering/Strength of Martensitic stainless steels |
| Rio Tinto Group | global, asset-heavy publicly traded mining and metals conglomerate | London, SW1Y 4AD, United Kingdom | Asia, North America, and Europe | Aluminum, copper, lithium, and other non-ferrous metals | Diversified mining portfolio with integrated production and global supply chain. |
| Alcoa Corporation | Global Aluminum and alumina manufacturer | Pittsburgh, Pennsylvania, USA | Asia, North America, and Europe | Primary Aluminum, alumina, bauxite, and value-added aluminum products | Strong vertically integrated aluminum production and sustainable smelting technologies |
| Hindalco Industries / Novelis | Integrated producer of Aluminum and copper products. | Mumbai, Maharashtra, India | Asia Pacific, Europe, North America | Aluminum products, copper cathode, rolled products, extrusions, and foils | Integrated Aluminum and copper value chain with strong downstream capabilities |
| Glencore plc | Global producer and trader of non-ferrous metals | Baar, Switzerland | Pacific, Europe, North America, Africa | Copper, zinc, nickel, cobalt, lead, and recycling solutions | Extensive mining assets combined with global metal trading and recycling operations |
| Norsk Hydro ASA | Global Aluminum and renewable energy company | Oslo | Europe, North America, Asia Pacific | Primary Aluminum, extrusion, rolled products, and recycled Aluminum solutions | Leadership in low-carbon aluminum production and advanced recycling technologies |
Other Top Players Are
- Aluminum Corporation of China
- BHP Group
- Freeport-McMoran Inc.
- Vale S.A.
- Sumitomo Metal Mining Co., Ltd.
- Anglo American plc
- Mitsubishi Materials Corporation
- Novelis Inc.
- Antofagasta plc
- Zhongjin Lingnan Nonfemet
Segments Covered:
By Metal Type
- Aluminum
- Primary Aluminum
- Secondary (Recycled) Aluminum
- Copper
- Refined Copper
- Copper Alloys
- Zinc
- Refined Zinc
- Zinc Alloys
- Lead
- Refined Lead
- Secondary Lead
- Nickel
- Class I Nickel
- Class II Nickel
- Tin
- Refined Tin
- Tin Alloys
- Precious Metals
- Gold
- Silver
- Platinum Group Metals (PGMs)
- Others
- Magnesium
- Titanium
- Cobalt
- Lithium
- Rare Metals
By Product Form
- Ingots
- Billets
- Rods & Bars
- Sheets & Plates
- Foils
- Wires
- Pipes & Tubes
- Powders
- Others
By Production Process
- Primary Production
- Mining
- Smelting
- Refining
- Secondary Production
- Collection
- Sorting
- Recycling
- Remelting
By End-Use Industry
- Construction
- Infrastructure
- Residential
- Commercial
- Automotive & Transportation
- Passenger Vehicles
- Commercial Vehicles
- Rail
- Shipbuilding
- Electrical & Electronics
- Power Transmission
- Consumer Electronics
- Semiconductor Equipment
- Industrial Machinery
- Aerospace & Defense
- Packaging
- Energy
- Renewable Energy
- Conventional Power
- Consumer Goods
- Others
By Distribution Channel
- Direct Sales
- Metal Service Centers
- Distributors & Traders
- Online Industrial Procurement
By Regions
- North America
- U.S.
- Canada
- Europe
- Germany
- UK
- France
- Italy
- Spain
- Sweden
- Denmark
- Norway
- Asia Pacific
- China
- Japan
- India
- South Korea
- Thailand
- Latin America
- Brazil
- Mexico
- Argentina
- Middle East & Africa
- South Africa
- UAE
- Saudi Arabia
- Kuwait
FAQ's




Select User License to Buy
Figures (6)










 sales@towardschemandmaterials.com
 Download Sample
 Schedule a Meeting