
Coated Steel Market Size, Competitive Landscape Analysis Report 2035
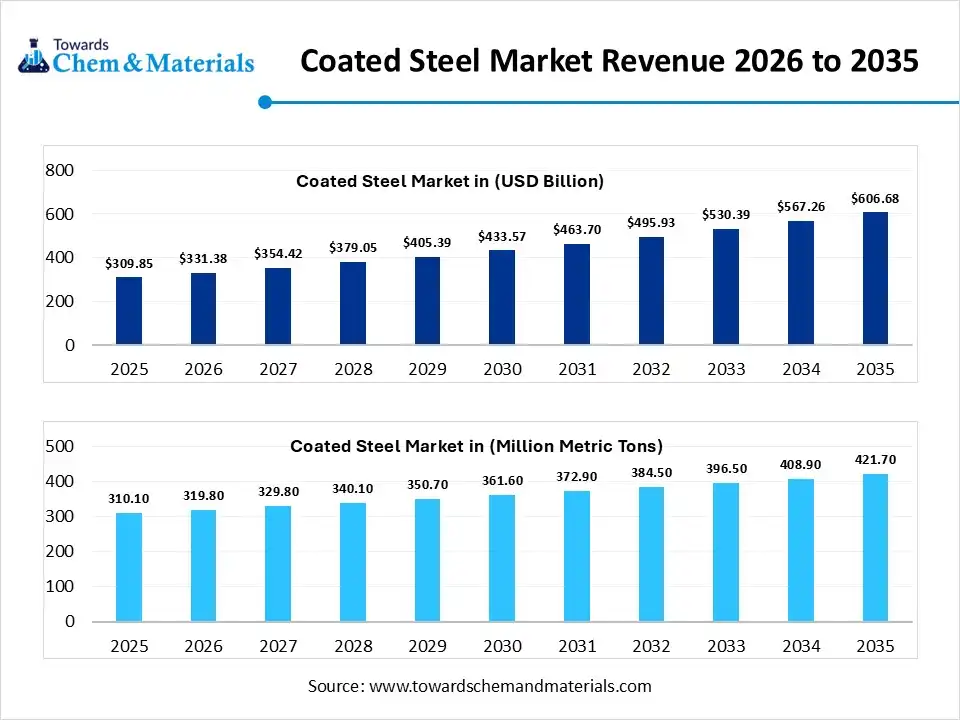
The global coated steel market size was estimated at USD 309.85 billion in 2025 and is expected to increase from USD 331.38 billion in 2026 to USD 606.68 billion by 2035, growing at a CAGR of 6.95% from 2026 to 2035. In terms of volume, the market is projected to grow from 310.1 million metric tons in 2025 to 421.7 million metric tons by 2035. growing at a CAGR of 3.12% from 2026 to 2035. Asia Pacific dominated the coated steel market with the largest volume share of 61.50% in 2025.The expanding EV sector and the high investment in construction drive the market growth.
Market Highlights
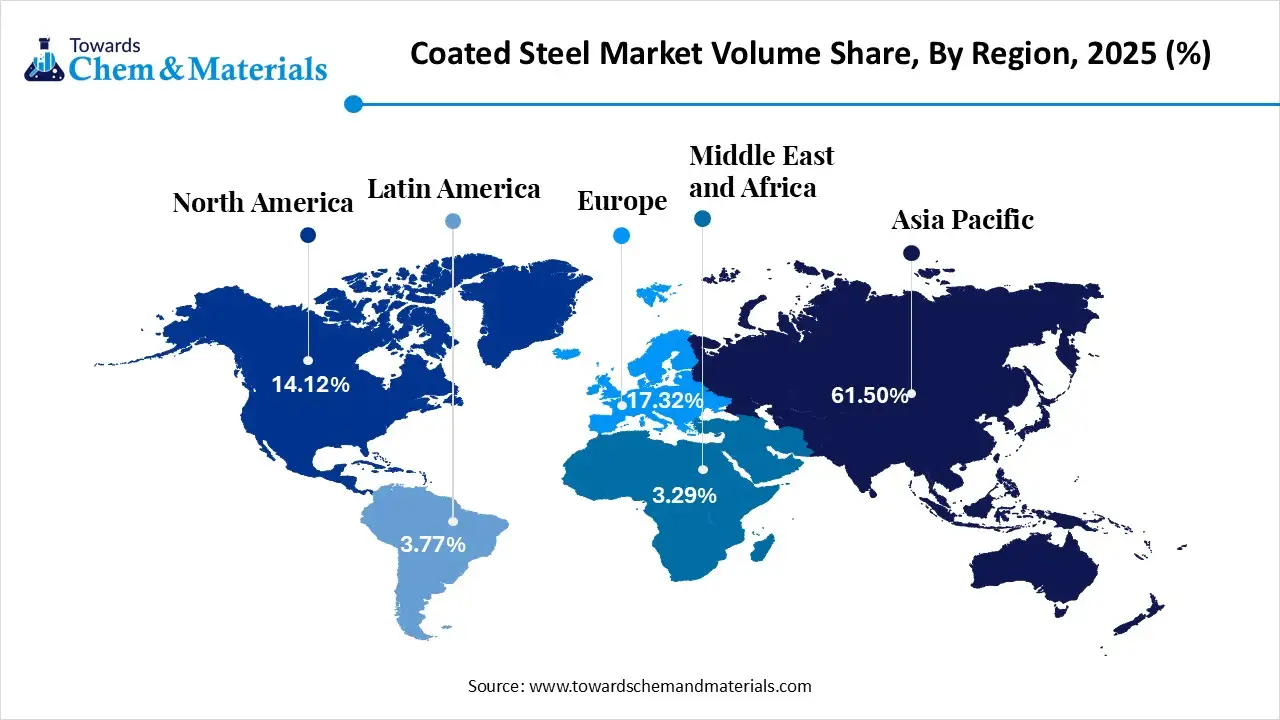
- The Asia Pacific dominated the global coated steel market with the largest volume share of 61.50% in 2025.
- The coated steel market in North America is expected to grow at a substantial CAGR of 4.74% from 2026 to 2035.
- The Europe coated steel market segment accounted for the major volume share of 17.32% in 2025.
- By coating type, the metallic coated segment dominated the market and accounted for the largest volume share of 63.80% in 2025.
- By coating type, the organic/color coatings segment is expected to grow at the fastest CAGR of 4.27% from 2026 to 2035 in terms of volume.
- By resin type, the polyester segment led the market with the largest revenue volume share of 48.00% in 2025.
- By application area, the roofing & cladding segment dominated the market and accounted for the largest volume share of 42.00% in 2025.
- By end-use sector, the building & construction segment led the market with the largest revenue volume share of 50.00% in 2025.
What is Coated Steel?
Coated steel is a steel sheet with an additional protective layer to enhance appearance and prevent rust of the material. They offer benefits like design flexibility, improved formability, corrosion resistance, low maintenance, energy efficiency, weather resistance, and durability. Coated steel is widely used in applications like car bodies, HVAC ductwork, roofing, industrial pipelines, fencing, and furniture.
The coated steel market growth is driven by the growing affordable housing construction, increased automotive manufacturing, the expansion of appliances, emphasis on green buildings, increasing use of tinplate sheets, huge production of electronics, and the development of pre-engineered buildings.
Coated Steel Market Trends:
- Electronic Appliances Expansion:- The increasing use of modern home appliances and the focus on extending the lifespan of appliances increase demand for coated steel, like color-coated steel coils and others. The coated steel is widely used in the components of appliances.
- Smart City Development:- The ongoing mission of smart cities across various countries and the growing development of smart utilities increase demand for coated steel to enhance energy efficiency.
- Demand for Eco-Friendly Coatings:- The increased consumer awareness about the negative impact of carbon footprints and the governments focus on net-zero targets increases demand for eco-friendly coated steel like GreenCoat and others.
- Attention to Aesthetic Presentation:- The increasing priority for aesthetically pleasing design and the consumers strong focus on customization increases demand for coated steel to enhance the aesthetic appeal of various products.
Report Scope
| Report Attribute | Details |
| Market Size and Volume in 2026 | USD 331.38 Billion / 319.8 Million Metric Tons |
| Revenue Forecast in 2035 | USD 606.68 Billion / 421.7 Million Metric Tons |
| Growth Rate | CAGR 6.95% |
| Forecast Period | 2026 - 2035 |
| Base Year | 2025 |
| Units Considered | Value (Billion / Million), Volume (Million Metric Tons) |
| Dominant Region | Asia Pacific |
| Segment Covered | By Coating Type, By Resin Type, By Application Area, By End-Use Sector, By Region |
| Key companies profiled | ArcelorMittal S.A, China Baowu Steel Group, Nippon Steel Corporation, POSCO Holdings, Tata Steel Limited, JSW Steel, Nucor Corporation, United States Steel Corporation, Thyssenkrupp Steel Europe, Ansteel Group, Voestalpine AG, SSAB AB |
Key Technological Shifts in the Coated Steel Market:
The coated steel market is undergoing key technological shifts driven by the demand for high performance, durability, and sustainability. The diverse technological innovations, like nanotechnology, precision techniques, digital twins, and smart coatings, enhance longevity and extend resistance. The major shift is that the integration of AI increases sustainability and optimizes the production process.
AI optimizes various production parameters and offers consistent application of coatings. AI easily detects unevenness and enables immediate adjustments of parameters. AI schedules proactive maintenance and speeds up the inspection process. AI easily tests diverse coating combinations and optimizes the use of materials. AI lowers potential hazards in the workplace and streamlines the operations of logistics. Companies like Nippon Steel, POSCO, and Tata Steel use AI to enhance productivity.
Trade Analysis of Coated Steel Market: Import & Export Statistics
- China exported $837M of zinc coated steel wire in 2024.
- China imported $7.15M of zinc coated steel wire in 2024.
- Vietnam exported $445M of aluminum zinc-coated steel sheets in 2023.
- Brazil imported $538M of aluminum zinc-coated steel sheets in 2023.
- India exported 85,941 shipments of coated steel.
- China exported 39,741 shipments of zinc coated steel.
- India exported 74,938 shipments of alloy coated steel.
Coated Steel Market Value Chain Analysis
- Feedstock procurement: The stage focuses on sourcing feedstocks like base steel and coating materials, including coal, scrap metal, zinc, tin, iron ore, limestone, aluminum, paints, chromium, polymers, and alloying elements.
- Key Players:- Nippon Steel Corporation, POSCO, China Baowu Steel Group, Nucor Corporation, ArcelorMittal, JFE Steel Corporation
- Chemical Synthesis and Processing: The chemical synthesis requires chemical methods like CSD, surface spontaneous polymerization, CVD, and wet chemical synthesis. The chemical processing includes techniques like phosphating, acid washing, post-coating heat treatment, and hot-dip coating for the production of coated steel.
- Key Players:- Akzo Nobel N.V., Axalta Coating Systems, Jotun, PPG Industries, BASF
- Quality Testing and Certifications: The stage focuses on testing attributes like coating thickness, flexibility, elongation, hardness, blistering, strength, chemical composition, gloss levels, and durability. The certifications, like ISO 9001, BIS, UL Solutions, and PCI, are required for coated steel.
- Key Players:- Bureau Veritas, Intertek, SGS, TUV NORD Group, LRQA
Overview: How Coated Steel is Used Across Industries
| Industry | Coated Steel Used | Application | Benefits |
| Automotive |
|
|
|
| Energy |
|
|
|
| Electronic Appliances |
|
|
|
| Construction |
|
|
|
Segmental Insights
Coating Type Insights
Why the Metallic Coated Segment Dominates the Coated Steel Market?
The metallic coated segment dominated the coated steel market in 2025 with a 63.80% share. The increased production of vehicle bodies and the increasing need for appliance casing increase demand for metallic coated steel. The cost-effectiveness and excellent corrosion resistance of metallic coated steel help market expansion. The growing development of new buildings and the popularity of hot-dip galvanizing drive the overall market growth.
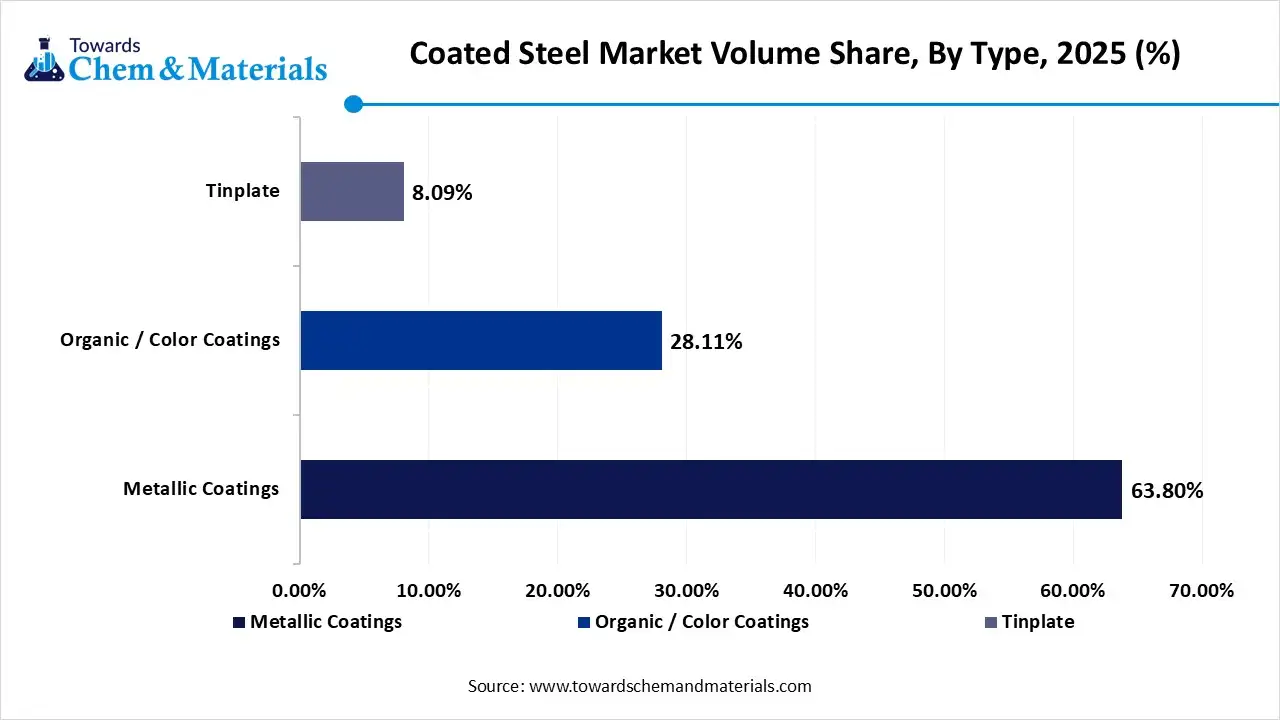
The organic or color coatings segment is the fastest-growing in the market during the forecast period. The increased manufacturing of wind turbines and the growing use of stylish vehicle components require color coatings. The heavy utilization of electronic appliances and the rapid growth in industrial activities require organic or color coatings. The eco-friendliness, customization availability, and superior durability of organic or color coatings support the overall market growth.
Coated Steel Market Volume and Share, By Type, 2025-2035
| By Type | Market Volume Share (%), 2025 | Market Volume (Million Metric Tons)2025 | Market Volume (Million Metric Tons)2035 | CAGR(%) 2026-2035 | Market Volume Share (%), 2035 |
| Metallic Coatings | 63.80% | 197.9 | 261.9 | 3.16% | 62.11% |
| Organic / Color Coatings | 28.11% | 87.2 | 127.0 | 4.27% | 30.12% |
| Tinplate | 8.09% | 25.1 | 32.8 | 3.01% | 7.77% |
Resin Type Insights
How did the Polyester Segment hold the Largest Share in the Coated Steel Market?
The polyester segment held the largest revenue share of 48% in the market in 2025. The growing demand for consumer goods and the focus on enhancing the aesthetic appeal of buildings increase demand for polyester. The increasing use of roofing sheets and the rise in residential construction require polyester. The excellent weather resistance, cost-efficiency, and good formability of polyester drive the overall market growth.
The polyvinylidene fluoride (PVDF) segment is experiencing the fastest growth in the market during the forecast period. The strong focus on sustainable building development and the focus on retaining original gloss require PVDF. The growing development of high-end architecture requires PVDF. The long-term durability, exceptional corrosion resistance, longevity, and low maintenance of PVDF support the overall market growth.
Application Area Insights
Why is the Roofing & Cladding Segment Dominating the Coated Steel Market?
The roofing & cladding segment dominated the coated steel market in 2025 with a 42% share. Increasing urbanization and demand for affordable housing require cladding and roofing. The rise in development of airports and expansion of commercial complexes increases demand for roofing & cladding. The global expansion of construction activities drives the overall market growth.
The solar mounting systems segment is the fastest-growing in the market during the forecast period. The transition towards clean energy and the heavy government investment in renewable energy create a higher demand for solar mounting systems. The strong presence of ground-mounted solar farms and the increasing production of heavy solar panels require coated steel. The growing installations of solar energy worldwide support the overall market growth.
End-Use Sector Insights
Which End-Use Sector held the Largest Share in the Coated Steel Market?
The building & construction segment held the largest revenue share of 50% in the market in 2025. The growing urbanization and the development of industrial buildings increase demand for coated steel. The increasing constructions of roads and the focus on sustainable construction practices requires coated steel. The growing use of coated steel in construction applications like wall cladding, ceilings, roofing, and structural components drives the overall market growth.
The automotive segment is experiencing the fastest growth in the market during the forecast period. The focus on enhancing the fuel economy of the vehicle and lowering maintenance activities increases demand for coated steel. The robust production of EVs and the production of longer-lasting cars require coated steel. The global rise in the manufacturing of vehicles and the focus on enhancing the aesthetics of automobiles require coated steel, supporting the overall market growth.
Regional Insights
The Asia Pacific coated steel market size was valued at USD 190.56 billion in 2025 and is expected to be worth around USD 373.11 billion by 2035, exhibiting at a compound annual growth rate (CAGR) of 6.97% over the forecast period from 2026 to 2035.
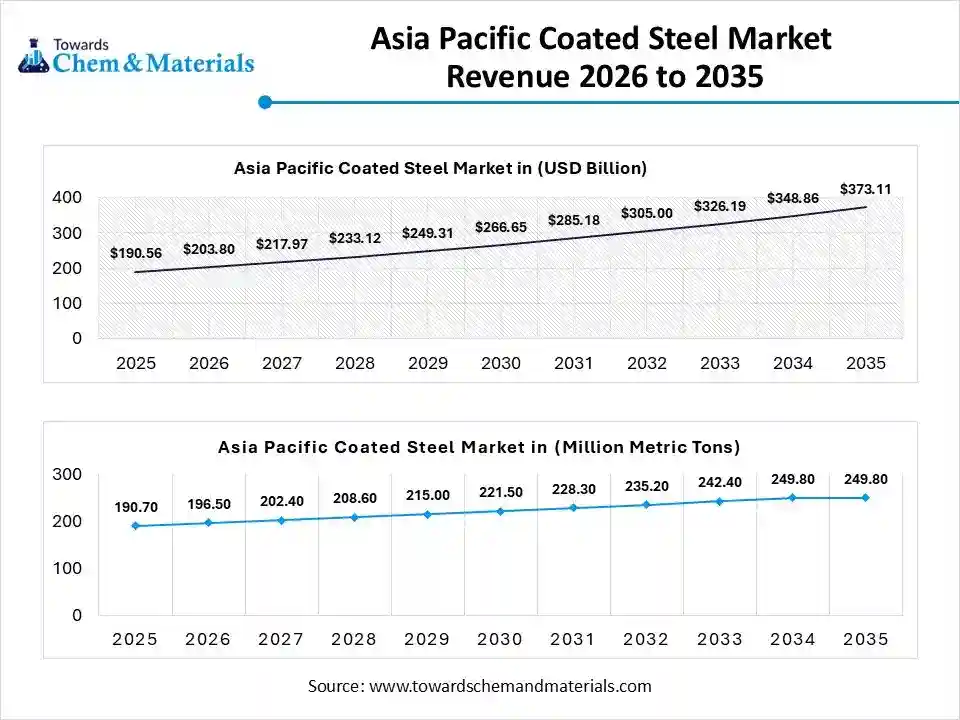
The Asia Pacific coated steel market volume was estimated at 190.7 million metric tons in 2025 and is projected to reach 249.8 million metric tons by 2035, growing at a CAGR of 3.04% from 2026 to 2035. Asia Pacific dominated the market with a 61.50% share in 2025. The heavy investment in the development of infrastructure projects and the increased production of electronic appliances increase demand for coated steel. The strong government support for construction activities and the increased manufacturing of automotive parts require coated steel. The growing expansion of home appliances and the rapid industrialization drive the overall market growth.
Electronics Shield: Japan’s Growth in Coated Steel
Japan is rapidly growing in the market due to the increasing use of advanced electronics. The increasing use of electric vehicles and the growing urban redevelopment increase demand for coated steel. The growth in modernizing infrastructure and the supportive government policies for renewable energy create a higher demand for coated steel. The strong presence of smart factories supports the overall market growth.
North America Coated Steel Market Trends
The North America coated steel market volume was estimated at 43.8 million metric tons in 2025 and is anticipated to reach 66.5 million metric tons by 2035, growing at a CAGR of 4.74% from 2026 to 2035. North America is experiencing the fastest growth in the market during the forecast period. The booming commercial construction activities and the increased production of lighter vehicle parts require coated steel. The increased spending on infrastructure projects and growth in the development of residential projects require coated steel. The presence of large warehouses and the focus on energy-efficient buildings increase demand for coated steel, supporting the overall market growth.
Coated Steel Market Volume and Share, By Region, 2025-2035
| By Region | Market Volume Share (%), 2025 | Market Volume (Million Metric Tons)2025 | Market Volume (Million Metric Tons)2035 | CAGR(%) 2026-2035 | Market Volume Share (%), 2035 |
| North America | 14.12% | 43.8 | 66.5 | 4.74% | 15.76% |
| Europe | 17.32% | 53.7 | 76.3 | 3.98% | 18.10% |
| Asia Pacific | 61.50% | 190.7 | 249.8 | 3.04% | 59.23% |
| Latin America | 3.77% | 11.7 | 16.2 | 3.71% | 3.85% |
| Middle East & Africa | 3.29% | 10.2 | 12.9 | 2.64% | 3.06% |
Strength Redefined: The Expanding Edge of Coated Steel in the U.S.
The United States is a major contributor to the market. The increasing investment in residential projects and the rapid growth in the manufacturing of automobiles require coated steel. The strong focus on modernizing bridges and the increasing consumer need for household appliances require coated steel. The shift towards the development of energy-efficient buildings and the expansion of solar energy increases demand for coated steel, supporting the overall market growth.
Europe Coated Steel Market Trends
The Europe coatedsteel market volume was estimated at 53.7 million metric tons in 2025 and is anticipated to reach 76.3 million metric tons by 2035, growing at a CAGR of 3.98% from 2026 to 2035. The Europe coated steel market segment accounted for the major volume share of 17.32% in 2025. Europe is growing at a notable rate in the market due to the increasing investment in smart cities and the higher demand for lightweight vehicle materials increase the demand for coated steel. The increased production of electronic products and the heavy investment in commercial buildings require coated steel. The focus on using energy-efficient coatings and ongoing advancements in coating technology drives the overall market growth.
Steel Transformation: Power of Coated Steel in the United Kingdom
The United Kingdom is growing substantially in the market. The strong presence of government pipelines and the development of green energy projects require coated steel. The expanding base of renewable energy and the increasing use of high-strength materials in the automotive industry require coated steel. The increased utilization of eco-friendly coatings supports the overall market growth.
South America Coated Steel Market Trends
The South America coated steel market volume was estimated at 11.7 million metric tons in 2025 and is anticipated to reach 16.2 million metric tons by 2035, growing at a CAGR of 3.71% from 2026 to 2035. South America is growing significantly in the market. The growing expansion of vehicle manufacturing and the rapid growth in oil projects increase demand for coated steel. The booming infrastructure projects and the strong focus on sustainable transport increase demand for coated steel. The presence of key players like ArcelorMittal and Gerdau supports the overall market growth.
Building Strength: Coated Steel Growth Momentum in Brazil
Brazil is growing substantially in the market. The rapid growth in electronic appliances and the increasing investment in sanitation infrastructure require coated steel. The growing development of housing projects and heavy investment in railway infrastructure increases demand for coated steel. The rapid expansion of mining and the governments backing for infrastructure modernization require coated steel, supporting the overall market growth.
Middle East & Africa Coated Steel Market Trends
The Middle East & Africa coated steel market volume was estimated at 10.2 million metric tons in 2025 and is anticipated to reach 12.9 million metric tons by 2035, growing at a CAGR of 2.64% from 2026 to 2035. The Middle East & Africa are growing in the market. The strong government investment in infrastructure development and booming wind energy requires coated steel. The well-established oil & gas industry and the expanding production of vehicles require coated steel. The increasing spending on transportation infrastructure and the heavy investment in commercial zones require coated steel, driving the overall market growth.
Rise of Coated Steel in Qatar
Qatar is growing significantly in the market. The increasing investment in hospitality projects and the strong focus on green building standards increase demand for coated steel. The expansion of industrial buildings and the increasing spending on renewable energy increase demand for coated steel. The high spending on aesthetically pleasing architectures supports the overall market growth.
Recent Developments
- In June 2025, ArcelorMittal Nippon Steel India (AM/NS India) launched high-performance color-coated products Optigal® Prime and Optigal® Pinnacle, for construction projects. The Optigal Prime product is available in finishes like PVDF, SMP, & SDP and used across moderately corrosive environments. The Optigal Pinnacle consists of 25 years of warranty and is suitable for harsh industrial conditions. (Source: www.businesswireindia.com )
- In April 2025, Jindal Ltd launched AI-Zn-coated steel coils for solar module mounting structures. The coated steel coil is suitable across harsh outdoor environments and offers excellent durability. The coil possesses superior corrosion resistance and exceptional reliability.(Source: www.pv-magazine-india.com )
- In June 2024, JSW Steel launched Indigenous Zinc-Magnesium-Aluminum alloy coated steel JSW Magsure. The coated steel is widely used in applications like silos, AC parts, solar installations, and guard rails. It is suitable for highly corrosive environments and offers high corrosion resistance. (Source:www.rprealtyplus.com )
Market Top Companies
- ArcelorMittal S.A.:- The leading steel company manufactures organic coatings and metallic coatings to support industries like construction, packaging, automotive, energy, and appliances.
- China Baowu Steel Group:- The major steel-producing company manufactures self-adhesive, hot-dip galvanizing, and electro-galvanizing coatings to serve a diverse industrial base.
- Nippon Steel Corporation:- The Japan-based steel-making company produces coated steel to support applications like decorative home appliances, lightweight cars, and durable building materials.
- POSCO Holdings:- The South Korea-based company manufactures products like aluminum-plated sheets, high-resistance alloy coated steel, galvanized steel, color-coated sheets, and galvannealed steel to manufacture various components across diverse sectors.
- Tata Steel Limited:- The company produces coated steel products like COLORBOND, Colornova, ZINCALUME, and GalvaRoS to serve applications like roofing, silos, pipes, automotive parts, appliances, and others.
- JSW Steel
- Nucor Corporation
- United States Steel Corporation
- Thyssenkrupp Steel Europe
- Ansteel Group
- Voestalpine AG
- SSAB AB
Segments Covered
By Coating Type
- Metallic Coatings
- Hot-Dip Galvanized (HDG)
- Electro-Galvanized (EG)
- Galvalume / Aluzinc
- Zn-Al-Mg (Zinc-Aluminium-Magnesium)
- Organic / Color Coatings
- Pre-Painted Galvanized Iron (PPGI)
- Pre-Painted Galvalume (PPGL)
- Tinplate
By Resin Type
- Polyester (PE)
- Siliconized Modified Polyester (SMP)
- Polyvinylidene Fluoride (PVDF)
- Plastisols & Epoxies
By Application Area
- Roofing & Cladding
- Automotive Panels
- Home Appliances
- HVAC & Ducting
- Solar Infrastructure
By End-Use Sector
- Building & Construction
- Automotive & Transportation
- Consumer Electronics & Appliances
- Packaging
By Region
- North America
- U.S.
- Canada
- Mexico
- Europe
- Germany
- UK
- France
- Italy
- Spain
- Asia Pacific
- China
- India
- Japan
- South Korea
- Latin America
- Brazil
- Argentina
- Middle East & Africa
- Saudi Arabia
- South Africa
A Seven-Phase Framework
Our methodology is designed to be universally applicable across commodity chemicals, specialty chemicals, petrochemicals, construction chemicals, coatings, electronic chemicals, industrial gases, agrochemicals, water treatment chemicals, and performance materials. Each phase builds upon the last, creating a layered validation structure that minimizes estimation error and maximizes analytical confidence.
The framework ensures comprehensive market coverage, robust cross-validation, and reliable long-term forecasting — producing market estimates that withstand scrutiny from investors, regulators, and corporate strategy teams.

Seven-Phase Framework — Analytical Effort Distribution
Relative analytical effort allocated across each phase of the Chemicals & Materials research framework

Phase 1 - Secondary Research: Establishing the Foundation
Secondary research collects and evaluates publicly available information from authoritative sources, establishing the foundational understanding of market structure, value chain dynamics, competitive landscape, and end-use demand patterns. Every source is evaluated for credibility, recency, geographic relevance, and methodological soundness before inclusion.
Industry Associations
Sources include ACC, CEFIC, ICCA, JCIA, CPCIF, and SOCMA providing production volumes, consumption trends, capacity developments, and sustainability initiatives.
Company Disclosures
Annual reports, investor presentations, earnings transcripts, and regulatory filings reveal product portfolios, manufacturing footprints, capacity expansions, and revenue segmentation.
Government Databases
National statistical offices, customs authorities, environmental agencies, and industrial production databases provide verified statistics on output, trade flows, and regulatory compliance.
Trade Databases
UN Comtrade, ITC, Eurostat, and national customs authorities enable assessment of global product movement, import dependency, and export competitiveness across regions.
Our Secondary Research Sources
- Ministry of Chemicals and Fertilizers
- European Chemicals Agency
- United States Department of Energy
- Ministry of Industry and Information Technology
- Ministry of Economy Trade and Industry
- Ministry of Trade Industry and Energy
- National Institute of Standards and Technology
- Council of Scientific and Industrial Research
- Fraunhofer Society
- National Institute for Materials Science
Phase 2 — Supply-Side Assessment: Mapping Production Capabilities
Production Capacity Analysis
All major manufacturers are assessed for existing installed capacity, planned additions, expansions, new plant announcements, and technology adoption — mapped at global, regional, and country levels.
Capacity Utilization Adjustment
Installed capacity is adjusted using utilization rates based on demand conditions, feedstock availability, plant operating rates, maintenance schedules, and regulatory restrictions.
Manufacturer Revenue Analysis
Product-specific revenues, segment-level performance, regional distribution, average selling prices, and margin trends are evaluated to establish market value estimates.
Supply-Side Assessment — Capacity vs. Effective Production by Region
Illustrative comparison of installed capacity vs. effective production volume (after utilization rate adjustment) across major regions

Phase 3 — Demand-Side Assessment: Quantifying Chemical Consumption
Demand-side analysis quantifies chemical consumption across industries, applications, and geographies — identifying where and how chemicals are consumed throughout the value chain with precision.
End-Use Industry Analysis
Chemical demand is evaluated across automotive, construction, packaging, electronics, agriculture, healthcare, consumer goods, industrial manufacturing, energy and utilities, and water treatment. Industry output, production trends, and consumption intensity are analyzed to determine demand patterns.
Consumption Modeling
Demand is estimated using measurable indicators: kilograms per vehicle, kilograms per square meter of construction, dosage per cubic meter of water treated, kilograms per hectare of agricultural land, and kilograms per ton of manufactured products. Consumption factors are validated through industry publications and primary interviews.
Application Analysis
The market is segmented by application area to understand product performance requirements, formulation trends, technology adoption, customer preferences, and regulatory requirements improving demand accuracy and segmentation granularity.
Demand-Side Assessment — End-Use Industry Demand Distribution
Illustrative distribution of chemical & materials demand across key end-use industries

Phase 4 - Trade Flow Analysis: Balancing Regional Supply and Demand
Trade flow analysis reconciles regional supply and demand estimates through import and export data, identifying net supply positions, regional dependencies, and market imbalances. It serves as an independent validation layer that tests the consistency of supply-side and demand-side estimates.
Import Analysis
Import data is evaluated to determine volumes, source countries, product dependency, regional supply gaps, and pricing trends — identifying markets that rely heavily on external supply and where domestic production is insufficient to meet demand.
Export Analysis
Export assessments reveal production surplus, export competitiveness, regional manufacturing strength, and global market participation. Export patterns also help validate domestic production estimates and identify net exporting regions.
Apparent Consumption Model
Regional consumption is assessed using the standard apparent consumption formula:
Results identify net importing regions, net exporting regions, regional deficits, and surpluses — serving as an independent validation of supply and demand estimates.
Trade Flow Analysis — Net Supply Position by Region
Illustrative apparent consumption vs. domestic production across major regions — positive gap indicates net import dependency

Phase 5 — Primary Research: The Critical Validation Layer
Primary research tests and refines findings from secondary research through direct engagement with industry participants across the supply chain, demand side, and expert community. It captures intelligence that no database or published report can provide — the real-world experience of manufacturers, buyers, and specialists operating in the market.

Supply-Side Interviews
Conversations with chemical manufacturers, raw material suppliers, contract manufacturers, technology providers, and plant operators cover production trends, capacity utilization, pricing developments, technology shifts, and competitive dynamics.

Demand-Side Interviews
Engagement with OEMs, industrial consumers, procurement managers, distributors, formulators, and end-use manufacturers focuses on consumption trends, purchasing behavior, product substitution, demand outlook, and emerging applications.

Industry Expert Consultations
Additional interviews with industry consultants, independent experts, regulatory specialists, technical professionals, and research institutions provide deeper market context and validate key analytical assumptions.
Focus Areas of Primary Research:
Market Size & Forecast Validation
Revenue estimates, volume consumption, growth rates, forecast assumptions, regional demand.Supply Chain & Value Chain Assessment
Raw material sourcing, supply chain challenges, distribution networks, procurement practices.Production & Capacity Analysis
Manufacturing capacity, utilization rates, expansion projects, plant investments.Pricing & Cost Structure Analysis
Product pricing trends, feedstock costs, energy costs, margin pressures, pricing outlook.Competitive Landscape Assessment
Volume and value estimates confirmed to be fully consistent with one another before publicationInterview Volume by Market Scope
| Study Scope | Number of Interviews |
|---|---|
| Niche Market | 20 – 30 |
| Mid-Sized Market | 30 – 50 |
| Global Market | 50 – 80 |
| Highly Fragmented Market | 80 – 120 |
Interview Details:
Category : Manufacturers, Suppliers, Distributors, End Users, Experts/Associations
Average Duration : 30–60 Minutes
Interview Mode : Video calls, telephonic interviews, expert consultations
Interview Format : Structured / Semi-Structured questionnaire
Focus Areas of Primary Research:
Market Size & Forecast Validation :
Revenue estimates, volume consumption, growth rates, forecast assumptions, regional demand.
Supply Chain & Value Chain Assessment :
Raw material sourcing, supply chain challenges, distribution networks, procurement practices.
Production & Capacity Analysis :
Manufacturing capacity, utilization rates, expansion projects, plant investments.
Pricing & Cost Structure Analysis :
Product pricing trends, feedstock costs, energy costs, margin pressures, pricing outlook.
Competitive Landscape Assessment :
Market share, competitor positioning, strategic initiatives, partnerships, acquisitions.
Primary Research — Stakeholder Coverage by Category
Distribution of interview respondents across stakeholder categories (% share from PPT data)

Primary Research — Respondent Designation Profile
Seniority breakdown of interview respondents (% share from PPT data)

Primary Research — Geographic Coverage of Interviews
Regional distribution of primary research engagement (% share from PPT data)

Phase 6 — Data Triangulation and Market Validation
No single methodology is relied upon in isolation. Multiple independent estimation approaches are combined and reconciled to ensure consistency, accuracy, and analytical defensibility. Any material deviations between approaches are investigated and adjusted through additional validation cycles.
The final market size is derived through weighted triangulation of all validated methodologies. Any material deviations between approaches are investigated and adjusted through additional validation cycles. The outcome represents the most realistic assessment of the market based on available evidence and expert confirmation ensuring that volume and value estimates are fully consistent with one another.
Triangulation Framework — Input Contribution Weight
Relative weight each sizing input contributes to the final reconciled market estimate

Phase 7 — Forecast Modeling: Projecting Future Market Evolution
Forecasting evaluates the future trajectory of the market using a combination of quantitative indicators and qualitative assessments across economic, industry, and regulatory dimensions. Rather than simple extrapolation, each driver is independently modeled and integrated into a composite forecast.
Macroeconomic Indicators
GDP growth, industrial production, manufacturing output, construction activity, consumer spending, and capital investment form the quantitative foundation of long-term demand projections. These are applied at country, regional, and global levels.
Industry Growth Drivers
Urbanization, infrastructure development, industrialization, technological innovation, sustainability initiatives, and evolving product performance requirements are assessed at regional and industry levels — capturing both structural and cyclical demand drivers.
Capacity Expansion Analysis
Announced plant expansions, new manufacturing facilities, technology upgrades, and strategic investments are evaluated to determine future supply-demand dynamics and potential market tightness or oversupply situations.
Regulatory & Sustainability
Environmental regulations, chemical safety standards, emission reduction targets, circular economy initiatives, and sustainability requirements are incorporated as they often influence product adoption rates and market growth trajectories.
Scenario Forecast Range — Indexed Market Growth (Year 1–10)
Illustrative indexed growth trajectories across Base, Optimistic, and Pessimistic scenarios over a 10-year forecast horizon

Forecast Drivers — Relative Impact Score by Category
Impact score (0–100) of each driver type on chemicals & materials market forecast




Comments
Share your thoughts, ask a question, or provide feedback about this report.