
Chemical Informatics Market Size Analysis Report 2035
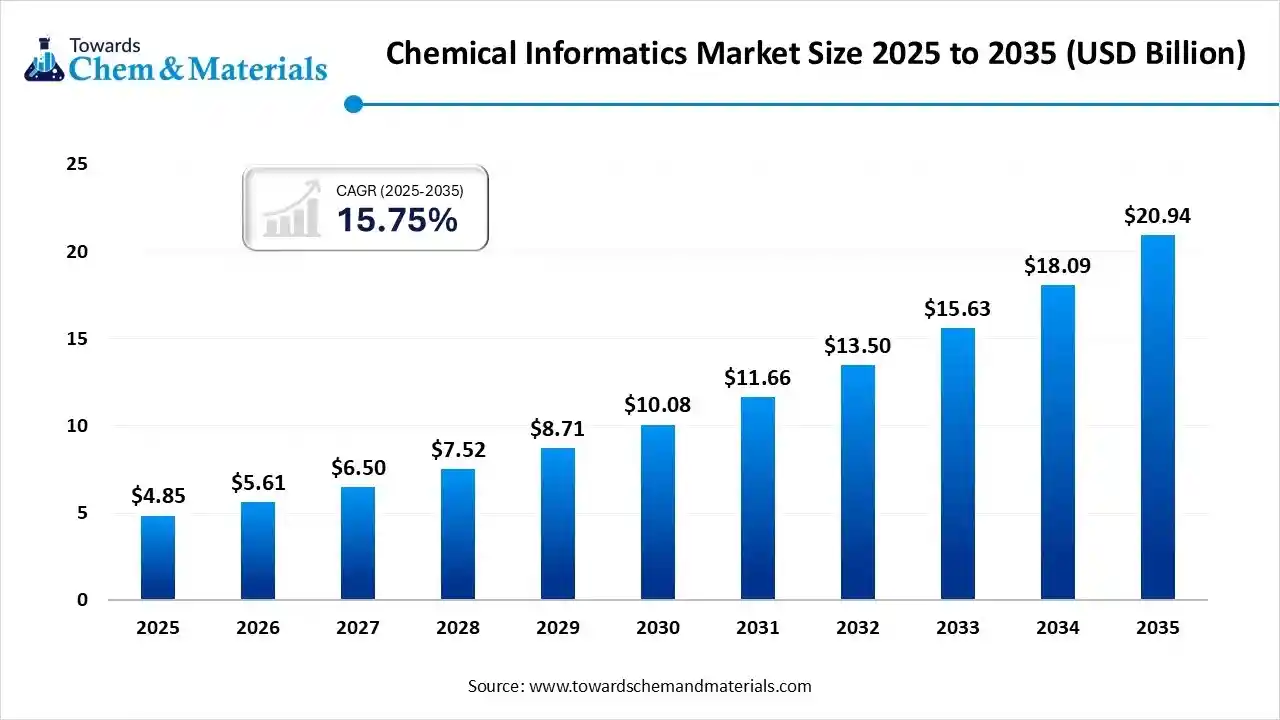
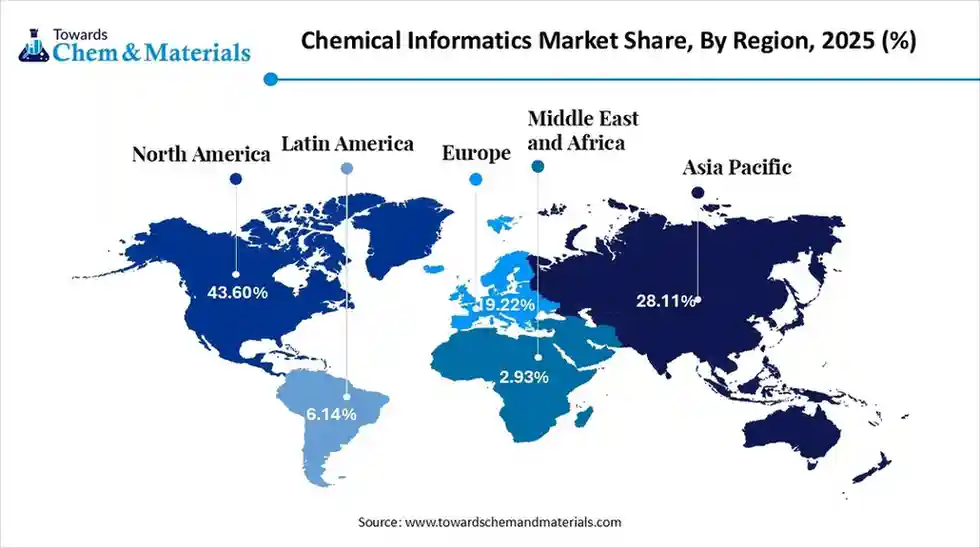
The global chemical informatics market size is calculated at USD 4.85 billion in 2025 and is predicted to increase from USD 5.61 billion in 2026 and is projected to reach around USD 20.94 billion by 2035, The market is expanding at a CAGR of 15.75% between 2026 and 2035. Asia Pacific dominated the chemical informatics market with a market share of 43.60% the global market in 2025. The growth of the market is driven by expanding pharmaceutical and biotechnology industries, increasing R&D investments, and the growing demand for efficient drug discovery processes.
Key Takeaway
- By region, North America dominated the market with 43.60% share in 2025.
- By region, the Asia Pacific is expected to have significant growth in the market in the forecast period.
- By product/offering, the software (desktop & enterprise) segment dominated the market with 41% of market share in 2025.
- By product/offering, the cloud/saas platforms segment is expected to grow significantly in the market during the forecast period.
- By function/solution, the molecular modelling & simulation segment dominated the market in 2025.
- By function/solution, the reaction informatics & synthesis planning segment is expected to grow in the forecast period.
- By application/end use, the pharmaceutical and biotech segment dominated the market in 2025.
- By application/end use, the material science and speciality chemicals segment is expected to grow in the forecast period.
- By deployment/delivery mode, the on-premises enterprise installations segment dominated the market in 2025.
- By deployment/delivery mode, the cloud/SaaS segment is expected to grow in the forecast period.
- By component revenue type, the license/ subscription fees segment dominated the market in 2025.
- By component revenue type, the professional services & managed projects segment is expected to grow in the forecast period.
Market Overview
What Is The Significance Of The Chemical Informatics Market?
The significance of the Chemical Informatics Market lies in its role as a critical driver for innovation in drug discovery, personalised medicine, and materials science through computational analysis of chemical data. By using computational tools, this market accelerates the identification of potential drug candidates, improves the efficiency of preclinical research, enables the design of targeted therapies, and aids in the development of new materials with predictable properties.
Chemical Informatics Market Trends:
- AI and machine learning integration: This trend dominates the industry, with AI/ML models employed for virtual screening, molecular design, and predicting molecular properties. AI also plays a key role in automating the generation of chemical data and tackling issues related to large, incomplete datasets.
- Increased demand in drug discovery: The rising need for new medications, especially for chronic illnesses, is a primary driver. Chemoinformatics helps accelerate the drug discovery process, cut costs, and analyse potential drug candidates more effectively.
- Growth in materials science: The market is expanding into materials science, utilising AI for high-throughput screening, data-driven decisions, and discovering new materials.
- Rise of predictive analytics and virtual screening: Companies are increasingly adopting predictive analytics and virtual screening to enhance R&D efficiency, reducing the time and costs involved in launching new products.
- Focus on software solutions: The software sector generates the most revenue, reflecting a strong market for specialised tools that support chemical analysis and data management.
Report Scope
| Report Attribute | Details |
| Market Size Value in 2026 | USD 5.61 Billion |
| Revenue Forecast in 2035 | USD 20.94 Billion |
| Growth Rate | CAGR 15.75% |
| Forecast Period | 2026 - 2035 |
| Base Year | 2025 |
| Dominant Region | North America |
| Fastest Growing Region | Asia Pacific |
| Segments covered | By Product / Offering, By Application / End-Use, By Deployment / Delivery Mode, By Region |
| Key companies profiled | Dassault Systèmes (BIOVIA) , Schrödinger, Inc. , Certara , ChemAxon , Dotmatics (Nonlinear Dynamics/now Dotmatics) , OpenEye Scientific , BioSolveIT , Cresset / MolSoft , Optibrium (and collaborating partners) , Genedata , KNIME Scilligence, Simulations Plus , Cresset / Molecular Discovery Ltd. , VLife Sciences , InfoChem / Molecular Networks GmbH , Collaborative Drug Discovery (CDD) , Chemical Computing Group (MOE) |
Key Technological Shifts In The Chemical Informatics Market:
The chemical informatics market is experiencing significant technological shifts driven by digital transformation, most notably the integration of artificial intelligence (AI) and machine learning (ML), the widespread adoption of big data analytics and cloud computing, and the rise of connected technologies like the Internet of Things (IoT) and digital twins. These technologies enhance the analysis of large datasets and predict molecular properties, accelerating the discovery of new compounds and materials.
Chemical Informatics Regulatory Landscape: Global Regulations
| Country / Region | Regulatory Body | Key Regulations | Focus Areas | Notable Notes |
| United States | U.S. EPA (Environmental Protection Agency) / OSHA / FDA | - TSCA (Toxic Substances Control Act) - OSHA Hazard Communication Standard (HCS) - FDA 21 CFR Part 11 (for electronic records) |
- Chemical safety data management - Hazard classification & SDS - Digital documentation compliance |
Rising use of AI/QSAR tools for TSCA risk assessments; strong adoption of LIMS/ELN systems due to FDA Part 11 requirements. |
| European Union | ECHA (European Chemicals Agency) | - REACH - CLP (Classification, Labelling, and Packaging Regulation) |
- Hazard assessment & reporting - Data submission & chemical inventory - Substance registration workflows |
REACH requires massive datasets—chemical informatics platforms are increasingly used for toxicity prediction and dossier automation. |
| China | MEE (Ministry of Ecology and Environment) | - MEE Order No. 12 (New Chemical Substance Registration) - GB Standards for chemical labelling |
- New chemical notification - Environmental risk evaluation - Digital compliance reporting |
Enterprises must maintain complete digital chemical databases; foreign suppliers must appoint a Local Agent for compliance. |
| Japan | METI / MHLW / MOE | - CSCL (Chemical Substances Control Law) - PRTR Law |
- Pre-market approval - Chemical risk data reporting - Digital transparency in chemical handling |
Japan requires detailed digital records; QSAR/QSPR modelling is increasingly accepted in risk evaluations. |
| Global | OECD / UN | - GHS (Globally Harmonised System) - OECD QSAR Principles - OECD GLP |
- Hazard classification - Computational toxicity modelling - Laboratory data integrity |
QSAR/QSPR modelling is globally recognised; chemical informatics tools are key for generating standardised digital datasets. |
Segmental Insights
Product / Offering Insights
Which Product/ Offering Segment Dominates The Chemical Informatics Market In 2025?
- The software (desktop and enterprise) segment dominated the chemical informatics market in 2025. Desktop and enterprise software provide advanced computational tools such as QSAR, cheminformatics modelling, ELN/LIMS integration, and visualisation modules. These platforms support high-performance local computing environments for researchers needing tight control, data privacy, and custom workflow integration across laboratories and regulated environments.
- The cloud/SaaS platforms segment expects significant growth in the chemical informatics market during the forecast period. Cloud and SaaS solutions enable scalable, collaborative, and cost-efficient access to cheminformatics tools without heavy IT infrastructure. They support real-time data sharing, multi-site R&D coordination, and faster updates, making them popular among emerging biotech, CROs, and academic research networks.
- The data and databases segment has seen notable growth in the chemical informatics market. This includes curated chemical databases, molecular libraries, reaction repositories, and predictive toxicity datasets. They act as foundational data layers for modelling, screening, regulatory submissions, and AI-driven discovery, helping users accelerate hypothesis generation and improve decision-making accuracy.
Function / Solution Insights
How Did Molecular Modelling And Simulation Segment Dominates The Chemical Informatics Market In 2025?
- The molecular modelling and simulation segment dominated the chemical informatics market in 2025. These solutions provide tools for structure-based drug design, 3D modelling, QSAR, docking, and physicochemical property prediction. They reduce experimental iterations and enable more accurate evaluation of candidate molecules early in the discovery process.
- The reaction informatics and synthesis planning segment expects significant growth in the chemical informatics market during the forecast period. These platforms help researchers predict reaction outcomes, design safe synthetic routes, and optimise yield and process efficiency. They integrate reaction rules, predictive algorithms, and retrosynthesis tools that aid both R&D and large-scale chemical manufacturing.
- The virtual screening and library design segment has seen notable growth in the chemical informatics market. This includes high-throughput virtual screening, library generation, scaffold hopping, and computational filtering of molecular collections. The tools accelerate early drug discovery, enabling teams to assess millions of compounds digitally before experimental testing.
Application / End-Use Insights
Which Application/End Use Segment Dominates The Chemical Informatics Market In 2025?
- The pharmaceutical and biotech segment dominated the chemical informatics market in 2025. Pharma and biotech companies use chemical informatics for target identification, drug design, ADMET prediction, and managing proprietary molecular data. It enhances R&D productivity, reduces costs, and supports regulatory documentation for clinical pipelines.
- The materials science and speciality chemicals segment expects significant growth in the chemical informatics market during the forecast period. In materials R&D, informatics platforms help design polymers, coatings, composites, catalysts, and sustainable chemicals through predictive modelling. They support formulation optimisation and property prediction, reducing experimentation and accelerating product innovation.
- The academia and research institute segment has seen notable growth in the chemical informatics market. Universities and research centres adopt chemical informatics for teaching, computational chemistry research, molecular database management, and collaborative multi-institutional research. Cloud-based tools are especially preferred due to lower cost and accessibility.
Deployment / Delivery Mode Insights
How Did Cloud/Saas Segment Dominates The Chemical Informatics Market In 2025?
- The cloud/ SaaS segment dominated the chemical informatics market in 2025. Cloud deployment offers rapid scalability, low upfront cost, automatic updates, and multi-user collaboration. It is widely adopted by small and mid-sized companies and research networks seeking flexibility and remote accessibility.
- The on-premises enterprise installations segment expects significant growth in the chemical informatics market during the forecast period. Enterprise deployments provide high security, in-house control, and compliance with strict regulatory or corporate IT requirements. Large pharmaceutical companies, chemical manufacturers, and government labs often rely on on-premises systems for sensitive data.
Component / Revenue Type Insights
Which Component/Revenue Type Segment Dominates The Chemical Informatics Market In 2025?
- The license/ subscription fees segment dominated the chemical informatics market in 2025. This revenue stream includes annual or monthly subscriptions, perpetual licenses, seat-based pricing, and enterprise-level software contracts. Cloud-based subscription models are growing rapidly as organisations shift toward OPEX-friendly solutions.
- The professional services and managed projects segment expects significant growth in the chemical informatics market during the forecast period. These services include system integration, data migration, training, custom workflow configuration, and long-term managed informatics projects. Vendors support clients with the implementation, validation, and optimisation of computational tools to fit specific R&D requirements.
Regional Analysis
The North America chemical informatics market size was valued at USD 2.11 billion in 2025 and is expected to reach USD 9.19 billion by 2035, growing at a CAGR of 15.85% from 2026 to 2035. North America dominated the chemical informatics market with 43.6% market share in 2025.
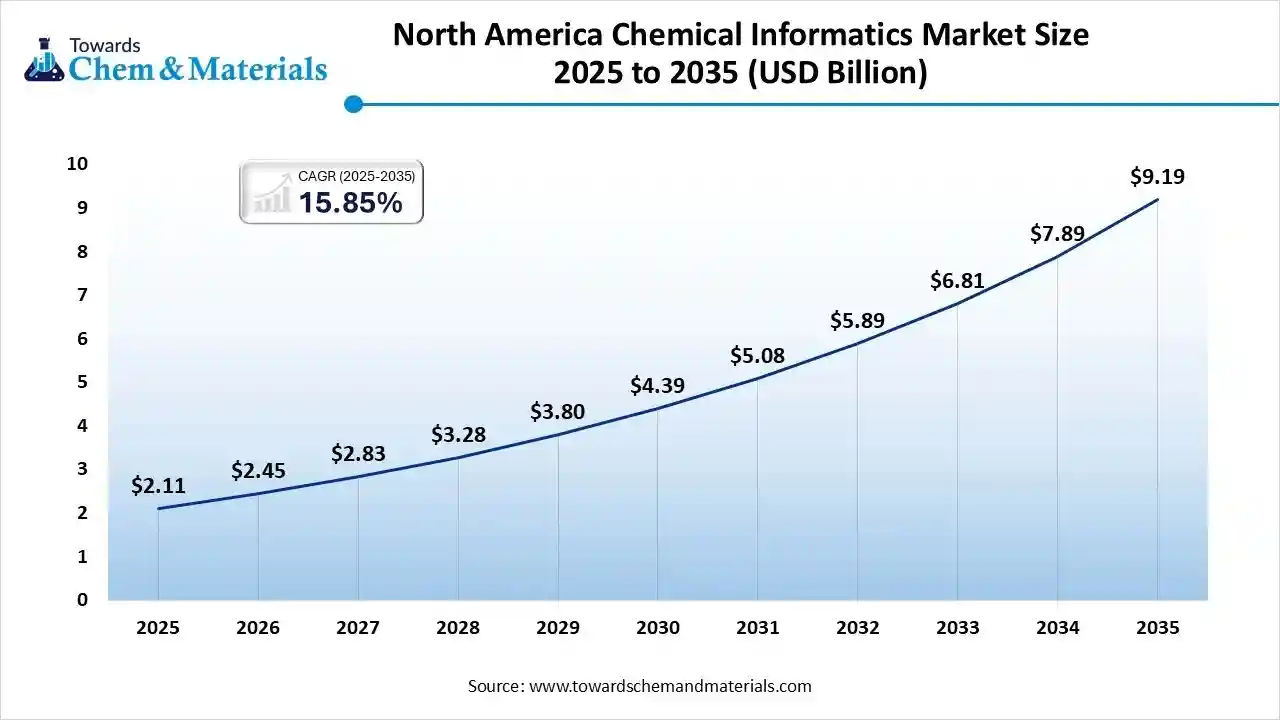
North America leads in chemical informatics adoption thanks to deep R&D investment across pharma, speciality chemicals, and materials science. Firms use cheminformatics for virtual screening, predictive toxicology, and formulation optimisation, integrating AI and cloud platforms to accelerate discovery and reduce lab iterations. Strong vendor ecosystems, active CRO/CDMO partnerships, and regulatory emphasis on data integrity further drive enterprise adoption across research and manufacturing workflows.
The U.S. Has Seen Growth Driven By High Spending In The Country
The U.S. is the primary market driver with major pharma, biotech, and chemical companies headquartered here. High computational chemistry spend, advanced HPC/cloud infrastructure, and widespread use of QSAR, molecular modelling, and ELN/LIMS systems encourage rapid uptake. Venture-backed startups, established software vendors, and academic centres collaborate closely, producing a vibrant ecosystem for chemical informatics tools that support drug discovery, materials innovation, and regulatory compliance.
Asia Pacific Chemical Informatics Market Growth Driven By Growing Adoption
Asia Pacific is expected to experience significant growth in the chemical informatics market in the forecast period. Asia Pacific is the fastest-growing region as pharma manufacturing, materials research, and CRO services scale rapidly. Cheminformatics adoption is driven by cost-effective R&D models, cloud platforms, and local software providers tailoring solutions for regional languages and regulatory landscapes. Investments in AI, computational chemistry, and public research infrastructure accelerate virtual screening, synthetic route design, and formulation optimisation across the region.
China Chemical Informatics Market Growth Trends
China is a regional powerhouse with heavy state and private investment in computational drug discovery and materials informatics. Large-scale data initiatives, government-backed AI programs, and growing biotech clusters push demand for cheminformatics platforms. Local CROs leverage informatics to reduce experimental load and accelerate IND timelines, while domestic vendors increasingly compete with global suppliers on cloud-native, compliant solutions.
Europe Chemical Informatics Market Growth Is Driven By The Strong Regulatory Presence
Europe’s chemical informatics market is characterised by strong regulatory drivers (REACH, safety/toxicity rules) and emphasis on sustainable chemistry. Organisations use informatics for compliance, hazard prediction, and greener product design. Pan-European research programs and industry–academic consortia accelerate platform development, while multi-language and cross-border data governance needs shape the adoption of secure, validated cheminformatics solutions across industries.
Germany Chemical Informatics Market Growth Trends
Germany leads European demand due to its robust chemical, pharmaceutical, and automotive materials sectors. German companies prioritise high-quality data management, modelling for process optimisation, and informatics-driven materials discovery. The country’s strong engineering and software capabilities foster the adoption of enterprise-grade cheminformatics, connecting laboratory automation, analytics, and product lifecycle systems to improve time-to-market and regulatory readiness.
South America Chemical Informatics Market Has Seen Significant Growth In The Market
South America shows steady, selective adoption of chemical informatics driven by chemical manufacturing, agrochemical R&D, and growing regulatory needs. Companies focus on predictive toxicology and formulation tools to meet export standards and local safety requirements. Market growth is supported by partnerships with global software vendors and regional CROs offering cheminformatics-enabled services to optimise discovery and compliance workflows.
Brazil Chemical Informatics Market Growth Trends
Brazil leads the region with established agrochemical, speciality chemical, and pharmaceutical firms investing in digital R&D tools. Adoption centres on QSAR modelling for toxicity prediction, database management for regulatory submissions, and process optimisation. Public–private research collaborations and university programs support skill development, enabling broader implementation of informatics solutions across industry segments.
Middle East & Africa (MEA) Chemical Informatics Market Growth Is Driven By Sustainability
MEA’s chemical informatics uptake is emerging, concentrated in petrochemicals, mining, and materials R&D. The region prioritises process modelling, environmental risk assessment, and inventory management solutions to support diversification and sustainability goals. Adoption is often project-driven, linked to large industrial players and sovereign investments seeking to modernise R&D and comply with international supply-chain standards.
GCC Countries Chemical Informatics Market Growth Trends
GCC nations (Saudi Arabia, UAE, Qatar) are expanding informatics capabilities through national research programs and petrochemical company initiatives. Investments target computational modelling for catalyst and materials development, environmental impact analysis, and digital lab systems to localise high-value chemical R&D. Partnerships with international vendors and academic collaborations help accelerate platform deployment and staff skill development.
Recent Developments
- In August 2025, Mitsui & Co., Ltd., QSimulate, and Quantinuum /launched the "QIDO" (Quantum Industrial Development Organisation) to accelerate quantum computing progress. This initiative involves using the "LabOne Q" software framework on Zurich Instruments' hardware to facilitate advancement.(Source: www.azoquantum.com)
- In January 2025, Sapio Sciences' Release 24.12 includes enhancements designed to streamline laboratory operations across chemistry, immunogenicity, GMP workflows, and molecular biology. The updates aim to automate processes, refine GMP standards, and add new features for tasks such as batch cloning and sequence assembly(Source:www.the-scientist.com)
- In May 2025, VelocityEHS introduced a redesigned MSDSonline SDS/Chemical Management software platform incorporating over 350 new features based on user input. Key enhancements include a more intuitive user interface, improved mobile access, advanced language support, expanded inventory tools, and enhanced regulatory cross-referencing for compliance with standards such as OSHA, WHMIS, and GHS.(Source: www.labmanager.com)
Top players in the Chemical Informatics Market & Their Offerings:
- Thermo Fisher Scientific (USA): Thermo Fisher is a major player in chemical and laboratory informatics, offering integrated platforms for chemical data analysis, molecular modelling, and laboratory information management. Its solutions support advanced material research, drug discovery, and regulatory compliance.
- Agilent Technologies (USA): Agilent provides powerful chemoinformatics and analytical software solutions used in chromatography, spectroscopy, and molecular structure analysis. Its platforms enable efficient chemical data processing, quality control, and material characterisation.
- PerkinElmer (USA): PerkinElmer delivers a wide suite of chemical informatics tools, including molecular modelling, predictive analytics, and electronic lab notebooks. Their solutions are widely used in pharmaceuticals, life sciences, and environmental testing.
- Waters Corporation (USA):Waters is known for its advanced chromatography and mass spectrometry systems integrated with chemical informatics software. Its data management and molecular analysis platforms are used for chemical profiling, materials research, and precision measurement.
- Merck KGaA (Germany):Merck offers comprehensive chemical informatics tools through its Sigma-Aldrich and MilliporeSigma brands. Its solutions support chemical structure management, reaction analysis, and predictive modelling for research labs and material developers.
Other Top Players Are
- Dassault Systèmes (BIOVIA)
- Schrödinger, Inc.
- Certara
- ChemAxon
- Dotmatics (Nonlinear Dynamics/now Dotmatics)
- OpenEye Scientific
- BioSolveIT
- Cresset / MolSoft
- Optibrium (and collaborating partners)
- Genedata
- KNIME Scilligence
- Simulations Plus
- Cresset / Molecular Discovery Ltd.
- VLife Sciences
- InfoChem / Molecular Networks GmbH
- Collaborative Drug Discovery (CDD)
- Chemical Computing Group (MOE)
Segments Covered:
By Product / Offering
- Software (Desktop & Enterprise)
- Cloud / SaaS platforms (hosted modelling, collaborative workspaces)
- Data & Databases (curated chemical libraries, spectral / reaction/property datasets)
- Services (consulting, managed informatics, bespoke model development, data curation)
By Function / Solution
- Molecular modelling & simulation (docking, free-energy, quantum methods)
- Virtual screening & library design (lead discovery)
- Reaction informatics & synthesis planning (automated retrosynthesis)
- Property prediction / ADMET modelling
- Chemical registration, ELN & inventory management
- Chemical structure search & cheminformatics toolkits (APIs, toolboxes)
By Application / End-Use
- Pharmaceuticals & Biotech
- Agrochemicals & Crop Science
- Materials Science & Specialty Chemicals (polymers, battery materials)
- Academia & Research Institutes
- Contract Research Organisations (CROs) & Contract Development & Manufacturing (CDMOs)
By Deployment / Delivery Mode
- On-premises enterprise installations
- Cloud / SaaS
By Component / Revenue Type
- License/subscription fees
- Professional services & managed projects
By Region
- North America
- U.S.
- Canada
- Mexico
- Europe
- Germany
- UK
- France
- Italy
- Spain
- Asia Pacific
- China
- India
- Japan
- South Korea
- Latin America
- Brazil
- Argentina
- Middle East & Africa
- Saudi Arabia
- South Africa
A Seven-Phase Framework
Our methodology is designed to be universally applicable across commodity chemicals, specialty chemicals, petrochemicals, construction chemicals, coatings, electronic chemicals, industrial gases, agrochemicals, water treatment chemicals, and performance materials. Each phase builds upon the last, creating a layered validation structure that minimizes estimation error and maximizes analytical confidence.
The framework ensures comprehensive market coverage, robust cross-validation, and reliable long-term forecasting — producing market estimates that withstand scrutiny from investors, regulators, and corporate strategy teams.

Seven-Phase Framework — Analytical Effort Distribution
Relative analytical effort allocated across each phase of the Chemicals & Materials research framework

Phase 1 - Secondary Research: Establishing the Foundation
Secondary research collects and evaluates publicly available information from authoritative sources, establishing the foundational understanding of market structure, value chain dynamics, competitive landscape, and end-use demand patterns. Every source is evaluated for credibility, recency, geographic relevance, and methodological soundness before inclusion.
Industry Associations
Sources include ACC, CEFIC, ICCA, JCIA, CPCIF, and SOCMA providing production volumes, consumption trends, capacity developments, and sustainability initiatives.
Company Disclosures
Annual reports, investor presentations, earnings transcripts, and regulatory filings reveal product portfolios, manufacturing footprints, capacity expansions, and revenue segmentation.
Government Databases
National statistical offices, customs authorities, environmental agencies, and industrial production databases provide verified statistics on output, trade flows, and regulatory compliance.
Trade Databases
UN Comtrade, ITC, Eurostat, and national customs authorities enable assessment of global product movement, import dependency, and export competitiveness across regions.
Our Secondary Research Sources
- Ministry of Chemicals and Fertilizers
- European Chemicals Agency
- United States Department of Energy
- Ministry of Industry and Information Technology
- Ministry of Economy Trade and Industry
- Ministry of Trade Industry and Energy
- National Institute of Standards and Technology
- Council of Scientific and Industrial Research
- Fraunhofer Society
- National Institute for Materials Science
Phase 2 — Supply-Side Assessment: Mapping Production Capabilities
Production Capacity Analysis
All major manufacturers are assessed for existing installed capacity, planned additions, expansions, new plant announcements, and technology adoption — mapped at global, regional, and country levels.
Capacity Utilization Adjustment
Installed capacity is adjusted using utilization rates based on demand conditions, feedstock availability, plant operating rates, maintenance schedules, and regulatory restrictions.
Manufacturer Revenue Analysis
Product-specific revenues, segment-level performance, regional distribution, average selling prices, and margin trends are evaluated to establish market value estimates.
Supply-Side Assessment — Capacity vs. Effective Production by Region
Illustrative comparison of installed capacity vs. effective production volume (after utilization rate adjustment) across major regions

Phase 3 — Demand-Side Assessment: Quantifying Chemical Consumption
Demand-side analysis quantifies chemical consumption across industries, applications, and geographies — identifying where and how chemicals are consumed throughout the value chain with precision.
End-Use Industry Analysis
Chemical demand is evaluated across automotive, construction, packaging, electronics, agriculture, healthcare, consumer goods, industrial manufacturing, energy and utilities, and water treatment. Industry output, production trends, and consumption intensity are analyzed to determine demand patterns.
Consumption Modeling
Demand is estimated using measurable indicators: kilograms per vehicle, kilograms per square meter of construction, dosage per cubic meter of water treated, kilograms per hectare of agricultural land, and kilograms per ton of manufactured products. Consumption factors are validated through industry publications and primary interviews.
Application Analysis
The market is segmented by application area to understand product performance requirements, formulation trends, technology adoption, customer preferences, and regulatory requirements improving demand accuracy and segmentation granularity.
Demand-Side Assessment — End-Use Industry Demand Distribution
Illustrative distribution of chemical & materials demand across key end-use industries

Phase 4 - Trade Flow Analysis: Balancing Regional Supply and Demand
Trade flow analysis reconciles regional supply and demand estimates through import and export data, identifying net supply positions, regional dependencies, and market imbalances. It serves as an independent validation layer that tests the consistency of supply-side and demand-side estimates.
Import Analysis
Import data is evaluated to determine volumes, source countries, product dependency, regional supply gaps, and pricing trends — identifying markets that rely heavily on external supply and where domestic production is insufficient to meet demand.
Export Analysis
Export assessments reveal production surplus, export competitiveness, regional manufacturing strength, and global market participation. Export patterns also help validate domestic production estimates and identify net exporting regions.
Apparent Consumption Model
Regional consumption is assessed using the standard apparent consumption formula:
Results identify net importing regions, net exporting regions, regional deficits, and surpluses — serving as an independent validation of supply and demand estimates.
Trade Flow Analysis — Net Supply Position by Region
Illustrative apparent consumption vs. domestic production across major regions — positive gap indicates net import dependency

Phase 5 — Primary Research: The Critical Validation Layer
Primary research tests and refines findings from secondary research through direct engagement with industry participants across the supply chain, demand side, and expert community. It captures intelligence that no database or published report can provide — the real-world experience of manufacturers, buyers, and specialists operating in the market.

Supply-Side Interviews
Conversations with chemical manufacturers, raw material suppliers, contract manufacturers, technology providers, and plant operators cover production trends, capacity utilization, pricing developments, technology shifts, and competitive dynamics.

Demand-Side Interviews
Engagement with OEMs, industrial consumers, procurement managers, distributors, formulators, and end-use manufacturers focuses on consumption trends, purchasing behavior, product substitution, demand outlook, and emerging applications.

Industry Expert Consultations
Additional interviews with industry consultants, independent experts, regulatory specialists, technical professionals, and research institutions provide deeper market context and validate key analytical assumptions.
Focus Areas of Primary Research:
Market Size & Forecast Validation
Revenue estimates, volume consumption, growth rates, forecast assumptions, regional demand.Supply Chain & Value Chain Assessment
Raw material sourcing, supply chain challenges, distribution networks, procurement practices.Production & Capacity Analysis
Manufacturing capacity, utilization rates, expansion projects, plant investments.Pricing & Cost Structure Analysis
Product pricing trends, feedstock costs, energy costs, margin pressures, pricing outlook.Competitive Landscape Assessment
Volume and value estimates confirmed to be fully consistent with one another before publicationInterview Volume by Market Scope
| Study Scope | Number of Interviews |
|---|---|
| Niche Market | 20 – 30 |
| Mid-Sized Market | 30 – 50 |
| Global Market | 50 – 80 |
| Highly Fragmented Market | 80 – 120 |
Interview Details:
Category : Manufacturers, Suppliers, Distributors, End Users, Experts/Associations
Average Duration : 30–60 Minutes
Interview Mode : Video calls, telephonic interviews, expert consultations
Interview Format : Structured / Semi-Structured questionnaire
Focus Areas of Primary Research:
Market Size & Forecast Validation :
Revenue estimates, volume consumption, growth rates, forecast assumptions, regional demand.
Supply Chain & Value Chain Assessment :
Raw material sourcing, supply chain challenges, distribution networks, procurement practices.
Production & Capacity Analysis :
Manufacturing capacity, utilization rates, expansion projects, plant investments.
Pricing & Cost Structure Analysis :
Product pricing trends, feedstock costs, energy costs, margin pressures, pricing outlook.
Competitive Landscape Assessment :
Market share, competitor positioning, strategic initiatives, partnerships, acquisitions.
Primary Research — Stakeholder Coverage by Category
Distribution of interview respondents across stakeholder categories (% share from PPT data)

Primary Research — Respondent Designation Profile
Seniority breakdown of interview respondents (% share from PPT data)

Primary Research — Geographic Coverage of Interviews
Regional distribution of primary research engagement (% share from PPT data)

Phase 6 — Data Triangulation and Market Validation
No single methodology is relied upon in isolation. Multiple independent estimation approaches are combined and reconciled to ensure consistency, accuracy, and analytical defensibility. Any material deviations between approaches are investigated and adjusted through additional validation cycles.
The final market size is derived through weighted triangulation of all validated methodologies. Any material deviations between approaches are investigated and adjusted through additional validation cycles. The outcome represents the most realistic assessment of the market based on available evidence and expert confirmation ensuring that volume and value estimates are fully consistent with one another.
Triangulation Framework — Input Contribution Weight
Relative weight each sizing input contributes to the final reconciled market estimate

Phase 7 — Forecast Modeling: Projecting Future Market Evolution
Forecasting evaluates the future trajectory of the market using a combination of quantitative indicators and qualitative assessments across economic, industry, and regulatory dimensions. Rather than simple extrapolation, each driver is independently modeled and integrated into a composite forecast.
Macroeconomic Indicators
GDP growth, industrial production, manufacturing output, construction activity, consumer spending, and capital investment form the quantitative foundation of long-term demand projections. These are applied at country, regional, and global levels.
Industry Growth Drivers
Urbanization, infrastructure development, industrialization, technological innovation, sustainability initiatives, and evolving product performance requirements are assessed at regional and industry levels — capturing both structural and cyclical demand drivers.
Capacity Expansion Analysis
Announced plant expansions, new manufacturing facilities, technology upgrades, and strategic investments are evaluated to determine future supply-demand dynamics and potential market tightness or oversupply situations.
Regulatory & Sustainability
Environmental regulations, chemical safety standards, emission reduction targets, circular economy initiatives, and sustainability requirements are incorporated as they often influence product adoption rates and market growth trajectories.
Scenario Forecast Range — Indexed Market Growth (Year 1–10)
Illustrative indexed growth trajectories across Base, Optimistic, and Pessimistic scenarios over a 10-year forecast horizon

Forecast Drivers — Relative Impact Score by Category
Impact score (0–100) of each driver type on chemicals & materials market forecast




Comments
Share your thoughts, ask a question, or provide feedback about this report.