
Biohydrogen Market Size and Forecast 2026 to 2035
The global biohydrogen market size is calculated at USD 76.78 million in 2025 and is predicted to increase from USD 82.51 million in 2026 and is projected to reach around USD 157.80 million by 2035, The market is expanding at a CAGR of 7.47% between 2025 and 2035. Asia Pacific dominated the biohydrogen market with a market share of 45.50% the global market in 2024. The rising demand for fuels is the key driver of market growth. Also, the rising need for clean hydrogen in transportation, along with the rise of biofuels and technological innovations, can further fuel market growth.

Key Takeaways
- By region, North America dominated the market with a 45.5% share in 2024.
- By region, Asia Pacific is expected to grow at the highest CAGR of 8.5% over the forecast period.
- By region, Europe is expected to grow at a notable CAGR over the forecast period.
- By production method, the fermentation segment dominated the biohydrogen market with a 47.6% share in 2024.
- By production method, the photobiological process segment is expected to grow at the fastest CAGR of 7.5% over the forecast period.
- By feedstock, the agricultural residues segment held a 43.1% market share in 2024.
- By feedstock, the algae & microorganisms' segment is expected to grow at the fastest CAGR of 7.9% over the forecast period.
- By application, the transportation segment dominated the biohydrogen market with a 42.4% share in 2024.
- By application, the power generation segment is expected to grow at the highest CAGR of 7.6% over the forecast period.
- By end-use industry, the energy & power segment dominated the market with a 45.5%share in 2024.
- By end-use industry, the transportation segment is expected to grow at the highest CAGR of 7.8% during the projected period.
What is Biohydrogen?
Increasing investments in green hydrogen infrastructure, supportive government policies, and advances in biotechnology and microbial engineering are driving the global transition toward sustainable hydrogen production. The biohydrogen market involves the production of hydrogen fuel through biological processes such as fermentation, photobiological conversion, and microbial electrolysis using biomass, algae, or waste materials. Biohydrogen is a clean, renewable energy carrier that emits only water upon combustion, making it crucial for decarbonizing transportation, power generation, and industrial applications.
Current Trends in Biohydrogen Market :
- Industry Growth Overview: According to the International Energy Agency (IEA), global hydrogen demand reached approximately 97 million tonnes in 2023, up 2.5% from 2022. However, low-emissions hydrogen (including biohydrogen) still accounted for less than 1 Mt globally in 2023. The gap between conventional hydrogen and bio-based routes implies substantial growth potential for biohydrogen as process costs decline and regulatory support improves.
- Sustainability Trends: A 2024 review found that biohydrogen production yields in advanced bioreactors reached up to 208.3 L Hâ‚‚/L-day under specific conditions (sugar beet molasses substrate, pH 4.4, OLR 850 g COD/L-day). Research also indicates that biological hydrogen production cost remains high (in the range of USD 10–20 GJ⻹) compared with fossil-derived hydrogen. The important implication is that unless cost curves converge and feedstock supply is secured, the sustainability promise of biohydrogen may not convert into large-scale deployment quickly.
- Global Expansion: The IEA notes that demand for low-emissions hydrogen increased by nearly 10 % in 2024 but still represents less than 1 % of total hydrogen demand. Regions such as Europe, Asia-Pacific, and North America are actively developing hydrogen strategies and demonstrating projects that could create infrastructure for biohydrogen integration. For biohydrogen in particular, countries with strong biomass supplies and waste-to-energy systems may see earlier commercial entry, provided regulatory and policy frameworks support its scale-up.
- Major Investors: Government roadmaps, for example, from the U.S. Department of Energy, emphasise sizeable investment in low-carbon hydrogen pathways and technology readiness. Despite that, only a small portion of the large energy and chemical companies’ hydrogen investments are explicitly directed at strictly biological hydrogen production; most focus remains on electrolysis and fossil-based hydrogen with carbon capture.
- This underlines a key challenge for biohydrogen: attracting investor attention relative to more mature hydrogen technologies and demonstrating commercial viability at scale.
Report Scope
| Report Attributes | Details |
| Market Size in 2026 | USD 82.51 Million |
| Expected Size by 2035 | USD 157.80 Million |
| Growth Rate from 2025 to 2035 | CAGR 7.47% |
| Base Year of Estimation | 2024 |
| Forecast Period | 2026 - 2035 |
| Leading Region | North America |
| Fastest Growing Region | Asia Pacific |
| Segment Covered | By Production Method, By Feedstock, By Application, By End-Use Industry, By Region |
| Key Companies Profiled | Air Products and Chemicals, Inc., Linde plc , Air Liquide S.A. , ENGIE SA , Shell plc , Ballard Power Systems Inc, Plug Power Inc, Hydrogenics Corporation , Siemens Energy AG , SGH2 Energy Global LLC , Next Hydrogen Solutions Inc. , HyGear B.V. , H2Pro Ltd.., Green Hydrogen Systems A/S , Ergosup SA |
How Cutting Edge Technologies are revolutionizing the Biohydrogen Market?
- Advanced technologies are transforming the biohydrogen market by enabling higher-efficiency production, enhanced system durability, and more sustainable manufacturing and feedstock processes. According to a 2024 review in Advanced Composites and Hybrid
- Materials, nanotechnology applications (nanocatalysts, nanostructured materials) in biomass-based hydrogen production have significant potential for commercialisation, as they improve conversion efficiency and reduce process barriers.
- In particular, bioelectrochemical systems such as microbial electrolysis cells (MECs) are gaining traction: a recent review outlines how MECs enable hydrogen production from organic waste at lower applied voltages than conventional water electrolysis. The integration of digital manufacturing, reactor design optimisation, and artificial intelligence-enabled process control is enabling improved functionality and scalability of biohydrogen systems.
- For example, a 2024 systematic review of anaerobic-digestion-based biohydrogen production highlights emerging trends in AI-driven process optimisation and advanced reactor configurations.
Trade Analysis of Biohydrogen Market: Import & Export Statistics:
- Trade Analysis of Biohydrogen Market: Import and Export Perspectives Europe recorded hydrogen demand of about 7.9 million tonnes in 2023, a decline of about 3% from 2022. According to Hydrogen Europe, this reflects slower industrial activity but a continued long-term need for renewable hydrogen sources.
- The International Renewable Energy Agency (IRENA) reports that about 25 % of global hydrogen production could be traded internationally by 2050. This indicates that biohydrogen, once cost-competitive, may enter future cross-border hydrogen supply chains.
- A 2024 review on biohydrogen production noted strong regional differences in biofeedstock availability. For example, Asia has high volumes of agricultural residues, while Europe has robust municipal waste systems. These patterns suggest that future export hubs may emerge in regions with abundant biomass resources.
- Germany has already outlined a hydrogen import strategy. Reuters reports that Germany expects to require 95 to 120 TWh of hydrogen by 2030, with imports supplying between 50 and 70% of this demand. If biohydrogen qualifies under low-carbon certification rules, it may be included in these import flows.
- According to a 2025 study on hydrogen export economics, price variations of 36-47 % can occur depending on delivery flexibility. This means exporters of biohydrogen will need strong certification and logistics systems to remain competitive.
- Countries with high hydrogen demand but limited biomass, such as Japan and several Western European nations, may become future importers. Regions with strong biomass resources, such as Latin America, parts of Asia, and parts of Africa, may emerge as export-oriented biohydrogen production zones if investment and infrastructure expand.
Biohydrogen Market Value Chain Analysis
- Feedstock Procurement :This stage involves sourcing biomass, such as agricultural residues, organic waste, and industrial byproducts, as inputs for biological or thermochemical hydrogen production. Feedstock quality and availability strongly influence production cost and yield efficiency across the value chain.
- Major Players: Darling Ingredients Inc., Drax Group plc, Enerkem.
- Chemical Synthesis and Processing : This step includes large-scale conversion techniques, such as dark fermentation, photofermentation, gasification, and microbial electrolysis, that generate biohydrogen from biomass feedstocks. Companies involved in this stage focus on improving process efficiency, reducing energy use, and ensuring consistent hydrogen purity for industrial applications.
- Major Players: Linde plc, Air Products and Chemicals Inc., Shell plc.
- Packaging and Labelling :Hydrogen produced is stored in high-pressure cylinders, cryogenic tanks, or pipeline systems designed to maintain stability and prevent leakage during transport. Labelling standards ensure clear identification of hydrogen grade, storage conditions, and safety information required for distribution to industrial and commercial users.
- Major Players: Linde plc, Air Products and Chemicals Inc., Air Liquide.
- Regulatory Compliance and Safety Monitoring : This stage covers adherence to national and international standards for hydrogen handling, emissions control, storage infrastructure, and operational safety. Regulatory frameworks guide system design, workplace safety, and certification processes to ensure safe production and distribution of biohydrogen across all end-use sectors.
Biohydrogen Market's Regulatory Landscape: Global Regulations
| Country/Region | Key Regulations |
| European Union (EU) | The "Fit for 55%" package and the REPowerEU Plan set ambitious targets for renewable hydrogen production and consumption in various sectors, but often overlook the specific potential of biohydrogen technologies. |
| United States (US) | Primarily uses financial incentives, notably the Hydrogen Production Tax Credit, to encourage low-emission hydrogen production—regulations for specific infrastructure and safety fall under the purview of existing bodies. |
| China | World's largest producer and consumer of hydrogen, rapidly scaling up electrolysis capacity with robust policies and investment. Regulations support large-scale demonstration projects and industrial applications. |
Segment Insights
Production Method Insights
How Much Share Did the Fermentation Segment Hold in 2024?
- The fermentation segment dominated the market, accounting for 47.6% in 2024. The segment's dominance can be attributed to growing government support for renewable energy and the drive to seek eco-friendly alternatives to fossil fuels amid climate change.
- The photobiological process segment is expected to grow at the highest CAGR of 7.5% over the forecast period. The growth of the segment can be credited to the rapid innovations in biotechnology and research, coupled with the rising demand for renewable and clean energy sources.
- The biomass gasification segment held a significant market share in 2024. The segment's growth can be fuelled by a surge in efforts to reduce greenhouse gas (GHG) emissions to tackle climate change. Governments globally are offering subsidies and financial incentives to support bioenergy projects.
- The growth of the microbial electrolysis segment can be boosted by a global push towards carbon-neutral and renewable fuels, along with the rapid innovations in MEC technology, such as enhanced electrode materials and reactor designs.
Feedstock Insights
Which Feedstock Type Segment Dominated the Biohydrogen Market in 2024?
- The agricultural residues segment held a 43.1% market share in 2024. The segment's dominance can be attributed to environmental sustainability goals, rapid research and development in biological processes, and a supply of renewable, low-cost feedstock.
- The algae & microorganisms segment is expected to grow at the highest CAGR of 7.9% over the forecast period. The growth of the segment can be driven by the ongoing development of cutting-edge bioreactor systems, such as hybrid processes which combine dark fermentation with photo-fermentation or microbial electrolysis.
- The industrial waste segment held a major market share in 2024. The segment's growth is boosted by stringent environmental regulations and an increasing commitment to decarbonizing the energy sector. Favourable government initiatives are also driving further positive segment growth.
- Waste management, environmental imperatives, and technological innovations can drive the growth of the municipal solid waste segment. Countries around the world are implementing national hydrogen strategies to increase future demand for biohydrogen.
Application Insights
Which Application Type Segment Dominated the Biohydrogen Market in 2024?
- The transportation segment dominated the market, accounting for 42.4% in 2024. The segment's dominance is owed to rapid innovations in storage and transportation technology, as well as global decarbonization efforts. Supportive government policies are offering a major incentive for developing transportation.
- The power generation segment is expected to grow at the highest CAGR of 7.6% over the forecast period. The segment's growth is driven by a surge in global energy demand and innovations in hydrogen production technology. Companies are heavily investing in hydrogen technologies across many sectors.
- The industrial energy segment held a significant market share in 2024. The growth of the segment can be fuelled by increased investments in hydrogen infrastructure and renewable energy, including manufacturing, storage, and distribution.
- The growth of the residential fuel segment can be driven by rising consumer interest in clean energy solutions and an inclination towards more reliable, potentially off-grid power sources. Biohydrogen can act as an efficient energy carrier for residential facilities.
End-Use Industry Insight
Which End-User Industry Segment Dominated the Biohydrogen Market in 2024?
- The energy & power segment dominated the market with a 45.5%share in 2024. The segment's dominance can be attributed to the growing emphasis on developing cost-effective manufacturing technologies, supportive government initiatives, and investments in hydrogen infrastructure.
- The transportation segment is expected to grow at the highest CAGR of 7.8% during the projected period. The segment's growth can be credited to increasing concerns over climate change, which are driving stringent environmental regulations.
- The chemical manufacturing segment held a major market share in 2024. The segment's growth can be driven by the growing need for sustainable clean feedstocks and by favourable government initiatives, grants, and policies supporting clean energy.
- The growth of the research institutes segment can be fuelled by strategic collaborations among technology providers, research institutions, and energy companies that optimise knowledge exchange, technology transfer, and commercial-scale projects.
Regional Insights
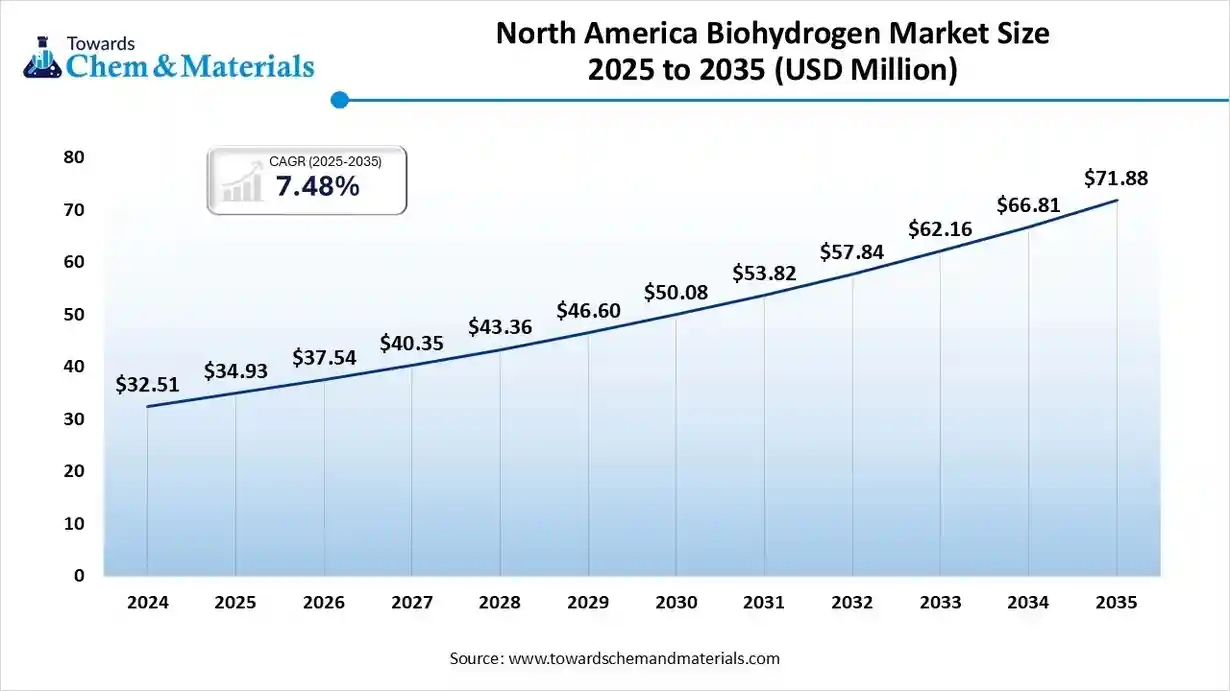
The North America biohydrogen market size was valued at USD 34.93 million in 2025 and is expected to reach USD 71.88 million by 2035, growing at a CAGR of 7.48% from 2025 to 2035. North America held a 45.5 percent share of the biohydrogen market in 2024, supported by strong clean energy targets and large-scale investments in low-carbon hydrogen infrastructure.
The region benefited from rising demand for renewable hydrogen for power generation, industrial heat, and transportation. Adoption of fuel cell electric vehicles continued to increase, driven by supportive state policies and fleet-level deployments in logistics and public transport. Industries across the United States and
Canada are also transitioning toward cleaner energy inputs, which is expected to further accelerate regional market expansion in the coming years.
In North America, the U.S. dominated the market owing to the innovations in production technologies, favourable government policies, and financial incentives. In addition, widespread adoption of hydrogen infrastructure, such as pipelines and storage facilities, helps optimize the commercialization and broader adoption of biohydrogen.
Why Is Asia Pacific Poised as the Next Frontier in the Biohydrogen Market
Asia Pacific is projected to record the fastest growth at a CAGR of 8.5 percent, supported by strong national commitments to hydrogen development across major economies. Governments in China, India, Japan, and South Korea are implementing policies that promote low-carbon hydrogen, industrial decarbonisation, and large-scale demonstration projects. Rising demand for cleaner fuels in transport, power generation, and manufacturing is further strengthening regional momentum. As hydrogen strategies move toward implementation, investment activity and domestic production capacity are expected to increase across the region.
In Asia Pacific, China led the market due to ongoing research and development driving technological innovations in hydrogen production, storage, and use. Moreover, the Chinese government offers support through significant investments in R&D and infrastructure development.
What Are the Trends in the European Biohydrogen Market?
Europe is expected to grow at a notable CAGR over the forecast period. The region's growth can be driven by rising emphasis on energy security and a substantial push towards hydrogen infrastructure and the adoption of hydrogen-powered vehicles. The region is also emphasising hydrogen to decarbonize energy-intensive industries such as chemicals and steel.
Germany Biohydrogen Market Trends
The German market is fuelled by the expansion of the national hydrogen pipeline network and storage capabilities, which optimize the efficient distribution and integration of biohydrogen into a much wider energy system.
Latin America held a significant market share in 2024, supported by strong renewable energy resources and increasing national commitments to decarbonisation. The region benefits from some of the world’s highest wind and solar capacities, which help lower the cost of green hydrogen production and create favourable conditions for future biohydrogen development. Several countries are introducing policies and pilot projects to integrate renewable hydrogen into industrial and transport sectors. As investment interest grows, Latin America is expected to emerge as a competitive production hub for clean hydrogen technologies.
Biohydrogen Market Share, By Region, 2024 (%)
| Regional | Revenue Share |
| North America | 45.50% |
| Europe | 16.11% |
| Asia Pacific | 28.50% |
| Latin America | 6.45% |
| Middle East and Africa | 3.44% |
Brazil Biohydrogen Market Trends
In Latin America, Brazil dominated the market due to the growing demand for low-carbon energy solutions and the rapid advancement of biotechnological processes. Brazil's robust bioenergy industry offers a unique benefit due to the large supply of low-cost organic materials.
Recent Developments
- In July 2025, Germany and Canada collaborated to launch a €400 million hydrogen tender under the H2Global initiative. This tender aims to bridge the cost gap for green hydrogen manufacturing, promoting global market expansion.(Source: fuelcellsworks.com)
- In February 2025, Plug Power introduced a spot pricing program for liquid green hydrogen. Hydrogen buyers can now purchase liquid green hydrogen directly from Plug's production plants without requiring long-term take-or-pay agreements.(Source: www.offshore-energy.biz)
Biohydrogen Market Companies
- Air Products and Chemicals, Inc. – Air Products is a global leader in industrial gas supply and hydrogen infrastructure, with growing investments in biohydrogen derived from biogas and renewable feedstocks. Its large-scale clean hydrogen projects support decarbonization across mobility, refining, and industrial sectors.
- Linde plc – Linde provides end-to-end hydrogen solutions, including production, purification, liquefaction, and storage, with active development in biohydrogen pathways using biogas reforming. The company supports European and global projects integrating renewable hydrogen into transport and industrial energy systems.
- Air Liquide S.A. – Air Liquide develops renewable and low-carbon hydrogen systems through biogas reforming and electrolysis. The company operates several pilot and commercial biohydrogen projects in Europe, advancing the distribution and blending of clean hydrogen in industrial networks.
- ENGIE SA – ENGIE is expanding into biohydrogen through projects that combine biogas, electrolysis, and renewable power. Its initiatives focus on supplying low-carbon hydrogen for industrial decarbonization, mobility applications, and integrated renewable energy hubs.
- Shell plc – Shell invests in biomass gasification, renewable hydrogen, and advanced biofuel projects to expand its clean fuel portfolio. The company integrates biohydrogen development with downstream distribution and hydrogen refueling for heavy transport and aviation sectors.
- Ballard Power Systems Inc. – Ballard develops fuel cell systems that can utilize hydrogen produced from bio-based sources. Its technology is applied in buses, trucks, rail, and stationary power, helping drive the adoption of renewable hydrogen in mobility.
- Plug Power Inc. – Plug Power produces fuel cell systems and develops renewable hydrogen generation via electrolysis and biomass-derived routes. The company is building a vertically integrated hydrogen network covering production, liquefaction, distribution, and end-use applications.
- Hydrogenics Corporation – Hydrogenics, now part of Cummins, provides electrolysis systems and fuel cell products that support both green and biohydrogen production. Its technology enables industrial integration of renewable hydrogen for power-to-gas, mobility, and grid storage.
- Siemens Energy AG – Siemens Energy develops electrolyzers and renewable hydrogen systems compatible with biogas upgrading. Its solutions combine digital controls and renewable integration for efficient, scalable, and low-emission hydrogen production.
- SGH2 Energy Global LLC – SGH2 produces hydrogen from waste biomass using plasma-enhanced gasification, generating high-purity hydrogen with very low lifecycle emissions. Its process converts a wide range of biogenic and residual waste streams into renewable hydrogen.
- Next Hydrogen Solutions Inc. – Next Hydrogen manufactures innovative modular electrolyzers that can operate with renewable electricity and biogas-based systems. Its technology is designed for flexible, distributed clean hydrogen production.
- HyGear B.V. – HyGear offers on-site hydrogen generation using small-scale reforming systems compatible with biogas feedstocks. The company provides localized, cost-efficient hydrogen supply for industrial clients seeking reduced emissions.
- H2Pro Ltd. – H2Pro develops E-TAC water-splitting technology that improves the efficiency and cost of hydrogen production. The company is exploring hybrid renewable and bio-integrated hydrogen pathways to support large-scale deployment.
- Green Hydrogen Systems A/S – Green Hydrogen Systems produces modular alkaline electrolyzers suitable for renewable and biogas-supported hydrogen generation. The company enables scalable hydrogen supply for industrial, mobility, and energy storage applications.
- Ergosup SA – Ergosup specializes in electrochemical hydrogen production and integrated compression, offering systems suited for localized biohydrogen generation. Its technology targets mobility refueling, distributed energy, and small-scale industrial use.
Segments Covered in the Report
By Production Method:
- Fermentation
- Photobiological Process
- Gasification of Biomass
- Microbial Electrolysis
By Feedstock:
- Agricultural Residues
- Algae & Microorganisms
- Industrial Waste
- Municipal Solid Waste
By Application:
- Transportation
- Power Generation
- Industrial Energy
- Residential Fuel
By End-Use Industry:
- Energy & Power
- Transportation Chemical Manufacturing
- Research Institutes
By Region
- North America
- U.S.
- Canada
- Mexico
- Europe
- Germany
- UK
- France
- Italy
- Spain
- Asia Pacific
- China
- India
- Japan
- South Korea
- Latin America
- Brazil
- Argentina
- Middle East & Africa
- Saudi Arabia
- South Africa
A Seven-Phase Framework
Our methodology is designed to be universally applicable across commodity chemicals, specialty chemicals, petrochemicals, construction chemicals, coatings, electronic chemicals, industrial gases, agrochemicals, water treatment chemicals, and performance materials. Each phase builds upon the last, creating a layered validation structure that minimizes estimation error and maximizes analytical confidence.
The framework ensures comprehensive market coverage, robust cross-validation, and reliable long-term forecasting — producing market estimates that withstand scrutiny from investors, regulators, and corporate strategy teams.

Seven-Phase Framework — Analytical Effort Distribution
Relative analytical effort allocated across each phase of the Chemicals & Materials research framework

Phase 1 - Secondary Research: Establishing the Foundation
Secondary research collects and evaluates publicly available information from authoritative sources, establishing the foundational understanding of market structure, value chain dynamics, competitive landscape, and end-use demand patterns. Every source is evaluated for credibility, recency, geographic relevance, and methodological soundness before inclusion.
Industry Associations
Sources include ACC, CEFIC, ICCA, JCIA, CPCIF, and SOCMA providing production volumes, consumption trends, capacity developments, and sustainability initiatives.
Company Disclosures
Annual reports, investor presentations, earnings transcripts, and regulatory filings reveal product portfolios, manufacturing footprints, capacity expansions, and revenue segmentation.
Government Databases
National statistical offices, customs authorities, environmental agencies, and industrial production databases provide verified statistics on output, trade flows, and regulatory compliance.
Trade Databases
UN Comtrade, ITC, Eurostat, and national customs authorities enable assessment of global product movement, import dependency, and export competitiveness across regions.
Our Secondary Research Sources
- Ministry of Chemicals and Fertilizers
- European Chemicals Agency
- United States Department of Energy
- Ministry of Industry and Information Technology
- Ministry of Economy Trade and Industry
- Ministry of Trade Industry and Energy
- National Institute of Standards and Technology
- Council of Scientific and Industrial Research
- Fraunhofer Society
- National Institute for Materials Science
Phase 2 — Supply-Side Assessment: Mapping Production Capabilities
Production Capacity Analysis
All major manufacturers are assessed for existing installed capacity, planned additions, expansions, new plant announcements, and technology adoption — mapped at global, regional, and country levels.
Capacity Utilization Adjustment
Installed capacity is adjusted using utilization rates based on demand conditions, feedstock availability, plant operating rates, maintenance schedules, and regulatory restrictions.
Manufacturer Revenue Analysis
Product-specific revenues, segment-level performance, regional distribution, average selling prices, and margin trends are evaluated to establish market value estimates.
Supply-Side Assessment — Capacity vs. Effective Production by Region
Illustrative comparison of installed capacity vs. effective production volume (after utilization rate adjustment) across major regions

Phase 3 — Demand-Side Assessment: Quantifying Chemical Consumption
Demand-side analysis quantifies chemical consumption across industries, applications, and geographies — identifying where and how chemicals are consumed throughout the value chain with precision.
End-Use Industry Analysis
Chemical demand is evaluated across automotive, construction, packaging, electronics, agriculture, healthcare, consumer goods, industrial manufacturing, energy and utilities, and water treatment. Industry output, production trends, and consumption intensity are analyzed to determine demand patterns.
Consumption Modeling
Demand is estimated using measurable indicators: kilograms per vehicle, kilograms per square meter of construction, dosage per cubic meter of water treated, kilograms per hectare of agricultural land, and kilograms per ton of manufactured products. Consumption factors are validated through industry publications and primary interviews.
Application Analysis
The market is segmented by application area to understand product performance requirements, formulation trends, technology adoption, customer preferences, and regulatory requirements improving demand accuracy and segmentation granularity.
Demand-Side Assessment — End-Use Industry Demand Distribution
Illustrative distribution of chemical & materials demand across key end-use industries

Phase 4 - Trade Flow Analysis: Balancing Regional Supply and Demand
Trade flow analysis reconciles regional supply and demand estimates through import and export data, identifying net supply positions, regional dependencies, and market imbalances. It serves as an independent validation layer that tests the consistency of supply-side and demand-side estimates.
Import Analysis
Import data is evaluated to determine volumes, source countries, product dependency, regional supply gaps, and pricing trends — identifying markets that rely heavily on external supply and where domestic production is insufficient to meet demand.
Export Analysis
Export assessments reveal production surplus, export competitiveness, regional manufacturing strength, and global market participation. Export patterns also help validate domestic production estimates and identify net exporting regions.
Apparent Consumption Model
Regional consumption is assessed using the standard apparent consumption formula:
Results identify net importing regions, net exporting regions, regional deficits, and surpluses — serving as an independent validation of supply and demand estimates.
Trade Flow Analysis — Net Supply Position by Region
Illustrative apparent consumption vs. domestic production across major regions — positive gap indicates net import dependency

Phase 5 — Primary Research: The Critical Validation Layer
Primary research tests and refines findings from secondary research through direct engagement with industry participants across the supply chain, demand side, and expert community. It captures intelligence that no database or published report can provide — the real-world experience of manufacturers, buyers, and specialists operating in the market.

Supply-Side Interviews
Conversations with chemical manufacturers, raw material suppliers, contract manufacturers, technology providers, and plant operators cover production trends, capacity utilization, pricing developments, technology shifts, and competitive dynamics.

Demand-Side Interviews
Engagement with OEMs, industrial consumers, procurement managers, distributors, formulators, and end-use manufacturers focuses on consumption trends, purchasing behavior, product substitution, demand outlook, and emerging applications.

Industry Expert Consultations
Additional interviews with industry consultants, independent experts, regulatory specialists, technical professionals, and research institutions provide deeper market context and validate key analytical assumptions.
Focus Areas of Primary Research:
Market Size & Forecast Validation
Revenue estimates, volume consumption, growth rates, forecast assumptions, regional demand.Supply Chain & Value Chain Assessment
Raw material sourcing, supply chain challenges, distribution networks, procurement practices.Production & Capacity Analysis
Manufacturing capacity, utilization rates, expansion projects, plant investments.Pricing & Cost Structure Analysis
Product pricing trends, feedstock costs, energy costs, margin pressures, pricing outlook.Competitive Landscape Assessment
Volume and value estimates confirmed to be fully consistent with one another before publicationInterview Volume by Market Scope
| Study Scope | Number of Interviews |
|---|---|
| Niche Market | 20 – 30 |
| Mid-Sized Market | 30 – 50 |
| Global Market | 50 – 80 |
| Highly Fragmented Market | 80 – 120 |
Interview Details:
Category : Manufacturers, Suppliers, Distributors, End Users, Experts/Associations
Average Duration : 30–60 Minutes
Interview Mode : Video calls, telephonic interviews, expert consultations
Interview Format : Structured / Semi-Structured questionnaire
Focus Areas of Primary Research:
Market Size & Forecast Validation :
Revenue estimates, volume consumption, growth rates, forecast assumptions, regional demand.
Supply Chain & Value Chain Assessment :
Raw material sourcing, supply chain challenges, distribution networks, procurement practices.
Production & Capacity Analysis :
Manufacturing capacity, utilization rates, expansion projects, plant investments.
Pricing & Cost Structure Analysis :
Product pricing trends, feedstock costs, energy costs, margin pressures, pricing outlook.
Competitive Landscape Assessment :
Market share, competitor positioning, strategic initiatives, partnerships, acquisitions.
Primary Research — Stakeholder Coverage by Category
Distribution of interview respondents across stakeholder categories (% share from PPT data)

Primary Research — Respondent Designation Profile
Seniority breakdown of interview respondents (% share from PPT data)

Primary Research — Geographic Coverage of Interviews
Regional distribution of primary research engagement (% share from PPT data)

Phase 6 — Data Triangulation and Market Validation
No single methodology is relied upon in isolation. Multiple independent estimation approaches are combined and reconciled to ensure consistency, accuracy, and analytical defensibility. Any material deviations between approaches are investigated and adjusted through additional validation cycles.
The final market size is derived through weighted triangulation of all validated methodologies. Any material deviations between approaches are investigated and adjusted through additional validation cycles. The outcome represents the most realistic assessment of the market based on available evidence and expert confirmation ensuring that volume and value estimates are fully consistent with one another.
Triangulation Framework — Input Contribution Weight
Relative weight each sizing input contributes to the final reconciled market estimate

Phase 7 — Forecast Modeling: Projecting Future Market Evolution
Forecasting evaluates the future trajectory of the market using a combination of quantitative indicators and qualitative assessments across economic, industry, and regulatory dimensions. Rather than simple extrapolation, each driver is independently modeled and integrated into a composite forecast.
Macroeconomic Indicators
GDP growth, industrial production, manufacturing output, construction activity, consumer spending, and capital investment form the quantitative foundation of long-term demand projections. These are applied at country, regional, and global levels.
Industry Growth Drivers
Urbanization, infrastructure development, industrialization, technological innovation, sustainability initiatives, and evolving product performance requirements are assessed at regional and industry levels — capturing both structural and cyclical demand drivers.
Capacity Expansion Analysis
Announced plant expansions, new manufacturing facilities, technology upgrades, and strategic investments are evaluated to determine future supply-demand dynamics and potential market tightness or oversupply situations.
Regulatory & Sustainability
Environmental regulations, chemical safety standards, emission reduction targets, circular economy initiatives, and sustainability requirements are incorporated as they often influence product adoption rates and market growth trajectories.
Scenario Forecast Range — Indexed Market Growth (Year 1–10)
Illustrative indexed growth trajectories across Base, Optimistic, and Pessimistic scenarios over a 10-year forecast horizon

Forecast Drivers — Relative Impact Score by Category
Impact score (0–100) of each driver type on chemicals & materials market forecast




Comments
Share your thoughts, ask a question, or provide feedback about this report.