
Asia Pacific Plastics In Personal Protective Equipment Market Size Analysis Report 2035
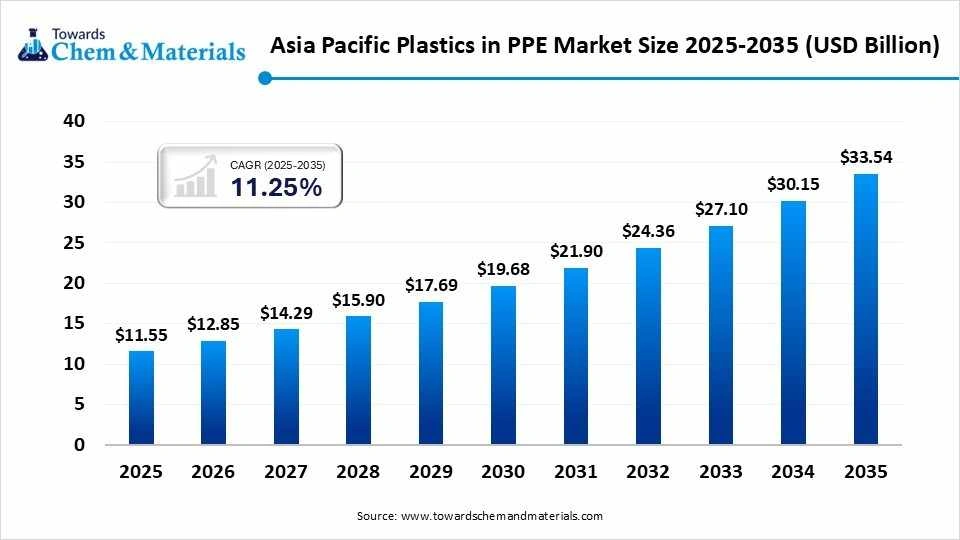
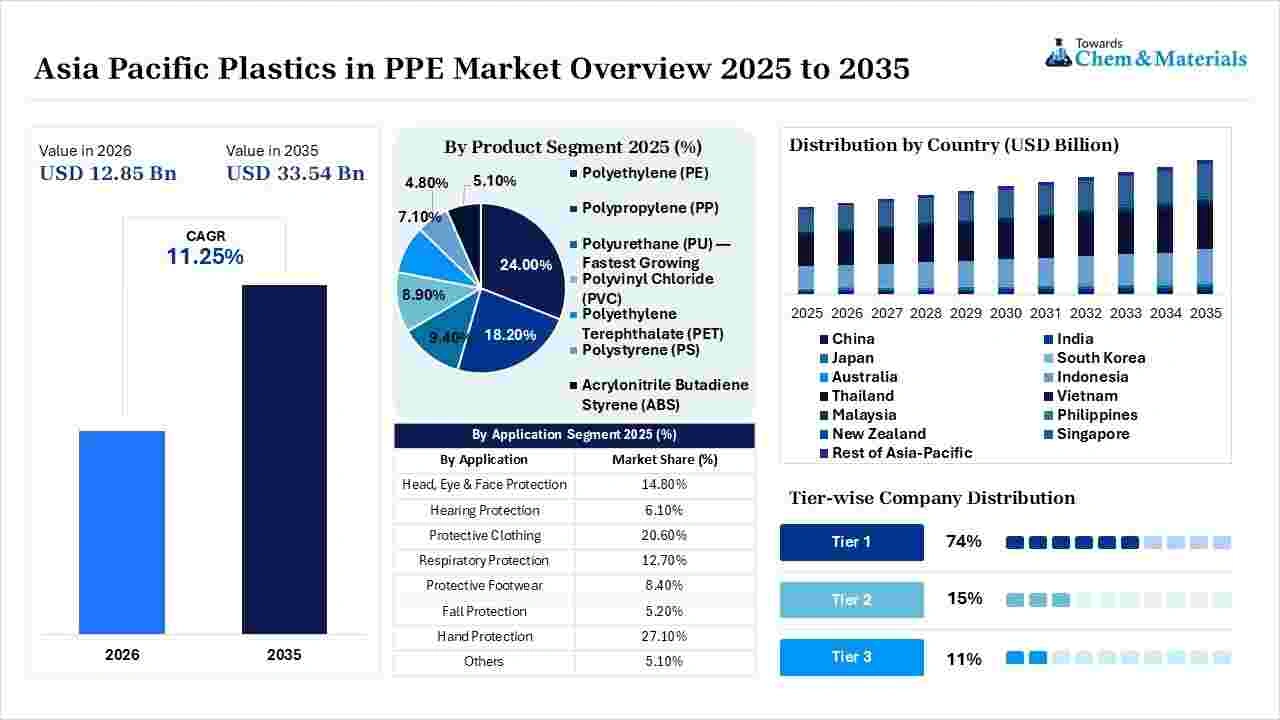
The Asia Pacific plastics in the PPE market size was estimated at USD 11.55 billion in 2025 and is projected to grow from USD 12.85 billion in 2026 to approximately USD 33.54 billion by 2035, at a CAGR of 11.25% from 2026 to 2035. The rapid industrialization in the region demands plastic in personal protective equipment due to expanding sectors like healthcare and manufacturing due to growing demand, which supports growth.
The regions government regulations and enforced safety and hygiene standards in factories and hospitals boost the growth of the market. The growing collaboration between major companies and chemical manufacturers like BASF SE, SABIC, LG Chem, and Arkema Group for supplying materials for personal protective equipment and related industry safety gear is a major growth factor in the market.
Market Highlights
- By country, China dominated the Asia Pacific plastics in PPE market with a share of 49.90% in 2025 and is expected to grow at a CAGR of 11.70% over the forecast period.
- By country, India held an 18.30% market share in the Asia Pacific plastics in PPE market in 2025 and is expected to experience the fastest growth with a CAGR of 13.1% in the forecast period.
- By product, the polyethylene segment dominated the market with a 24% share in 2025 and is expected to grow at a CAGR of 10.80% over the forecast period.
- By product, the polyurethane segment held a 9.40% market share in 2025 and is expected to have the fastest growth with a CAGR of 12.80% in the forecast period.
- By application, the hand protection segment dominated the market with 27.10% share in 2025 and is expected to have the fastest growth with a CAGR of 12.40% in the forecast period.
Market Overview
Asia Pacific Plastics in PPE Market: Rising Hygiene Awareness
The Asia Pacific plastics in PPE market is experiencing growth as they are highly used in various sectors, especially healthcare and medical. This is due to rising healthcare spending as there is a rise in population across the region, which is also aligned with awareness of infection control, which boosts the use of single-use plastic medical devices and protective wear, resulting in increased use and market growth. Rising industrialization and infrastructure development, as there is an increase in construction activity, a surge in the manufacturing sector, and chemical and mining activities across the region, which demand safety gear to protect laborers, which boosts the product.
The government across the region enforce struct safety laws for occupational health and to provide employers with certified protective equipment, which creates demand for plastics in personal protective equipment. The major regional players are increasing facilities for local manufacturing of the polymer, which helps in lowering the production costs and securing a steady supply chain across the region, supporting growth of the market. Growing automation adoption and research and development through the integration of technology in manufacturing, through collaboration of companies to improve product consistency.
- For instance, Dow and SCG Chemicals signed an MoU in partnership to transform 200KTA of plastic waste into circular plastic products by 2030. This partnership aims to accelerate supply chain management by developing new technology to secure sustainable polymer supply chains for regional manufacturing.
(Source: corporate.dow.com )
Global Investment Flow for Asia Pacific Plastics in PPE Market 2026
Manufacturers are investing heavily in advanced polymer formulation lines, shifting toward engineered polypropylene and specialized composites for better chemical resistance and breathability.
- Governments are implementing stricter environmental frameworks and Extended Producer Responsibility (EPR) guidelines, pushing companies to integrate recycled and low-waste polymer systems into medical and industrial supply chains.
- Dominant players like 3M, Honeywell, DuPont, and Ansell are scaling production facilities and upgrading polymer innovation for lightweight, chemical-resistant PPE.
- The region produces a large scale of global plastics via suppliers like Formosa Plastics and regional petrochemical leaders, ensuring localized, cost-effective raw material supply chains for polypropylene and polyethylene used in masks, shields, and protective suits.
- Large raw material suppliers such as Formosa Plastics Corp and regional giants like Reliance Industries invest heavily in feedstock refinement PP and HDPE chain to support local converters.
Market Growth Trends:
- The growing infrastructure and manufacturing activities in the region are resulting in industrial expansion across the region due to growing demand for protective gear, which is a growing trend in the growth of the market.
- The government regulations and enforcement of strict mandates for safety and occupational protection in sectors like oil and gas, healthcare, and construction support the growth of the market.
- High demand for hand protection and products such as plastic and rubber gloves, as there is huge demand for respiratory masks amid rising awareness following a growing trend in the market.
Report Scope
| Report Attributes | Details |
| Market Size in 2026 | USD 12.85 Billion |
| Expected Size in 2035 | USD 33.54 Billion |
| Growth Rate | CAGR of 11.25% |
| Base Year of Estimation | 2025 |
| Forecast Period | 2025-2035 |
| Segment Covered | By Product, By Application |
| Key Companies Profiled | BASF SE, SABIC, LG Chem, Sumitomo Chemical Co., Ltd., Arkema Group, Celanese Corporation, Evonik Industries AG, Asahi Kasei Corporation, Shin-Etsu Chemical Co., Ltd., Formosa Plastics Corporation, Mitsubishi Chemical Group, Teijin Limited, Toray Industries, Covestro AG, Solvay, Dow, ExxonMobil Corporation, Reliance Industries Limited, Polyplastics Co., Ltd. |
Key Technological Shifts in the Asia Pacific Plastics in PPE Market: Through AI Integration
The Asia pacific plastics in PPE market is experiencing growth through AI integration, as it helps in predictive maintenance, which helps in tracking of equipment, maintenance, and sensors, and machine learning models track conversion lines of raw products to reduce downtime and boost energy efficiency. The other key technological shifts are advanced material optimization, digital twin technology, and smart molding and agentic AI supporting growth of the market.
Supply Chain Analysis of Asia Pacific Plastics in PPE Market
Plastics Production & Processing for PPE
- Plastics such as polyethylene, polypropylene, polyurethane, PVC, PET, polycarbonate, polyamide, and polyester are processed into films, fibers, molded components, and protective materials used in gloves, protective clothing, footwear, respiratory equipment, helmets, and face protection.
- Key Players: SABIC, BASF, Covestro, Sumitomo Chemical.
- SABIC develops engineering and specialty polymer materials used in PPE applications, including protective equipment requiring impact resistance, durability, lightweight construction, and chemical resistance.
Quality Testing & Certification
- Plastic-based PPE must meet requirements for mechanical strength, impact resistance, chemical protection, flame resistance, thermal performance, filtration efficiency, and user safety. Across Asia Pacific, certification requirements vary between major markets such as China, India, Japan, and ASEAN countries, making compliance an important part of regional manufacturing and distribution.
- Key Authorities & Standards: International Organization for Standardization, ASTM International, Bureau of Indian Standards, China National Accreditation Service for Conformity Assessment.
- BASF develops polymer materials and performance additives for protective equipment, with material solutions designed to provide properties such as flame retardancy, durability, flexibility, and resistance to demanding operating conditions.
Distribution to End-Use Industries
- Plastic-based PPE is supplied to healthcare, manufacturing, construction, oil and gas, chemical, pharmaceutical, food processing, mining, and transportation industries. Growing industrialization and workplace-safety requirements across Asia Pacific are supporting demand, with China, India, Japan, and other emerging Asian economies representing important consumption and manufacturing centers.
- Key Suppliers: 3M, DuPont, Honeywell, Ansell.
- DuPont supplies advanced material technologies for protective clothing and other PPE applications, including high-performance fibers and protective materials designed for industrial, chemical, thermal, and occupational safety requirements.
Sustainability Analysis of Asia Pacific Plastics in PPE
The sustainability shift, as producers invest in advanced polymer formulations and circular recycling initiatives such as chemically recycled polyesters to mitigate environmental impact without sacrificing chemical resistance or barrier performance, increases their use. Governments are implementing rigorous plastic waste management rules and single-use bans, forcing industrial buyers to favor compliant, low-waste frameworks.
What are the conditions of Asia Pacific Plastics in PPE?
Plastics are essential materials used in manufacturing personal protective equipment as they provide strong barriers against fluids, chemicals, and pathogens while remaining lightweight and inexpensive. The main application like respiratory protection, fluid barriers, and eye and face protection, increase demand. The key types of plastics in PPE include polypropylene, polyethylene, polycarbonate, polyurethane, and polyacrylonitrile.
Asia Pacific Plastics in PPE Premium Pricing Analysis
Asia Pacific premium plastics used in personal protective equipment command a price premium over standard baseline resins due to specialized performance and high-heat or high-impact requirements. The growing use of products with exceptional optical clarity and impact resistance increases production, which lowers costs in the coming decades. Standard grades face downward pricing pressure from massive capacity expansions from China, forcing producers to pivot toward high-heat tolerance or metallocene-modified high-end grades to maintain margins.
Asia Pacific Plastics in PPE Market Carbon Tax Analysis
The market is experiencing rising production costs and structural shifts as regional governments implement carbon pricing and tighter environmental regulations, and rapid industrialization and expanding manufacturing demand drive this increased regional consumption. The increasing tightness of carbon pricing and traditional virgin fossil fuel plastics face economic penalties, which close the price gap with recycled and biodegradable polymers. Stricter carbon compliance forces regional manufacturers to explore carbon capture and utilization or bio-based feedstocks.
Asia Pacific Plastics in PPE Regulatory Landscape
| Country / Region | Regulatory Body | Key Regulations | Focus Areas | Notable Notes |
| China | Ministry of Emergency Management, State Administration for Market Regulation | Work Safety Law, PPE Product Standards | Worker protection, product certification, manufacturing safety | China dominates the Asia Pacific PPE landscape due to its large manufacturing base and growing demand across industrial, construction, and healthcare applications. Plastics such as PE, PP, PVC, and PC are widely used in protective equipment. |
| India | Ministry of Labour and Employment, Bureau of Indian Standards | Occupational Safety, Health and Working Conditions Code, BIS PPE Standards | Workplace safety, product quality, industrial PPE | India is expected to be one of the fastest-growing markets in the region, supported by industrialization, infrastructure development, and expanding healthcare and manufacturing sectors. |
| Japan | Ministry of Health, Labour and Welfare, Ministry of Economy, Trade and Industry | Industrial Safety and Health Act, Japanese Industrial Standards | High-performance PPE, worker safety, advanced materials | Japan emphasizes high-performance plastic materials for protective equipment used in manufacturing, healthcare, electronics, and other specialized industries. |
Market Dynamics
Drivers
Asia Pacific Plastics in PPE Market: Rapid Industrialization
The growth of the Asia Pacific plastics in PPE market is driven by the growing industrialization and urbanization in the region, which drives demand for infrastructure development plans. As there is a surge in population in the region, the demand for construction of residential buildings has also increased, which increases the demand for safety gear for workers. These safety gears are made from plastics, which are certifies plastic based protective equipment. These are in increased demand as the government also enforces strong standards for strict workplace safety regulations, supporting further growth of the market.
Challenges
Asia Pacific Plastics in PPE Market: Supply Chain Disruptions
The Asia Pacific plastics in PPE market is experiencing some challenges in the growth of the market, like high raw material costs due to fluctuating prices for petroleum-based polymers like polypropylene, polycarbonate, and PVC, which hinders growth. The supply chain is disrupted due to regional logistics bottlenecks and heavy reliance on import wich delays production and delivery and affects market growth.
Opportunities
Asia Pacific Plastics in PPE Market: Eco-Friendly Materials Demand
The massive industrialization and high demand in healthcare and manufacturing drive growth. The demand for eco-friendly materials, as buyers and manufacturers focus on recycled and low-waste plastics and companies shift towards green polymer use, supports growth of the market. The production of advanced polymers, as industries demand chemical-resistant and breathable engineered polypropylene due to high demand, further creates growth opportunities for the market.
Segmental Insights
Product Insights
The polyethylene segment dominated the market with a 24% share in 2025 and is expected to grow at a CAGR of 10.80% over the forecast period, driven by the high demand for high flexibility, durability, and strong fluid and chemical barrier properties, as it is a need and requirement for various industries, especially healthcare, industrial plants, and food processing. Polyethylene is widely used for the production of protective gear such as gloves, face shields, and gowns, as they are used for workspace safety, aligning with the expanding government regulations.
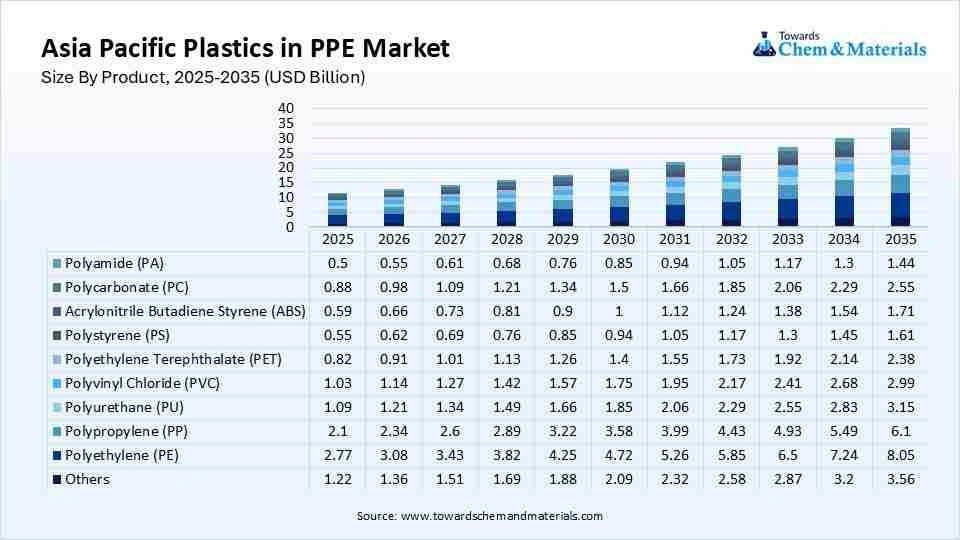
The polyurethane segment held 9.40% market share in 2025 and is expected to have the fastest growth with a CAGR of 12.80% in the forecast period, driven by the rising demand for industrial safety gear; its properties, such as chemical defense and high abrasion resistance, make it ideal for key applications in footwear, hand protection, and specialized protection garments. The increasing preference by consumers for technologically advanced material products that have properties like lightweight, comfortable, and durable ergonomic PPR gear further supports the growth of the market.
Asia Pacific Plastics in PPE Market Share, By Product, 2025(%)
| By Product | Market Share (%) |
| Polyethylene (PE) | 24.00% |
| Polypropylene (PP) | 18.20% |
| Polyurethane (PU) | 9.40% |
| Polyvinyl Chloride (PVC) | 8.90% |
| Polyethylene Terephthalate (PET) | 7.10% |
| Polystyrene (PS) | 4.80% |
| Acrylonitrile Butadiene Styrene (ABS) | 5.10% |
| Polycarbonate (PC) | 7.60% |
| Polyamide (PA) | 4.30% |
| Polysulfone (PSU) | 1.70% |
| Polyphenylsulfone (PPSU) | 1.30% |
| Acrylic | 2.50% |
| Polyester | 3.20% |
| Others | 1.90% |
Application Insights
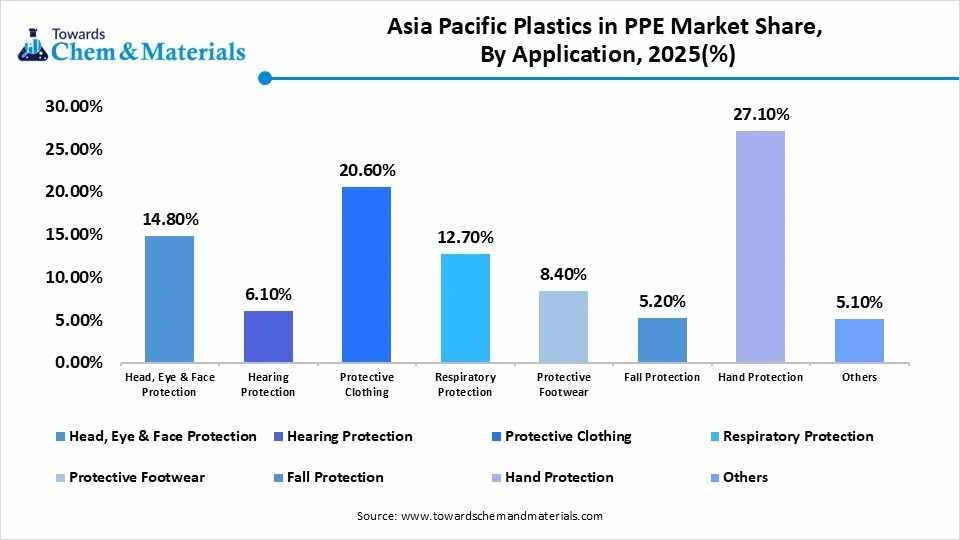
The hand protection segment dominated the market with a 27.10% share in 2025 and is expected to have the fastest growth with a CAGR of 12.40% in the forecast period, driven by large-scale manufacturing capabilities in the region due to demand for plastic and polymer-based materials like PVC, nitrile, and latex. The ongoing hygiene requirements in healthcare and food processing drive expansion of the market. The extensive use in healthcare, pharmaceuticals, and food handling, which helps in preventing biological contamination and chemical irritation, further fuels the growth of the market.
Asia Pacific Plastics in PPE Market Share, By Application, 2025(%)
| By Application | Market Share (%) |
| Head, Eye & Face Protection | 14.80% |
| Hearing Protection | 6.10% |
| Protective Clothing | 20.60% |
| Respiratory Protection | 12.70% |
| Protective Footwear | 8.40% |
| Fall Protection | 5.20% |
| Hand Protection | 27.10% |
| Others | 5.10% |
Regional Analysis
How did China Dominate the Asia Pacific Plastics in PPE Market in 2025?
The China Plastics in PPE market size was estimated at USD 5.76 billion in 2025 and is projected to reach USD 16.75 billion by 2035, growing at a CAGR of 11.27% from 2026 to 2035. China dominated the Asia Pacific plastics in PPE market with a share of 49.90% in 2025 and is expected to grow at a CAGR of 11.70% over the forecast period.
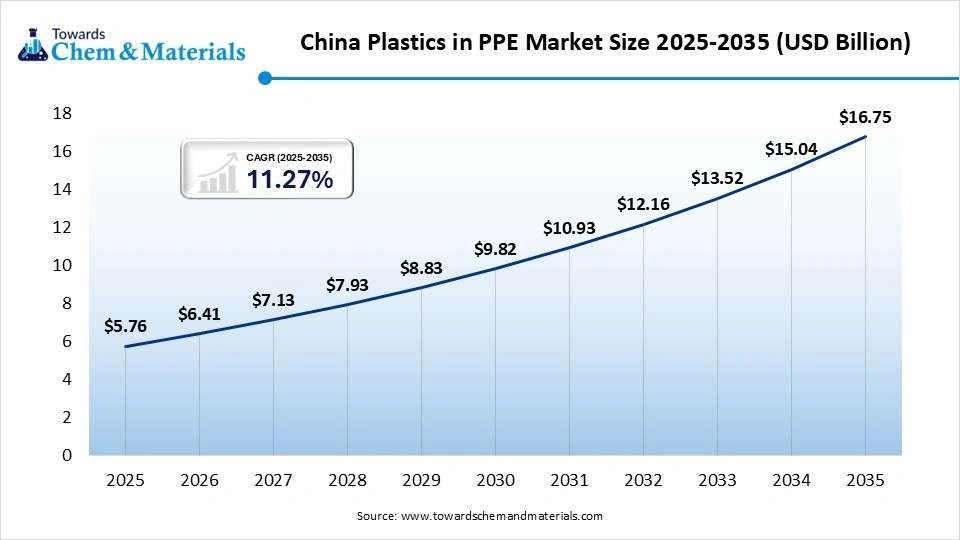
driven by the presence of a massive manufacturing sector and heavy industrial investment, with a strong supply chain of raw materials, which helps in creating low-cost labor and advanced logistics, which results in increased production supporting the economy. The strong governmental policies in the country, with heavy investment, allow suppliers to produce high volumes of plastic PPE globally, supporting market growth. The presence of key companies in the region, as well as massive domestic demand for safety gear, further propels the growth of the market.
India Plastics in PPE Market: Innovation and Development
India Plastics in PPE market size was estimated at USD 2.11 billion in 2025 and is projected to reach USD 6.15 billion by 2035, growing at a CAGR of 11.29% from 2026 to 2035. India held an 18.30% market share in the Asia Pacific plastics in PPE market in 2025 and is expected to experience the fastest growth with a CAGR of 13.1% in the forecast period, driven by the boom in domestic manufacturing and expanding healthcare sector, which continues demand for protective gear for the employees supporting increased production. The presence of dense petrochemical and lead consumption and raw material production due to availability in major states like Maharashtra and Gujarat predominantly supports the growth. India being the major exporter of medical disposables and plastic-coated PPE supports the export growth. Manufacturers like Sure Safety and Ansell have introduced recyclable polymer and recycled PET-blended PPE, and greenfield production plants with high-grade surgical polymer for protection support the growth.
Australia Plastics in PPE Market: Presence of Key Suppliers
Australia Plastics in PPE market size was estimated at USD 0.31 billion in 2025 and is projected to reach USD 0.92 billion by 2035, growing at a CAGR of 11.49% from 2026 to 2035. Australia held a 2.70% market share in the Asia Pacific plastics in PPE market in 2025, driven by the presence of heavy industries and market shifts, and key suppliers presence as distributors like Bunzl Safety AU stock, which is a leading protective brands transition towards eco-friendly composites further supports the growth. The eco-friendly and sustainable product launch, like GloveOn COATS biodegradable introduced by MNU Australia and bio-based hard hats introduced by USDA-certified bio-based gear, plays an important role in the growth of the market.
South Korea Plastics in PPE Market
South Korea Plastics in PPE market size was estimated at USD 0.88 billion in 2025 and is projected to reach USD 2.57 billion by 2035, growing at a CAGR of 11.31% from 2026 to 2035. South Korea held a 7.60% market share in the Asia Pacific plastics in PPE market in 2025, driven by the advanced manufacturing and life science laboratories presence in the country, which demand for safety gear supports the increased production. The local manufacturers are shifting towards advanced breathable composites and precision production of products for certified and cleanroom plastics that offer high chemical resistance, improving the working of the product. The shift towards the use of recycled plastics in the manufacturing of safety gear like helmets and specialized disposable bags further creates exceptional growth in the market.
Japan Plastics in PPE Market: Regulatory Compliance
Japan Plastics in PPE market size was estimated at USD 1.16 billion in 2025 and is projected to reach USD 3.52 billion by 2035, growing at a CAGR of 11.74% from 2026 to 2035. Japan held a 10% market share in the Asia Pacific plastics in PPE market in 2025, driven by the demand for regulatory compliance for manufacturing, chemical, and medical fields for safety gear, as high industrial automation and healthcare standards support growth. The integration of IoT and micro sensors in protective gear for real-time monitoring of workers health and vitals is a major innovation in smart gear; the shift towards eco-friendly and bio-based plastics, which helps in managing disposable PPE waste, is a major growth factor in the market.
Recent Developments
- In May 2025, Oliver Healthcare Packaging has inaugurated a 120,000-square-foot manufacturing plant in Johor, Malaysia, boosting its medical packaging output in the expanding healthcare market of Asia-Pacific. The new site will manufacture medical-grade pouches, lids, and roll stock within ISO 13845, ISO-7, and ISO-8 certified cleanrooms. It complements the companys existing regional facilities, including an ISO-7 converting plant in Suzhou, China, and a packaging design and testing laboratory in Singapore.(Source: plastics-rubber.basf.com)
Competitive Analysis
The key players and governmental collaborations with chemical industries and other major hubs to maintain circular sustainability, lightweight polymers, and local manufacturing scalability help in market expansion.
Leading raw material providers active in regional development include BASF SE, SABIC, and Covestro AG, which supply specialized plastics for helmets, face shields, and medical PPE.
- Material giants like Dow partner with regional operators, such as their circular plastic recycling initiative with SCGC in Thailand, to secure sustainable polymer supply chains for regional manufacturing to transform 200KTA of plastic waste into circular products by 2030.(Source: corporate.dow.com)
- BASF SE Supplies specialized thermoplastic polyurethanes such as Elastollan and polyurethane systems Elastopan, utilized by regional safety footwear and shock-absorbing gear manufacturers.(Source: plastics-rubber.basf.com)
Global Tech Giants like 3M, Honeywell, and DuPont maintain joint ventures and localized distribution networks across China, India, and Southeast Asia to source raw plastic components and assemble compliant industrial safety equipment.
Top players in the Asia Pacific Plastics in PPE Market & Their Offerings
| Company | Company Type/Position | Major Headquarters | Geographic Presence | Plastics in PPE Offerings | Key Offering/Strength |
| 3M Company | Global PPE and safety products manufacturer | Saint Paul, Minnesota, USA | Asia Pacific, North America, Europe, Latin America | Polypropylene and other polymer-based respirators, face shields, protective eyewear, helmets, and protective equipment | Broad plastic-based PPE portfolio with strong product innovation and regional distribution |
| DuPont de Nemours, Inc. | Advanced materials and protective solutions manufacturer | Wilmington, Delaware, USA | Asia Pacific, North America, Europe, Latin America | Tyvek®, Tychem®, ProShield® and other polymer-based protective clothing and coveralls | Advanced polymer barrier materials offering protection against chemicals, particulates, and biological hazards |
| Honeywell International Inc. | Industrial safety and PPE manufacturer | Charlotte, North Carolina, USA | Asia Pacific, North America, Europe, Middle East | Plastic-based respirators, safety goggles, face shields, helmets, and protective equipment | Comprehensive safety portfolio combining durable polymer components with advanced protection technologies |
| Ansell Limited | Protective equipment and safety products manufacturer | Richmond, Victoria, Australia | Asia Pacific, North America, Europe, Latin America | Polymer-based protective gloves, chemical-resistant clothing, and disposable PPE | Strong expertise in hand and body protection for healthcare and industrial applications |
| MSA Safety Incorporated | Industrial safety equipment manufacturer | Cranberry Township, Pennsylvania, USA | Asia Pacific, North America, Europe, Latin America | Polymer-based helmets, face protection, respirators, and protective equipment | Specialized safety solutions combining engineered plastics with respiratory, head, and face protection technologies |
Other Top Players Are
- BASF SE
- SABIC
- LG Chem
- Sumitomo Chemical Co., Ltd.
- Arkema Group
- Celanese Corporation
- Evonik Industries AG
- Asahi Kasei Corporation
- Shin-Etsu Chemical Co., Ltd.
- Formosa Plastics Corporation
- Mitsubishi Chemical Group
- Teijin Limited
- Toray Industries
- Covestro AG
- Solvay
- Dow
- ExxonMobil Corporation
- Reliance Industries Limited
- Polyplastics Co., Ltd.
Segments Covered
By Product
- Polyethylene (PE)
- HDPE
- LDPE
- LLDPE
- UHMWPE
- Polypropylene (PP)
- Homopolymer PP
- Copolymer PP
- Melt-blown PP
- Spunbond PP
- Polyurethane (PU)
- TPU
- Flexible PU
- Rigid PU
- Polyvinyl Chloride (PVC)
- Flexible PVC
- Rigid PVC
- Polyethylene Terephthalate (PET)
- Virgin PET
- Recycled PET
- Polystyrene (PS)
- GPPS
- HIPS
- Acrylonitrile Butadiene Styrene (ABS)
- Standard ABS
- Impact-modified ABS
- Flame-retardant ABS
- Polycarbonate (PC)
- Optical-grade PC
- Impact-resistant PC
- Flame-retardant PC
- Polyamide (PA)
- PA6
- PA66
- High-performance PA
- Polysulfone (PSU)
- Standard PSU
- Medical-grade PSU
- Polyphenylsulfone (PPSU)
- Medical-grade PPSU
- High-temperature PPSU
- Acrylic
- PMMA
- Impact-modified acrylic
- Polyester
- PET-based polyester
- Specialty polyester
- Others
- Specialty engineering plastics
- Bio-based polymers
- Polymer blends
By Application
- Head, Eye & Face Protection
- Safety helmets
- Safety goggles
- Face shields
- Protective visors
- Hearing Protection
- Earplugs
- Earmuffs
- Protective Clothing
- Coveralls
- Gowns
- Aprons
- Chemical-resistant suits
- High-visibility clothing
- Respiratory Protection
- Disposable masks
- N95/KN95-type respirators
- Reusable respirators
- Respirator cartridges
- Protective Footwear
- Safety shoes
- Safety boots
- Chemical-resistant footwear
- Disposable shoe covers
- Fall Protection
- Safety harnesses
- Lanyards
- Connectors
- Positioning equipment
- Hand Protection
- Disposable gloves
- Chemical-resistant gloves
- Cut-resistant gloves
- Impact-resistant gloves
- Thermal-resistant gloves
- Others
- Protective accessories
- Specialized industrial PPE
- Multi-purpose protective equipment
By Country
- China
- Japan
- India
- South Korea
- Taiwan
- Rest Of Asia Pacific
A Seven-Phase Framework
Our methodology is designed to be universally applicable across commodity chemicals, specialty chemicals, petrochemicals, construction chemicals, coatings, electronic chemicals, industrial gases, agrochemicals, water treatment chemicals, and performance materials. Each phase builds upon the last, creating a layered validation structure that minimizes estimation error and maximizes analytical confidence.
The framework ensures comprehensive market coverage, robust cross-validation, and reliable long-term forecasting — producing market estimates that withstand scrutiny from investors, regulators, and corporate strategy teams.

Seven-Phase Framework — Analytical Effort Distribution
Relative analytical effort allocated across each phase of the Chemicals & Materials research framework

Phase 1 - Secondary Research: Establishing the Foundation
Secondary research collects and evaluates publicly available information from authoritative sources, establishing the foundational understanding of market structure, value chain dynamics, competitive landscape, and end-use demand patterns. Every source is evaluated for credibility, recency, geographic relevance, and methodological soundness before inclusion.
Industry Associations
Sources include ACC, CEFIC, ICCA, JCIA, CPCIF, and SOCMA providing production volumes, consumption trends, capacity developments, and sustainability initiatives.
Company Disclosures
Annual reports, investor presentations, earnings transcripts, and regulatory filings reveal product portfolios, manufacturing footprints, capacity expansions, and revenue segmentation.
Government Databases
National statistical offices, customs authorities, environmental agencies, and industrial production databases provide verified statistics on output, trade flows, and regulatory compliance.
Trade Databases
UN Comtrade, ITC, Eurostat, and national customs authorities enable assessment of global product movement, import dependency, and export competitiveness across regions.
Our Secondary Research Sources
- Ministry of Chemicals and Fertilizers
- European Chemicals Agency
- United States Department of Energy
- Ministry of Industry and Information Technology
- Ministry of Economy Trade and Industry
- Ministry of Trade Industry and Energy
- National Institute of Standards and Technology
- Council of Scientific and Industrial Research
- Fraunhofer Society
- National Institute for Materials Science
Phase 2 — Supply-Side Assessment: Mapping Production Capabilities
Production Capacity Analysis
All major manufacturers are assessed for existing installed capacity, planned additions, expansions, new plant announcements, and technology adoption — mapped at global, regional, and country levels.
Capacity Utilization Adjustment
Installed capacity is adjusted using utilization rates based on demand conditions, feedstock availability, plant operating rates, maintenance schedules, and regulatory restrictions.
Manufacturer Revenue Analysis
Product-specific revenues, segment-level performance, regional distribution, average selling prices, and margin trends are evaluated to establish market value estimates.
Supply-Side Assessment — Capacity vs. Effective Production by Region
Illustrative comparison of installed capacity vs. effective production volume (after utilization rate adjustment) across major regions

Phase 3 — Demand-Side Assessment: Quantifying Chemical Consumption
Demand-side analysis quantifies chemical consumption across industries, applications, and geographies — identifying where and how chemicals are consumed throughout the value chain with precision.
End-Use Industry Analysis
Chemical demand is evaluated across automotive, construction, packaging, electronics, agriculture, healthcare, consumer goods, industrial manufacturing, energy and utilities, and water treatment. Industry output, production trends, and consumption intensity are analyzed to determine demand patterns.
Consumption Modeling
Demand is estimated using measurable indicators: kilograms per vehicle, kilograms per square meter of construction, dosage per cubic meter of water treated, kilograms per hectare of agricultural land, and kilograms per ton of manufactured products. Consumption factors are validated through industry publications and primary interviews.
Application Analysis
The market is segmented by application area to understand product performance requirements, formulation trends, technology adoption, customer preferences, and regulatory requirements improving demand accuracy and segmentation granularity.
Demand-Side Assessment — End-Use Industry Demand Distribution
Illustrative distribution of chemical & materials demand across key end-use industries

Phase 4 - Trade Flow Analysis: Balancing Regional Supply and Demand
Trade flow analysis reconciles regional supply and demand estimates through import and export data, identifying net supply positions, regional dependencies, and market imbalances. It serves as an independent validation layer that tests the consistency of supply-side and demand-side estimates.
Import Analysis
Import data is evaluated to determine volumes, source countries, product dependency, regional supply gaps, and pricing trends — identifying markets that rely heavily on external supply and where domestic production is insufficient to meet demand.
Export Analysis
Export assessments reveal production surplus, export competitiveness, regional manufacturing strength, and global market participation. Export patterns also help validate domestic production estimates and identify net exporting regions.
Apparent Consumption Model
Regional consumption is assessed using the standard apparent consumption formula:
Results identify net importing regions, net exporting regions, regional deficits, and surpluses — serving as an independent validation of supply and demand estimates.
Trade Flow Analysis — Net Supply Position by Region
Illustrative apparent consumption vs. domestic production across major regions — positive gap indicates net import dependency

Phase 5 — Primary Research: The Critical Validation Layer
Primary research tests and refines findings from secondary research through direct engagement with industry participants across the supply chain, demand side, and expert community. It captures intelligence that no database or published report can provide — the real-world experience of manufacturers, buyers, and specialists operating in the market.

Supply-Side Interviews
Conversations with chemical manufacturers, raw material suppliers, contract manufacturers, technology providers, and plant operators cover production trends, capacity utilization, pricing developments, technology shifts, and competitive dynamics.

Demand-Side Interviews
Engagement with OEMs, industrial consumers, procurement managers, distributors, formulators, and end-use manufacturers focuses on consumption trends, purchasing behavior, product substitution, demand outlook, and emerging applications.

Industry Expert Consultations
Additional interviews with industry consultants, independent experts, regulatory specialists, technical professionals, and research institutions provide deeper market context and validate key analytical assumptions.
Focus Areas of Primary Research:
Market Size & Forecast Validation
Revenue estimates, volume consumption, growth rates, forecast assumptions, regional demand.Supply Chain & Value Chain Assessment
Raw material sourcing, supply chain challenges, distribution networks, procurement practices.Production & Capacity Analysis
Manufacturing capacity, utilization rates, expansion projects, plant investments.Pricing & Cost Structure Analysis
Product pricing trends, feedstock costs, energy costs, margin pressures, pricing outlook.Competitive Landscape Assessment
Volume and value estimates confirmed to be fully consistent with one another before publicationInterview Volume by Market Scope
| Study Scope | Number of Interviews |
|---|---|
| Niche Market | 20 – 30 |
| Mid-Sized Market | 30 – 50 |
| Global Market | 50 – 80 |
| Highly Fragmented Market | 80 – 120 |
Interview Details:
Category : Manufacturers, Suppliers, Distributors, End Users, Experts/Associations
Average Duration : 30–60 Minutes
Interview Mode : Video calls, telephonic interviews, expert consultations
Interview Format : Structured / Semi-Structured questionnaire
Focus Areas of Primary Research:
Market Size & Forecast Validation :
Revenue estimates, volume consumption, growth rates, forecast assumptions, regional demand.
Supply Chain & Value Chain Assessment :
Raw material sourcing, supply chain challenges, distribution networks, procurement practices.
Production & Capacity Analysis :
Manufacturing capacity, utilization rates, expansion projects, plant investments.
Pricing & Cost Structure Analysis :
Product pricing trends, feedstock costs, energy costs, margin pressures, pricing outlook.
Competitive Landscape Assessment :
Market share, competitor positioning, strategic initiatives, partnerships, acquisitions.
Primary Research — Stakeholder Coverage by Category
Distribution of interview respondents across stakeholder categories (% share from PPT data)

Primary Research — Respondent Designation Profile
Seniority breakdown of interview respondents (% share from PPT data)

Primary Research — Geographic Coverage of Interviews
Regional distribution of primary research engagement (% share from PPT data)

Phase 6 — Data Triangulation and Market Validation
No single methodology is relied upon in isolation. Multiple independent estimation approaches are combined and reconciled to ensure consistency, accuracy, and analytical defensibility. Any material deviations between approaches are investigated and adjusted through additional validation cycles.
The final market size is derived through weighted triangulation of all validated methodologies. Any material deviations between approaches are investigated and adjusted through additional validation cycles. The outcome represents the most realistic assessment of the market based on available evidence and expert confirmation ensuring that volume and value estimates are fully consistent with one another.
Triangulation Framework — Input Contribution Weight
Relative weight each sizing input contributes to the final reconciled market estimate

Phase 7 — Forecast Modeling: Projecting Future Market Evolution
Forecasting evaluates the future trajectory of the market using a combination of quantitative indicators and qualitative assessments across economic, industry, and regulatory dimensions. Rather than simple extrapolation, each driver is independently modeled and integrated into a composite forecast.
Macroeconomic Indicators
GDP growth, industrial production, manufacturing output, construction activity, consumer spending, and capital investment form the quantitative foundation of long-term demand projections. These are applied at country, regional, and global levels.
Industry Growth Drivers
Urbanization, infrastructure development, industrialization, technological innovation, sustainability initiatives, and evolving product performance requirements are assessed at regional and industry levels — capturing both structural and cyclical demand drivers.
Capacity Expansion Analysis
Announced plant expansions, new manufacturing facilities, technology upgrades, and strategic investments are evaluated to determine future supply-demand dynamics and potential market tightness or oversupply situations.
Regulatory & Sustainability
Environmental regulations, chemical safety standards, emission reduction targets, circular economy initiatives, and sustainability requirements are incorporated as they often influence product adoption rates and market growth trajectories.
Scenario Forecast Range — Indexed Market Growth (Year 1–10)
Illustrative indexed growth trajectories across Base, Optimistic, and Pessimistic scenarios over a 10-year forecast horizon

Forecast Drivers — Relative Impact Score by Category
Impact score (0–100) of each driver type on chemicals & materials market forecast




Comments
Share your thoughts, ask a question, or provide feedback about this report.